


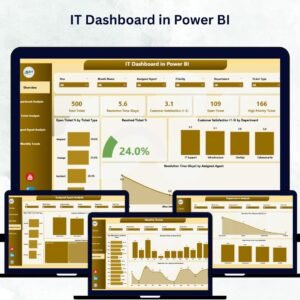
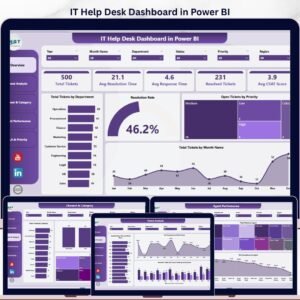
The IT Help Desk Dashboard in Power BI tracks 5 core KPIs across 5 interactive report pages, with 16 pre-built visuals and slicer-driven filtering by department, priority, channel, and agent. Setup takes under 10 minutes — just replace the sample data and the entire report refreshes automatically.
🌍 Join 8,400+ teams in 40+ countries using Nextgen Templates to replace paid SaaS tools with one-time-purchase Excel, Google Sheets, Power BI, and HTML templates.
✅ Instant download · One-time payment · No subscription · No per-user fees · Lifetime access
🔑 Key Features of the IT Help Desk Dashboard in Power BI
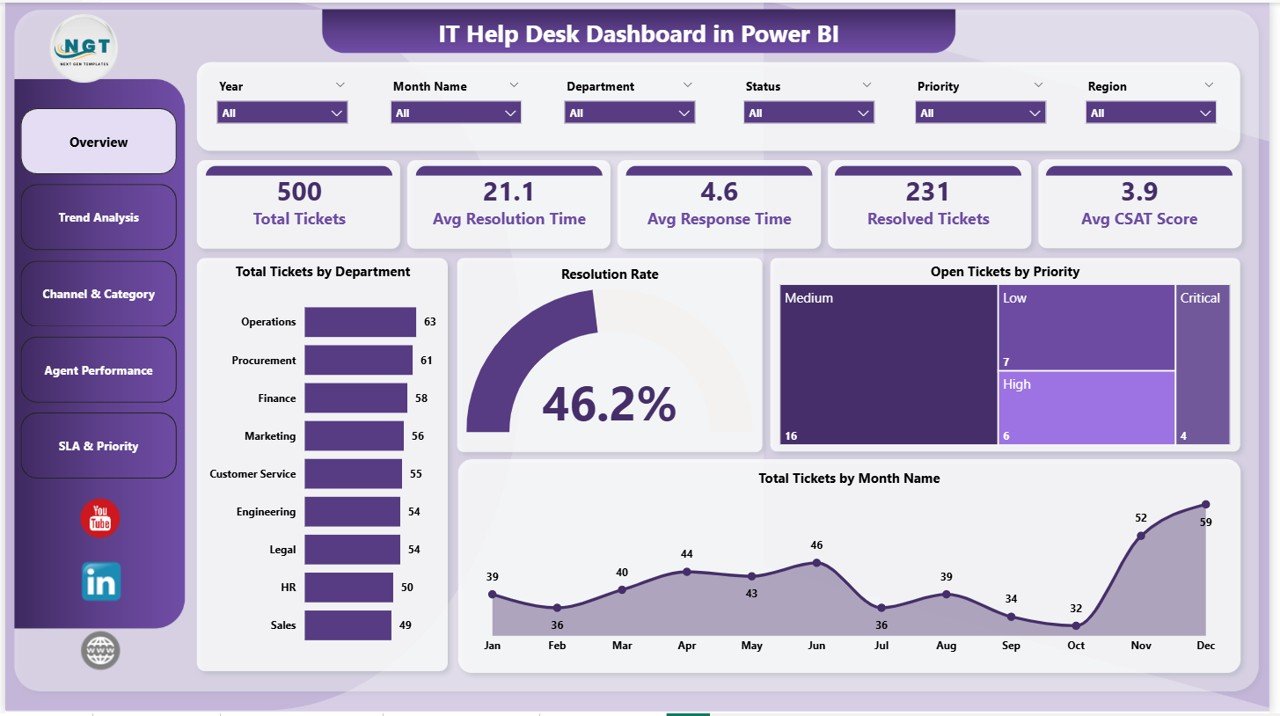
🔹 5 KPI cards on the Overview page — Total Tickets, Avg Resolution Time, Avg Response Time, Resolved Tickets, and Avg CSAT Score — give IT leaders a single-glance view of help desk health every morning.
🔹 16 pre-built visuals across 5 report pages covering Overview, Trend Analysis, Channel & Category, Agent Performance, and SLA & Priority. Every chart is bookmarked, tooltip-enabled, and ready to publish to the Power BI Service.
🔹 Slicer-driven filtering on every page — filter by Department, Priority, Channel, Category, Agent, or Month and watch all visuals recalculate in under a second. No DAX edits needed to add new dimensions.
🔹 SLA compliance tracking across three angles — by month, by agent, and by priority — so you can spot whether breaches are a workload problem, an agent-skill problem, or a P1/P2 routing problem.
🔹 CSAT scoring by channel and by agent identifies which support channels (email, phone, chat, portal) and which agents are driving customer satisfaction up or down.
🔹 Pre-written DAX measures for Total Tickets, Avg Resolution Time, Avg Response Time, Resolution Rate, SLA Compliance %, and Avg CSAT — copy them into your own model if you swap the data source.
📦 What’s Inside the IT Help Desk Dashboard in Power BI
The dashboard contains 5 fully interactive Power BI report pages. Each page combines KPI cards, charts, and slicers so you can answer specific operational questions without leaving the dashboard.
Page 1: Overview
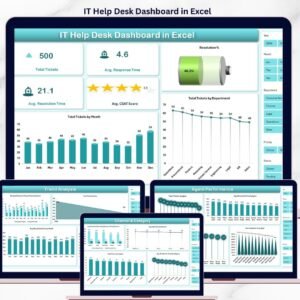
The landing page shows the 5 headline KPI cards — Total Tickets, Avg Resolution Time, Avg Response Time, Resolved Tickets, and Avg CSAT Score — plus four charts: Total Tickets by Department, Resolution Rate, Open Tickets by Priority, and Total Tickets by Month Name. Slicers at the top filter every visual instantly.
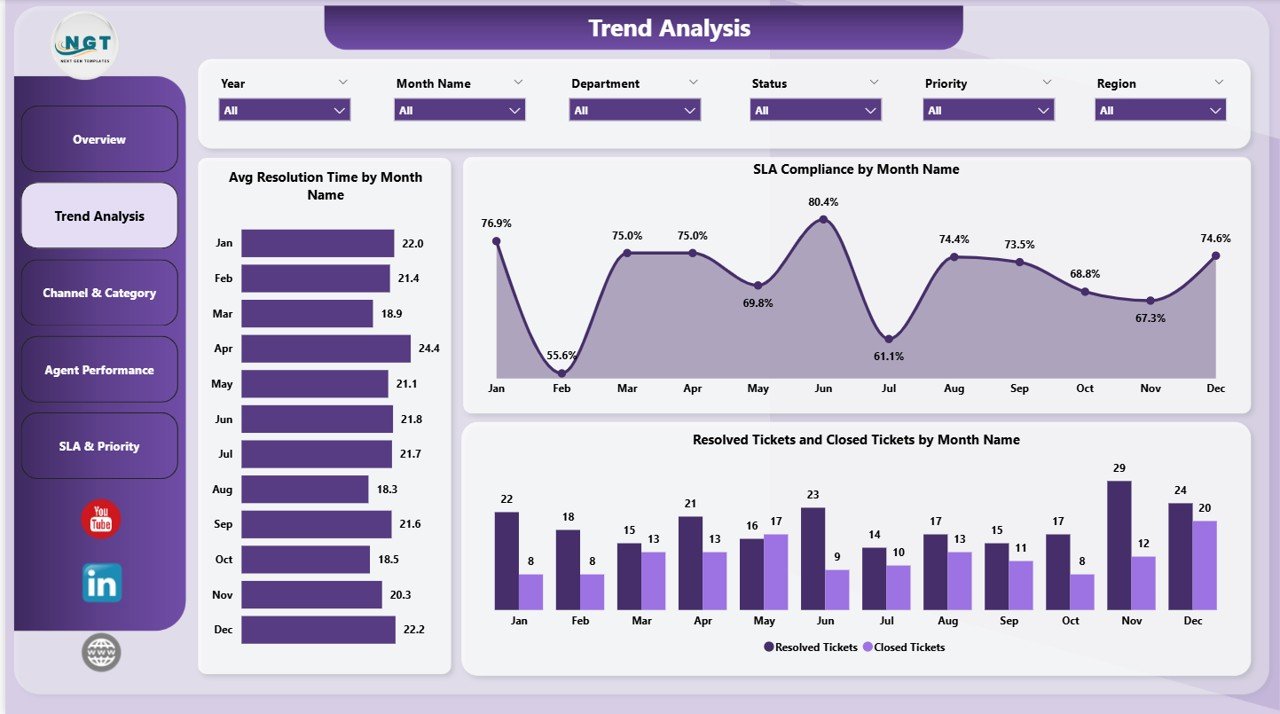
Page 2: Trend Analysis
Tracks how performance changes month over month. Includes Avg Resolution Time by Month Name, SLA Compliance by Month Name, and Resolved Tickets and Closed Tickets by Month Name — so you can spot seasonality, post-release ticket spikes, and SLA drift before they become quarterly problems.

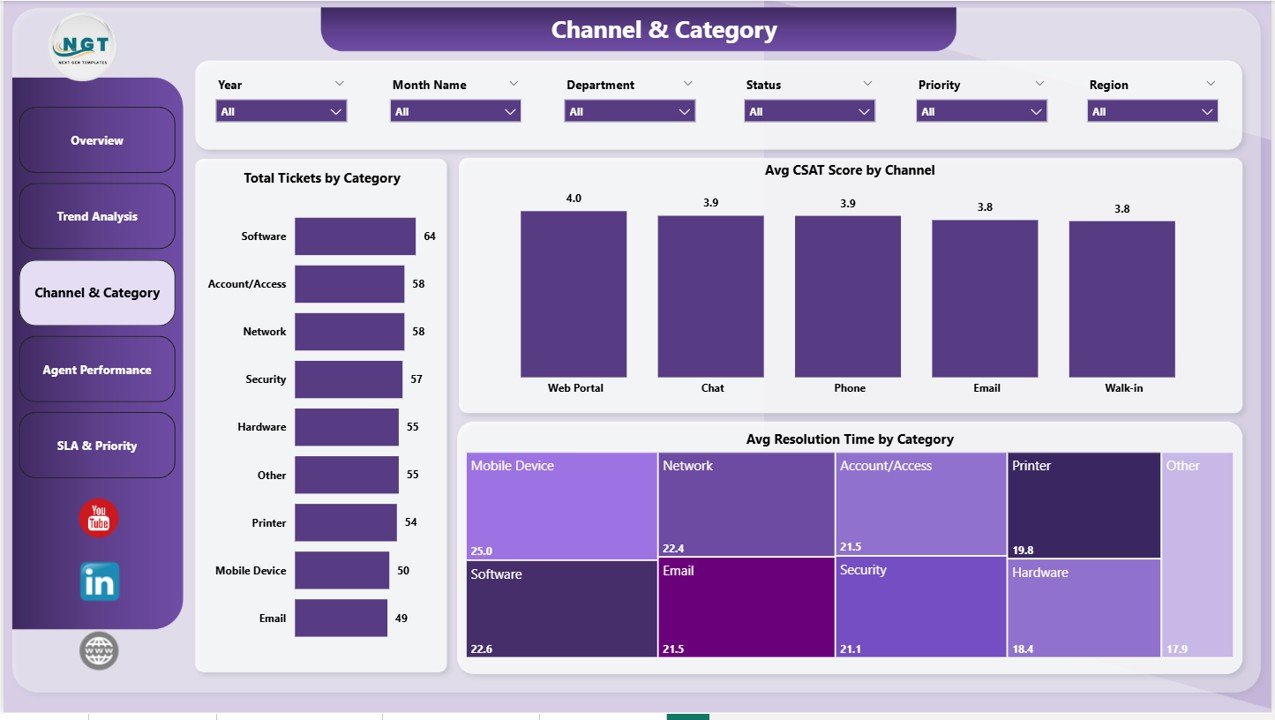
Page 3: Channel & Category
Breaks the ticket mix down by support channel and issue category. Includes Total Tickets by Category, Avg CSAT Score by Channel, and Avg Resolution Time by Category — useful for spotting which categories are eating the most agent time and which channels customers actually prefer.
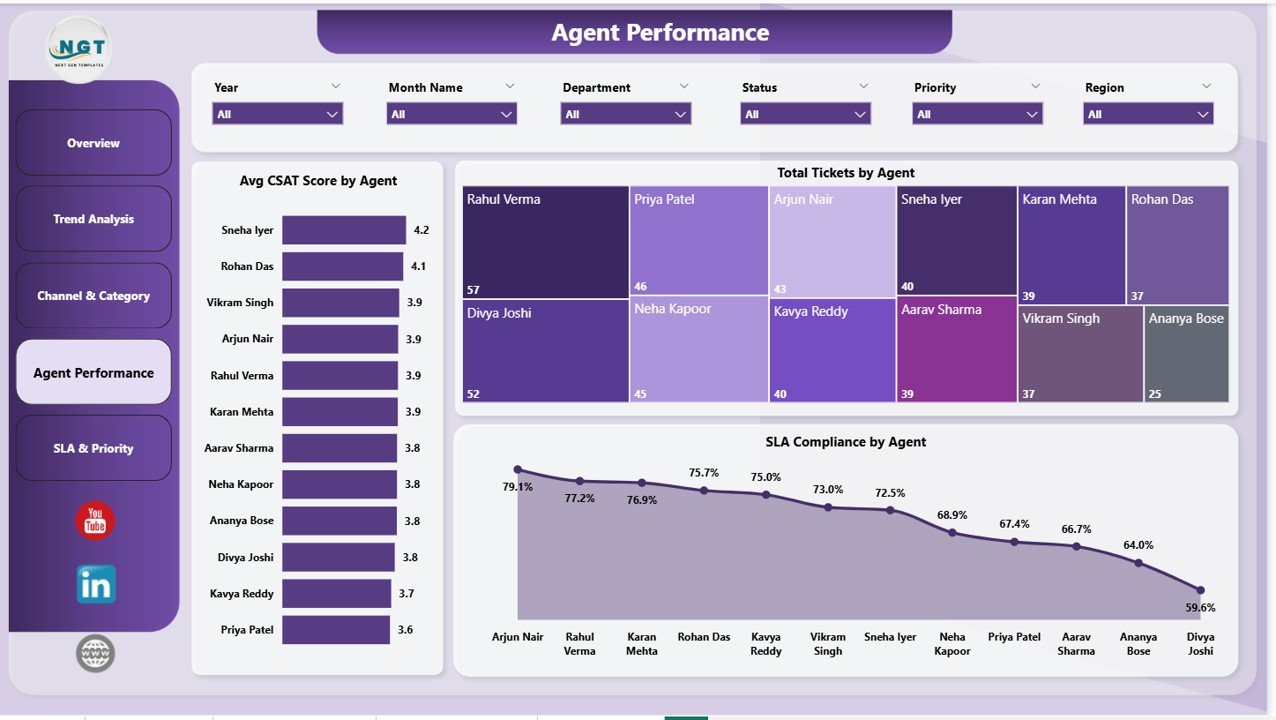
Page 4: Agent Performance
Compares every agent on three dimensions: Avg CSAT Score by Agent, Total Tickets by Agent, and SLA Compliance by Agent. Use it for 1:1 coaching, workload balancing, and quarterly performance reviews — every metric ties back to specific named agents in the data.
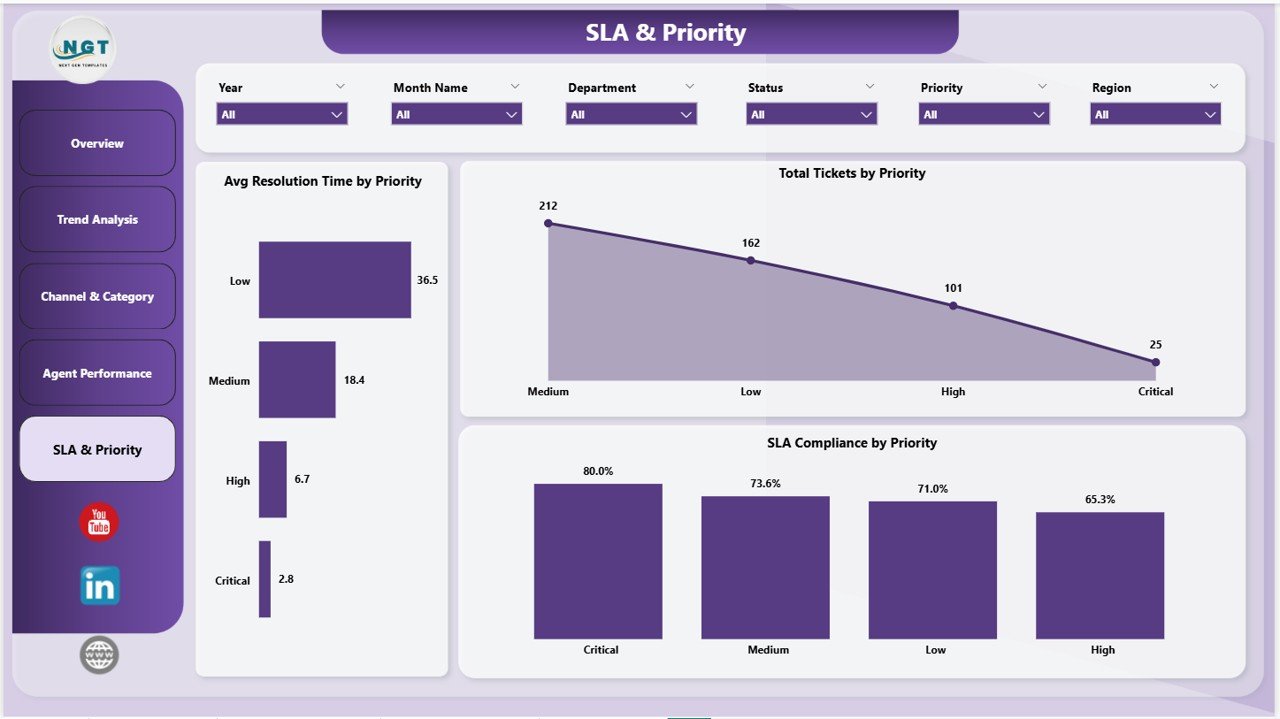
Page 5: SLA & Priority
Cross-cuts SLA compliance against ticket priority. Includes Avg Resolution Time by Priority, Total Tickets by Priority, and SLA Compliance by Priority — answers the recurring question “are we missing SLAs on P1s, or just on the long tail of P3/P4 tickets?”.

📊 IT Help Desk Dashboard in Power BI vs. Google Sheets vs. Paid IT Service Desk SaaS — Where This Fits
| Feature | IT Help Desk Dashboard in Power BI | Google Sheets / Excel Equivalent | Freshservice / Zendesk / ServiceNow |
|---|---|---|---|
| Cost | $17.99 one-time | $15–25 one-time | $19–95 / user / month |
| Platform | Power BI Desktop (free) | Excel or Google Sheets | Web app + mobile |
| Setup time | Under 10 minutes | 15–20 minutes | 2–6 weeks (integrations + permissions) |
| Live ticket logging | ❌ Reporting layer only | ❌ Reporting layer only | ✅ Full agent console |
| SLA tracking by priority & agent | ✅ Built-in across 3 pages | ✅ Manual formulas | ✅ Native |
| CSAT by channel & agent | ✅ Pre-built | ⚠️ Requires extra pivots | ✅ Native survey module |
| Customizable visuals | ✅ Full Power BI editing | ⚠️ Native charts only | ⚠️ Templated, vendor-controlled |
| Publish to Power BI Service | ✅ Yes | ❌ Not natively | N/A — vendor-hosted |
| Year-1 cost at 5 agents | $17.99 total | $15–25 total | $1,140–$5,700 |
For IT teams that already have ticket data in Excel, CSV, or a service desk export and just need executive-grade reporting without a SaaS bill, the IT Help Desk Dashboard in Power BI sits in the sweet spot.
👥 Who This Template Is For — and Who It’s Not For
✅ This template is built for:
- IT managers and service desk leads at 10–500 person companies who need monthly reporting without Freshservice or Zendesk reporting fees
- MSPs (Managed Service Providers) reporting client ticket performance back to end customers
- Power BI analysts who already have a ticket export and want a starting layout instead of building from scratch
- Internal IT teams that exported tickets from Jira Service Management, ServiceNow, or Excel and want a clean Power BI view for leadership
❌ This template is NOT for:
- Teams that need live ticket creation, agent queues, or customer-facing portals — this is a reporting layer, not a service desk
- Enterprise IT shops requiring SOC 2 Type II, SAML SSO, or on-prem Power BI Report Server certification
- Anyone without an existing ticket data source (CSV, Excel, or service desk export) to plug in
⚙️ How to Use the IT Help Desk Dashboard in Power BI
- Download the .zip and unzip it. Open the .pbix file in Power BI Desktop (free from Microsoft).
- Click Transform Data → locate the sample ticket data table → point it at your own Excel or CSV ticket export.
- Confirm the column mapping matches (Ticket ID, Department, Priority, Channel, Category, Agent, Created Date, Resolved Date, CSAT Score). Rename if needed.
- Click Close & Apply. The five report pages refresh automatically with your data.
- Tweak slicer defaults, colors, or company logo on the Overview page if desired. Publish to the Power BI Service for shared access.
💼 Real-World Use Cases
Priya runs IT operations at a 90-person SaaS company. Every Monday she opens the IT Help Desk Dashboard in Power BI, filters to last week, and reviews SLA Compliance by Priority. When P1 compliance drops below 95%, she schedules a same-day root-cause review — replacing the $89/user/month reporting add-on her company used to pay for.
Marcus is a Power BI consultant building reports for a regional MSP. Instead of designing the layout from scratch, he buys the IT Help Desk Dashboard in Power BI, swaps the sample data for the MSP’s Autotask export, rebrands the colors, and delivers a client-ready dashboard in two days instead of two weeks.
Anita is the IT Service Desk manager at a 250-person manufacturing firm. She uses the Agent Performance page in her quarterly 1:1s — Avg CSAT Score by Agent and SLA Compliance by Agent give her concrete numbers to coach against, instead of gut-feel reviews.
❓ Frequently Asked Questions
What KPIs does the IT Help Desk Dashboard in Power BI track?
The IT Help Desk Dashboard in Power BI tracks 5 core KPIs: Total Tickets, Avg Resolution Time, Avg Response Time, Resolved Tickets, and Avg CSAT Score. Each metric is sliceable by Department, Priority, Channel, Category, Agent, and Month — so the same KPI can answer team-level or company-level questions.
How long does setup take?
Under 10 minutes. Open the .pbix file in Power BI Desktop, point the data source at your own ticket export (Excel or CSV), confirm the column mapping, and click Close & Apply. All 5 report pages refresh automatically with your data.
How does this compare to Freshservice or Zendesk?
Freshservice and Zendesk are full service desk platforms that include agent consoles, customer portals, and reporting — typically $19–95 per user per month. The IT Help Desk Dashboard in Power BI is reporting-only, costs $17.99 once, and is built for teams that either already have a service desk or log tickets in Excel.
Do I need a Power BI Pro license?
No — Power BI Desktop is free from Microsoft and runs the dashboard locally without any license. You only need Power BI Pro ($14/user/month) if you want to publish the IT Help Desk Dashboard to the Power BI Service and share it with colleagues.
Can I add new KPIs or charts?
Yes. The IT Help Desk Dashboard in Power BI is fully editable — all DAX measures, visuals, and slicers are exposed in Power BI Desktop. Add new measures, swap visual types, or drop additional pages without affecting the existing layout.
Will it work with my ticket data from ServiceNow / Jira / Freshservice?
Yes, as long as you can export tickets to Excel or CSV. The IT Help Desk Dashboard in Power BI uses a single ticket table — the column structure is documented in the .pbix and matches the 9 standard fields most service desks export (Ticket ID, Department, Priority, Channel, Category, Agent, Created, Resolved, CSAT).
Can I share it with my team?
Yes. Either share the .pbix file directly with colleagues who have Power BI Desktop installed, or publish to the Power BI Service (requires Pro licenses) for browser-based access. Both options preserve all slicers, drill-throughs, and tooltips.
👤 About the Author
Built by PK — Microsoft Certified Professional with 15+ years of Excel, Google Sheets, and Power BI experience. Founder of NextGenTemplates, reaching 300K+ subscribers across YouTube channels (@PK-AnExcelExpert, @NextGenTemplates, @NeoTechNavigators). Every template is hand-built and tested before release.
🔗 Explore Related Templates
📌 Also available as: IT Help Desk Dashboard in Excel — same KPIs, same 5-page structure, built in pure Excel for teams that don’t use Power BI.
If you manage IT operations, you may also want:
- Incident Management KPI Dashboard in Power BI — pairs naturally with this dashboard for major-incident reporting.
- Customer Support SLA KPI Dashboard in Power BI — deeper SLA breach analysis across customer support tiers.
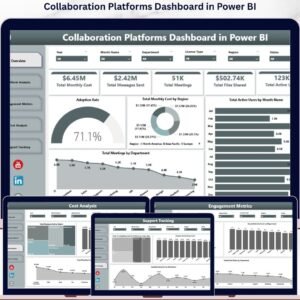
- Collaboration Platforms Dashboard in Power BI — for IT teams reporting on Teams / Slack / Zoom usage.
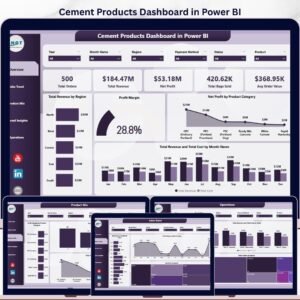
Browse the full Power BI Dashboard Templates library for 650+ ready-to-use .pbix files across HR, Sales, Finance, IT, and Operations.
📖 Click here to read the Detailed Blog Post
🎥 Visit our YouTube channel for step-by-step video tutorials
👉 YouTube.com/@NextGenTemplates
📅 Last updated: May 2026
Watch the step-by-step video tutorial:
YouTube


Reviews
There are no reviews yet.