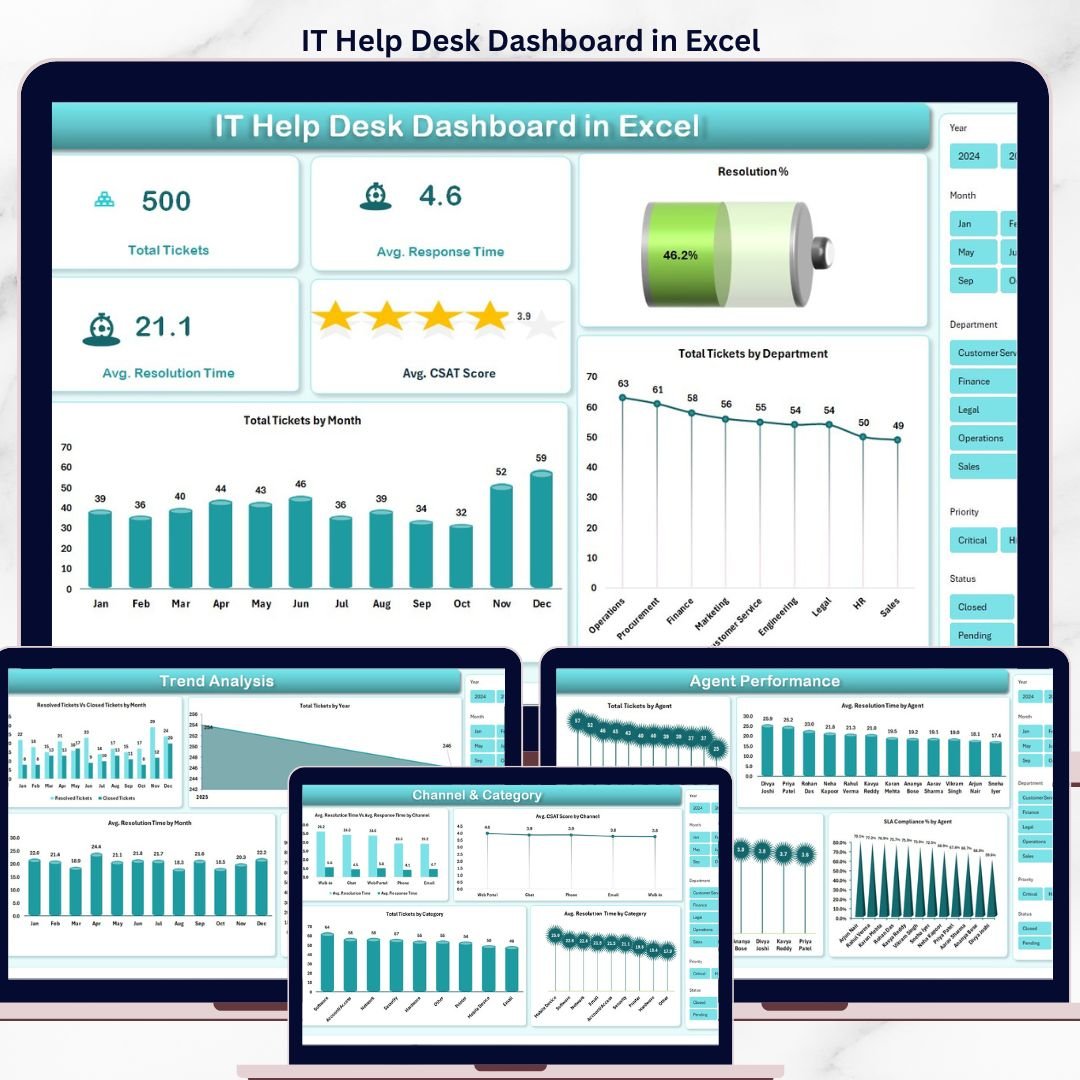
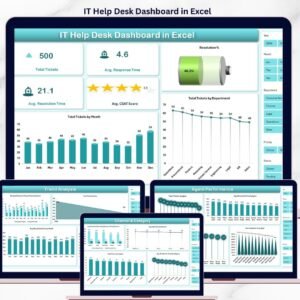
The IT Help Desk Dashboard in Excel tracks 5 ticket KPIs across 5 interactive pages, with 14 pre-built charts, slicer-driven filters, and a refresh-on-click pivot engine. Setup takes under 10 minutes — replace the sample data, click Refresh All, and every chart and KPI updates automatically.
🌍 Join 8,400+ teams in 40+ countries using NextGenTemplates to replace paid SaaS tools with one-time-purchase Excel, Google Sheets, Power BI, and HTML templates.
✅ Instant download · One-time payment · No subscription · No per-user fees · Lifetime access
IT Help Desk Dashboard in Excel
🔑 Key Features of the IT Help Desk Dashboard in Excel
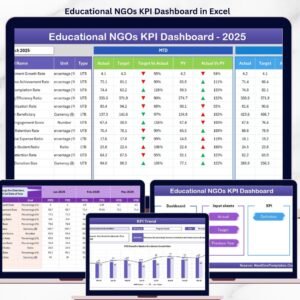
📊 5-page interactive layout – Overview, Trend Analysis, Channel & Category, Agent Performance, and SLA & Priority pages cover every angle of help desk operations.
⚡ Slicer-driven filtering – Slice tickets by Department, Channel, Priority, or Category in seconds. The same slicer state propagates across charts on each page.
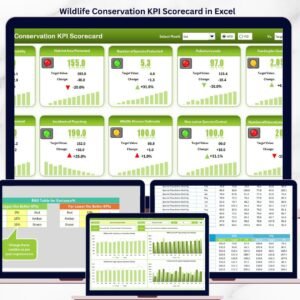
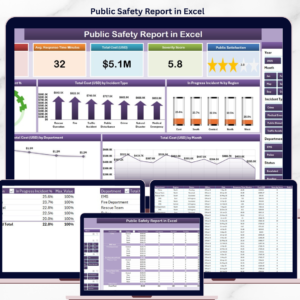
🎯 SLA compliance tracking – Monitor SLA Compliance % by Month, by Priority, and by Agent so breaches stop hiding inside aggregate numbers.
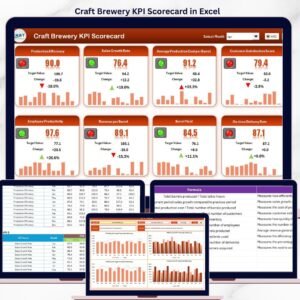
👥 Agent performance scoring – Compare Total Tickets, Average Resolution Time, CSAT, and SLA Compliance % across every agent on a single page.
🔄 One-click refresh – Update the Data sheet, hit Refresh All on the Data ribbon, and the entire dashboard recalculates from a hidden Support sheet of pivot tables.
💾 No macros, no add-ins – Pure native Excel pivot tables. Works in Excel 2016, 2019, 2021, Microsoft 365, and Excel Online — including Excel for Mac.
This template fits naturally alongside other Excel Dashboard Templates. If your help desk team is bigger or you need real-time monitoring, the Customer Support SLA KPI Dashboard in Power BI is a strong companion.
📦 What’s Inside the IT Help Desk Dashboard in Excel
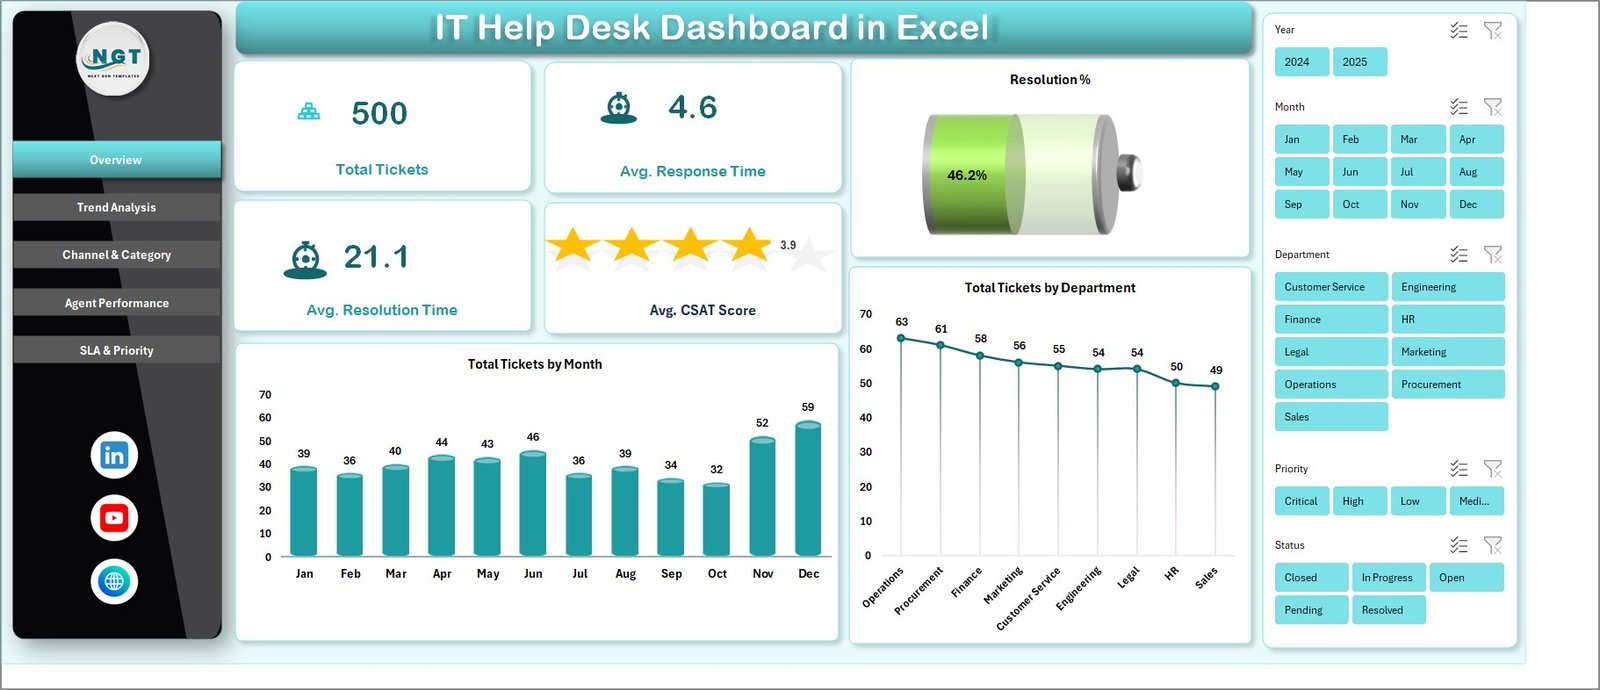
1 — Overview Page — 5 KPI cards: Total Tickets, Average Response Time, Average Resolution Time, Average CSAT Score, and Resolution %. Charts: Total Tickets by Month shows volume trend month-over-month; Total Tickets by Department shows which internal teams raise the most tickets.
Trend Analysis Page
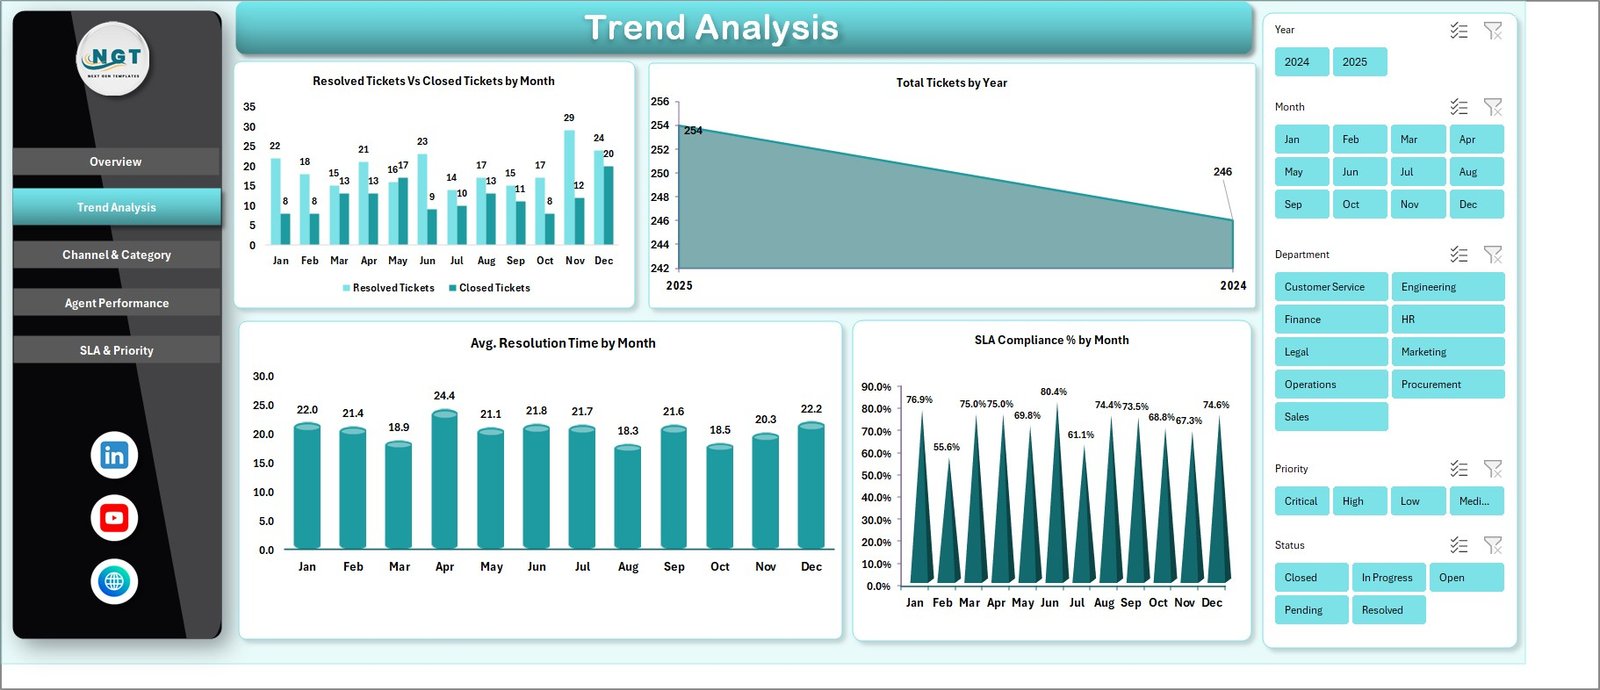
2 — Trend Analysis Page — Resolved Tickets vs Closed Tickets by Month, Total Tickets by Year, Average Resolution Time by Month, and SLA Compliance % by Month. Track whether your team is getting faster, and which months saw SLA slippage.
Channel & Category Page
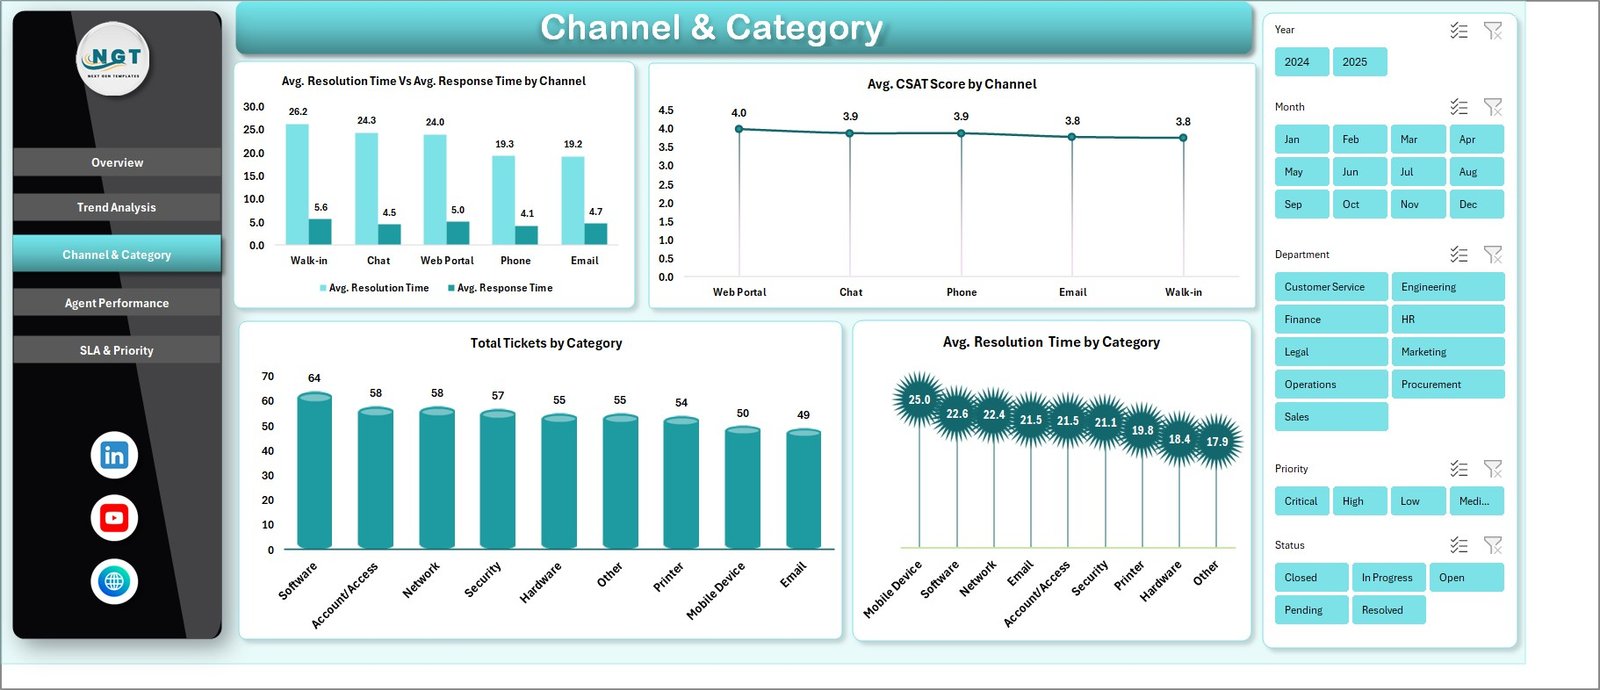
3 — Channel & Category Page — Average Resolution Time vs Response Time by Channel, Average CSAT Score by Channel, Total Tickets by Category, and Average Resolution Time by Category. See which channel delivers the best CSAT and which categories are slowest to close.
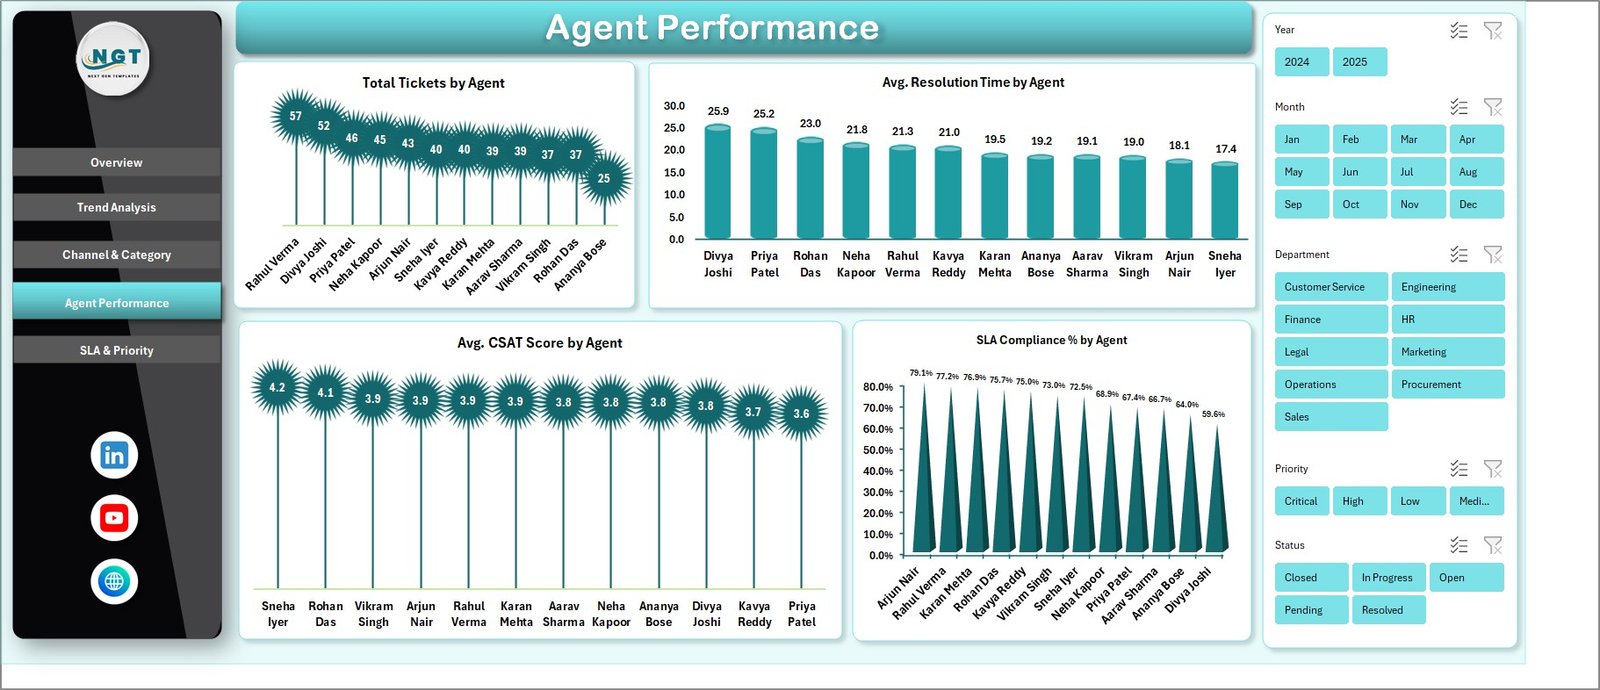
Agent Performance Page
4 — Agent Performance Page — Total Tickets by Agent, Average Resolution Time by Agent, Average CSAT Score by Agent, and SLA Compliance % by Agent. A complete per-agent scorecard on a single page.
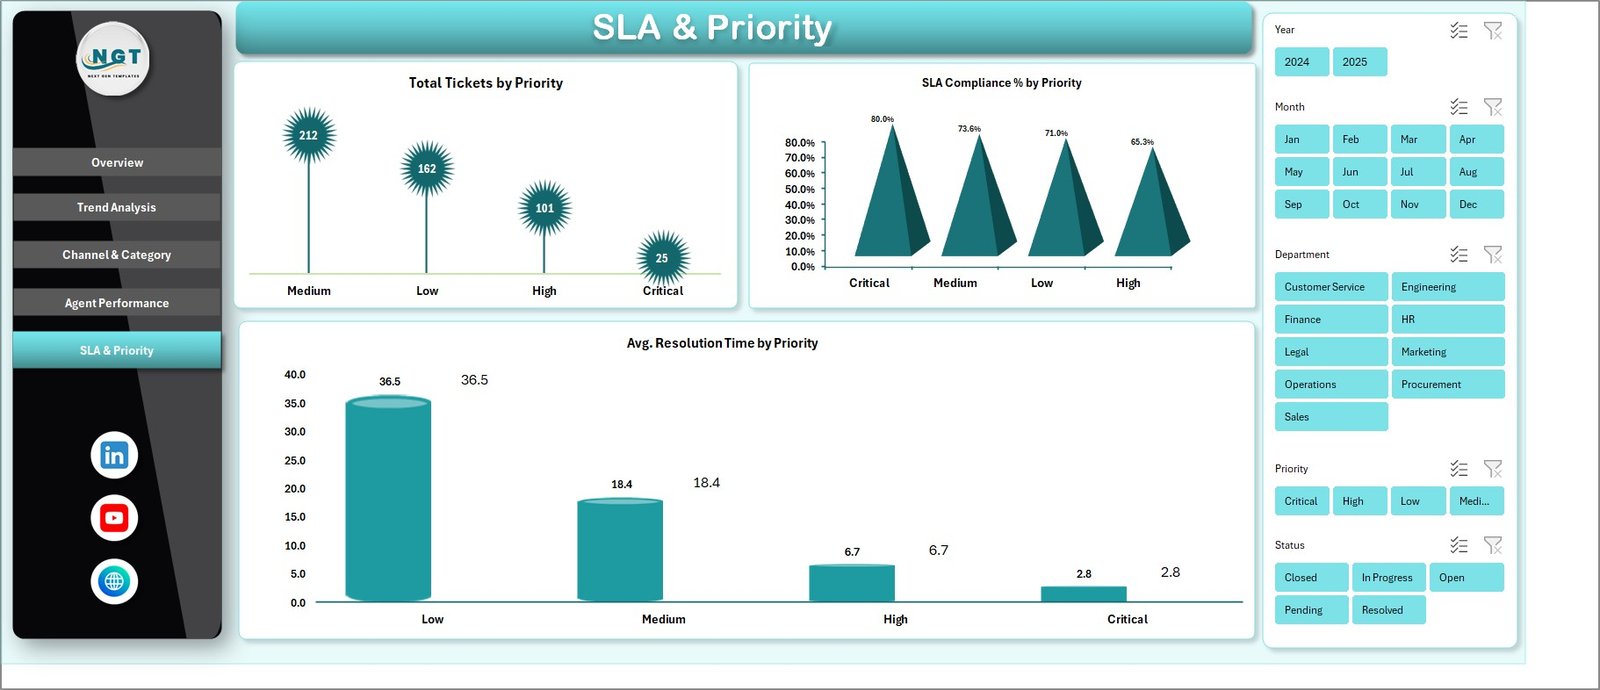
SLA & Priority Page
5 — SLA & Priority Page — Total Tickets by Priority, SLA Compliance % by Priority, and Average Resolution Time by Priority. Confirm your high-priority tickets actually move faster.
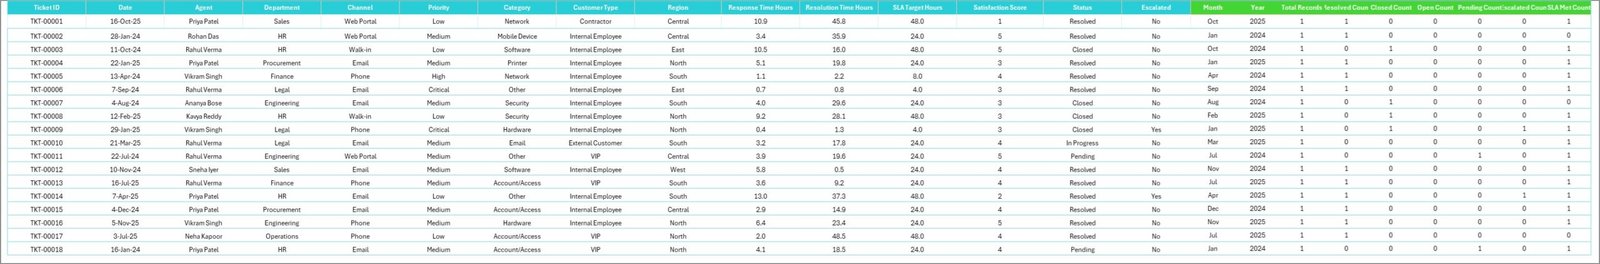
Data Sheet tab
6 — Data Sheet — Paste your raw ticket export here. Match the column structure (Ticket ID, Date, Department, Channel, Category, Priority, Agent, Response Time, Resolution Time, CSAT, Status, SLA met) and the dashboard updates.
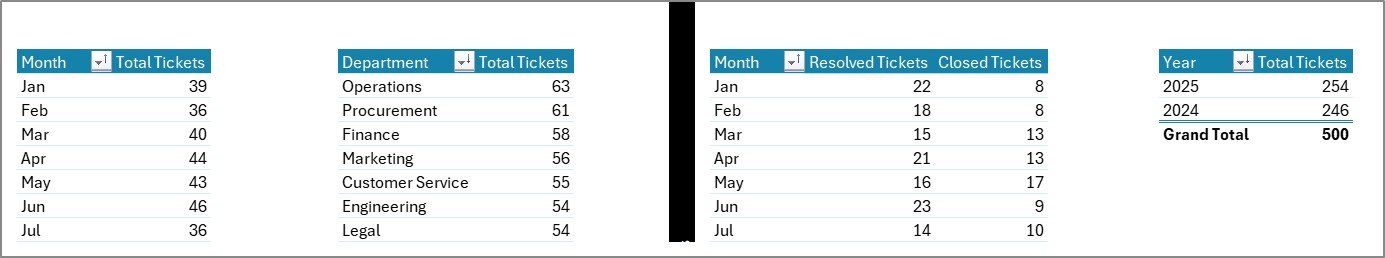
Support sheet tab
7 — Support Sheet — Houses every pivot table that feeds the charts. Click Refresh All on the Data ribbon and every pivot recalculates. Hide this sheet from end users and the dashboard stays fully dynamic.
📊 IT Help Desk Dashboard in Excel vs. Google Sheets vs. Paid Help Desk SaaS — Where This Fits
| Feature | IT Help Desk Dashboard in Excel | Google Sheets equivalent | Zendesk / Freshdesk / Jira Service Mgmt |
|---|---|---|---|
| Cost | $17.99 one-time | ~$10 one-time | $25–115 / agent / month |
| Platform | Microsoft Excel (offline) | Google Sheets (cloud) | Cloud SaaS |
| Setup time | Under 10 minutes ✅ | 15–20 minutes | Days to weeks |
| SLA compliance by priority | ✅ | ✅ | ✅ |
| Agent scorecard | ✅ | ✅ | ✅ |
| Slicer-based filtering | ✅ native Excel slicers | Filter views | UI filters |
| Works offline | ✅ | ❌ | ❌ |
| Year-1 cost at 5 agents | $17.99 | ~$10 | $1,500 – $6,900 |
| Real-time ticket queue | ❌ reporting only | ❌ reporting only | ✅ |
For IT teams that want full visibility into ticket volume, SLA compliance, and agent performance without paying $25–$115 per agent per month, the IT Help Desk Dashboard in Excel sits in the sweet spot.
👥 Who This Template Is For — and Who It’s Not For
✅ This template is built for:
- IT managers running internal help desks of 2–50 agents who need better Excel-based reporting
- MSPs and IT consultancies who export ticket data weekly and want a polished dashboard for client QBRs
- Service desk leads preparing monthly SLA compliance reports for leadership
- Solo IT admins at SMBs who want professional reporting without paying for an enterprise help desk suite
❌ This template is NOT for:
- Teams that need a real-time ticket queue with auto-routing — this is a reporting dashboard, not a ticketing tool
- Enterprise IT departments that require ITIL change-management workflows or CMDB integration
- Teams without any structured ticket export with at least Date, Channel, Priority, Agent, Resolution Time, and CSAT fields
⚙️ How to Use the IT Help Desk Dashboard in Excel
- Download and unzip the template, then open it in Microsoft Excel 2016 or later.
- Open the Data sheet and replace the sample rows with your own ticket export, keeping the same column headers.
- Go to the Data ribbon and click Refresh All — every pivot table on the Support sheet updates.
- Open the Overview page and use slicers (Department, Channel, Priority, Category) to filter every chart at once.
- Navigate the 5 page tabs to investigate trends, channels, agents, and SLA compliance.
- Hide the Support sheet before sharing — right-click the tab and choose Hide.
💼 Real-World Use Cases
Daniel runs a 12-person internal IT help desk at a manufacturing firm. Every Monday he exports the previous week’s tickets, pastes them into the Data sheet, and clicks Refresh All. By 9:30 AM he has a clean weekly SLA review for his director — without paying for an enterprise reporting add-on.
Priya leads an MSP serving 18 SMB clients. She uses one copy of the IT Help Desk Dashboard in Excel per client. Each quarterly business review now includes agent-level CSAT, SLA-by-priority, and channel mix charts pulled from a single template.
Marco is a solo IT admin at a 60-person digital agency. He has no budget for Zendesk seats, so he tracks tickets in a shared spreadsheet and uses this template monthly to show ownership where the help desk’s time actually goes.
❓ Frequently Asked Questions
What KPIs does the IT Help Desk Dashboard in Excel track?
The IT Help Desk Dashboard in Excel tracks 5 core KPIs — Total Tickets, Average Response Time, Average Resolution Time, Average CSAT Score, and Resolution % — plus 14 charts covering SLA compliance, agent performance, ticket priority, channel mix, and ticket categories.
How long does setup take?
Setup takes under 10 minutes. Open the file, replace the sample data on the Data sheet with your own ticket export, then click Refresh All on the Data ribbon. Every chart and KPI updates automatically — no formula editing needed.
How does this compare to Zendesk or Freshdesk?
Zendesk and Freshdesk are full ticketing platforms costing $25–$115 per agent per month. The IT Help Desk Dashboard in Excel is a one-time $17.99 reporting layer that runs on top of any ticket data you already export — keeping budget on the team rather than on per-agent fees.
Does the template need macros or VBA?
No. The IT Help Desk Dashboard in Excel uses only native pivot tables, charts, and slicers. There is no VBA, no macro security prompt, and no add-in installation. It works in Excel 2016, 2019, 2021, Microsoft 365, and Excel Online.
Can I add my own KPIs or charts?
Yes. The hidden Support sheet contains all the pivot tables driving the dashboard. Copy any pivot, build a new chart, link it to a slicer — the structure is open for customization. Just keep the Data sheet column layout stable.
How many tickets can the dashboard handle?
The IT Help Desk Dashboard in Excel comfortably handles tens of thousands of ticket rows. Excel’s pivot engine scales well for monthly or quarterly exports. For multi-year datasets above ~500,000 rows, consider exporting to Power BI.
👤 About the Author
Built by PK — Microsoft Certified Professional with 15+ years of Excel, Google Sheets, and Power BI experience. Founder of NextGenTemplates, reaching 300K+ subscribers across YouTube channels (@PK-AnExcelExpert, @NextGenTemplates, @NeoTechNavigators). Every template is hand-built and tested before release.
🔗 Explore Related Templates
📈 Customer Support SLA KPI Dashboard in Power BI — Power BI version focused on customer-facing support SLA compliance.
🛠️ Incident Management KPI Dashboard in Power BI — Pair this when you need MTTR, MTTA, and incident severity reporting.
🔐 Cybersecurity Risk Assessment KPI Dashboard in Power BI — Companion for IT leaders reporting both security and help desk KPIs.
📖 Click here to read the Detailed Blog Post
🎥 Visit our YouTube channel for step-by-step video tutorials
👉 YouTube.com/@NextGenTemplates
📅 Last updated: May 2026


Reviews
There are no reviews yet.