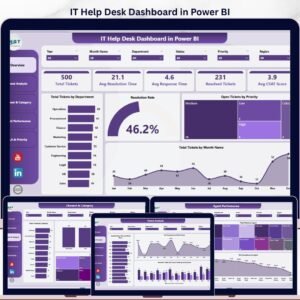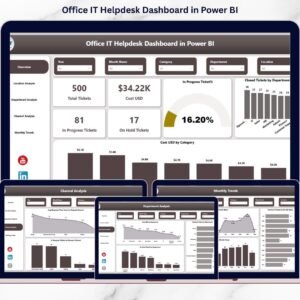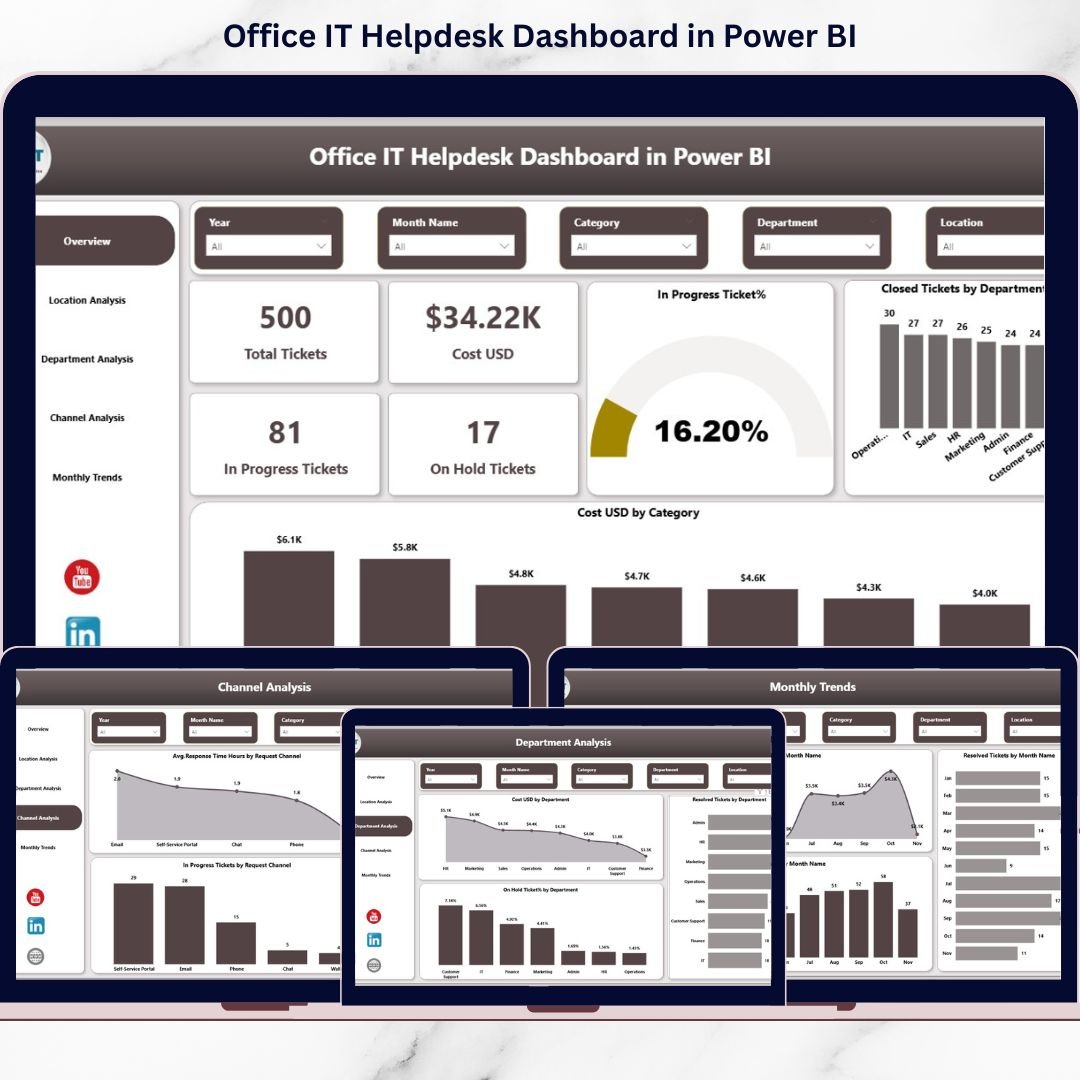
Technology issues should never slow down your office again. If your IT team is drowning in emails, scattered Excel sheets, and endless ticket follow-ups, it’s time for a smarter solution. The Office IT Helpdesk Dashboard in Power BI gives you complete visibility over tickets, costs, response time, and department workload — all in one powerful, interactive dashboard.
Stop guessing. Start managing IT performance with clarity and confidence.
🚀 Key Features of Office IT Helpdesk Dashboard in Power BI
📊 Complete Ticket Visibility – Track Total Tickets, In Progress, On Hold, and Closed Tickets in real time.
💰 Cost Monitoring (USD) – Analyze IT expenses by category, department, and location.
⏱️ Response Time Tracking – Measure average response time by request channel.
🏢 Department-Level Insights – Identify which teams generate the most tickets.
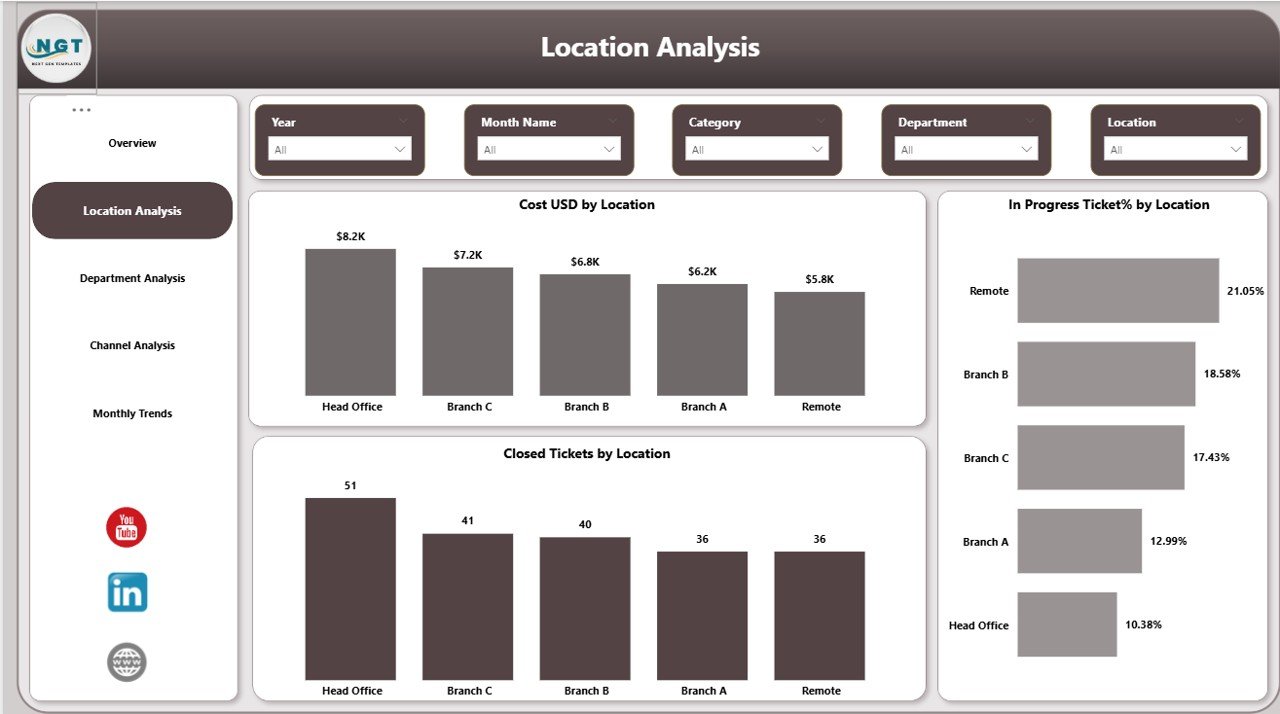
📍 Location Analysis – Compare IT workload and cost across branches.
📅 Monthly Trend Monitoring – Track ticket growth and resolution performance month by month.
🎛️ Interactive Slicers – Filter data instantly by month, department, location, or channel.
📈 Executive-Ready Reports – Clean visuals designed for management meetings.
This dashboard transforms raw IT ticket data into meaningful, decision-ready insights.
📦 What’s Inside the Office IT Helpdesk Dashboard in Power BI
This ready-to-use dashboard contains 5 fully interactive report pages:
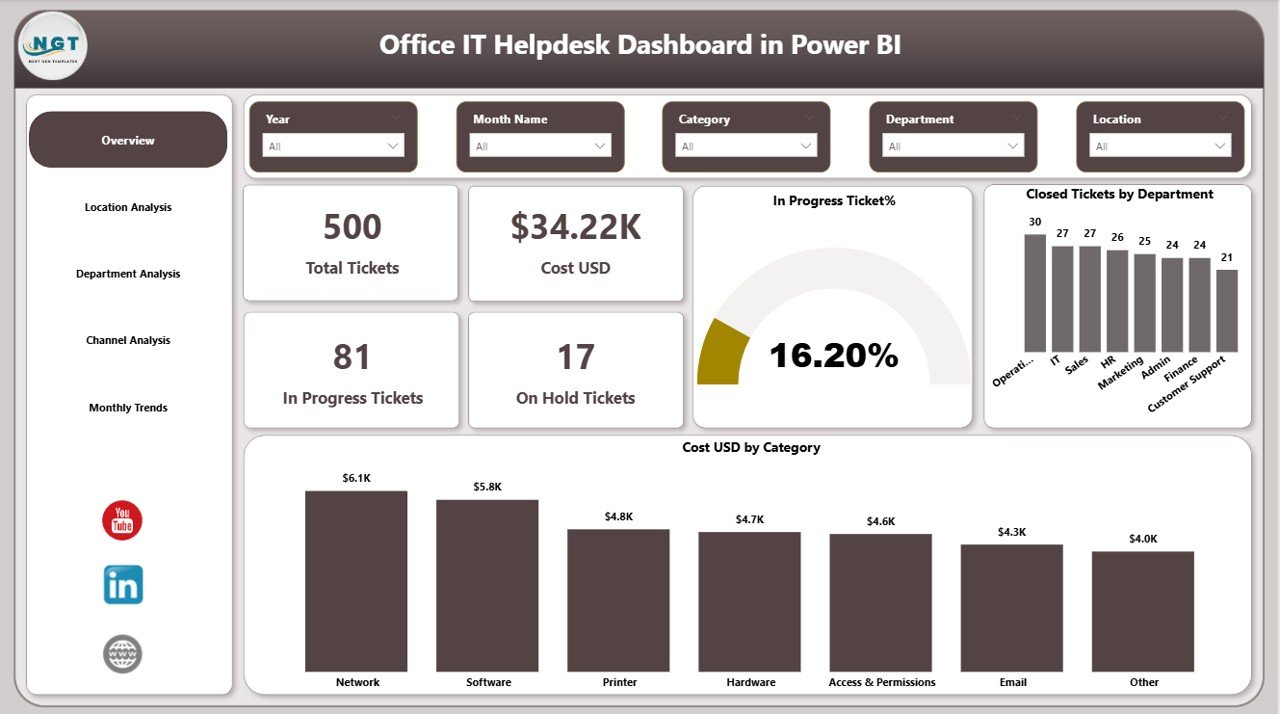
1️⃣ Overview Page
Your IT command center showing:
Total Tickets
Cost (USD)
In Progress Tickets
On Hold Tickets
Closed Tickets by Department
Cost by Category
2️⃣ Location Analysis
Cost by Location
In Progress % by Location
Closed Tickets by Location
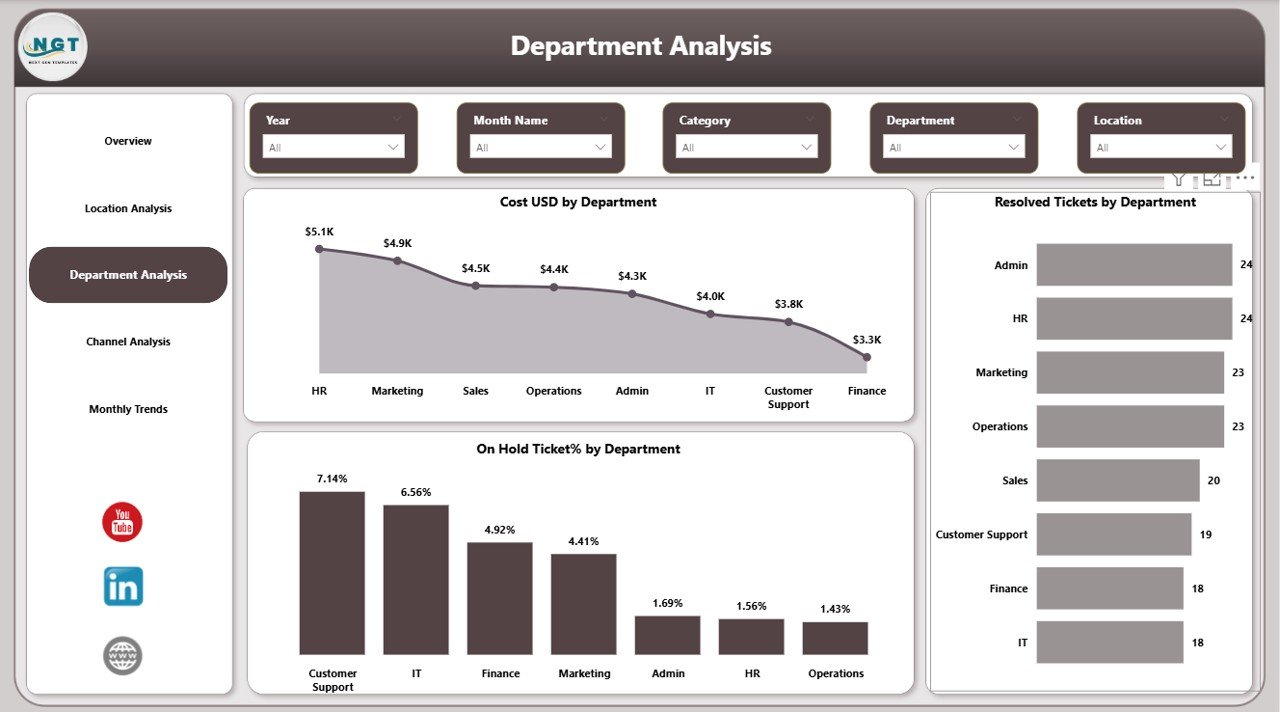
3️⃣ Department Analysis
Cost by Department
Resolved Tickets by Department
On Hold % by Department
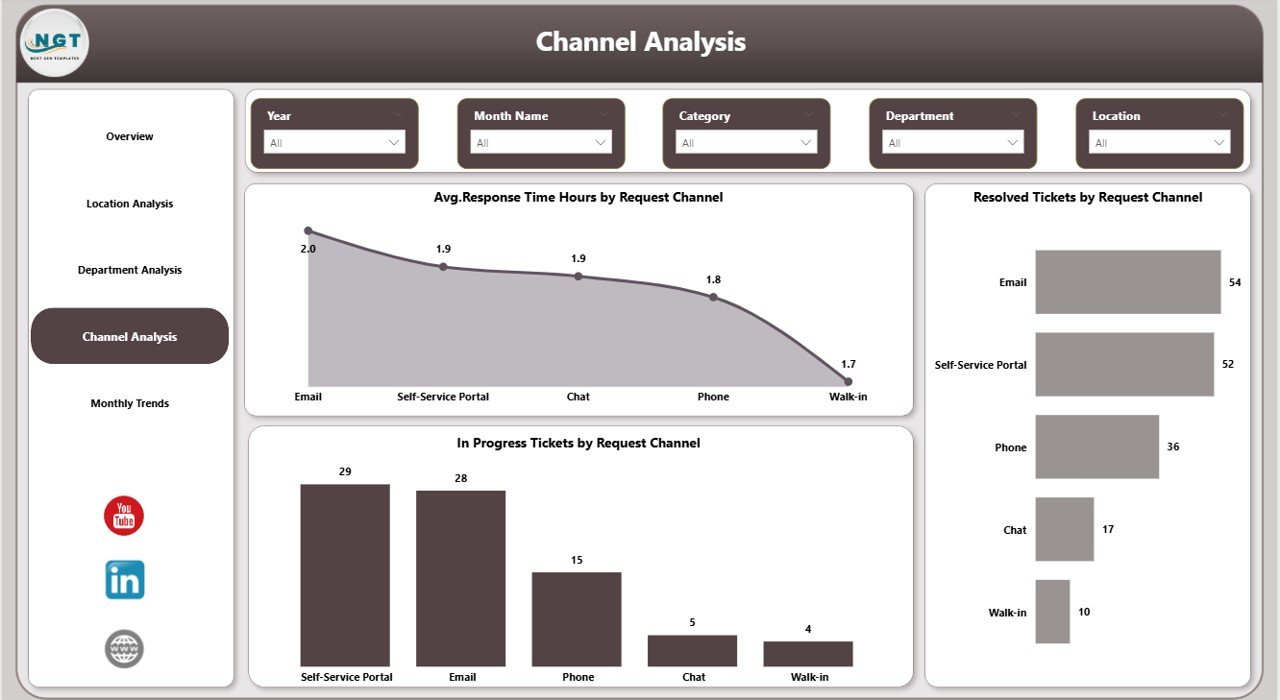
4️⃣ Channel Analysis
Average Response Time by Channel
Resolved Tickets by Request Channel
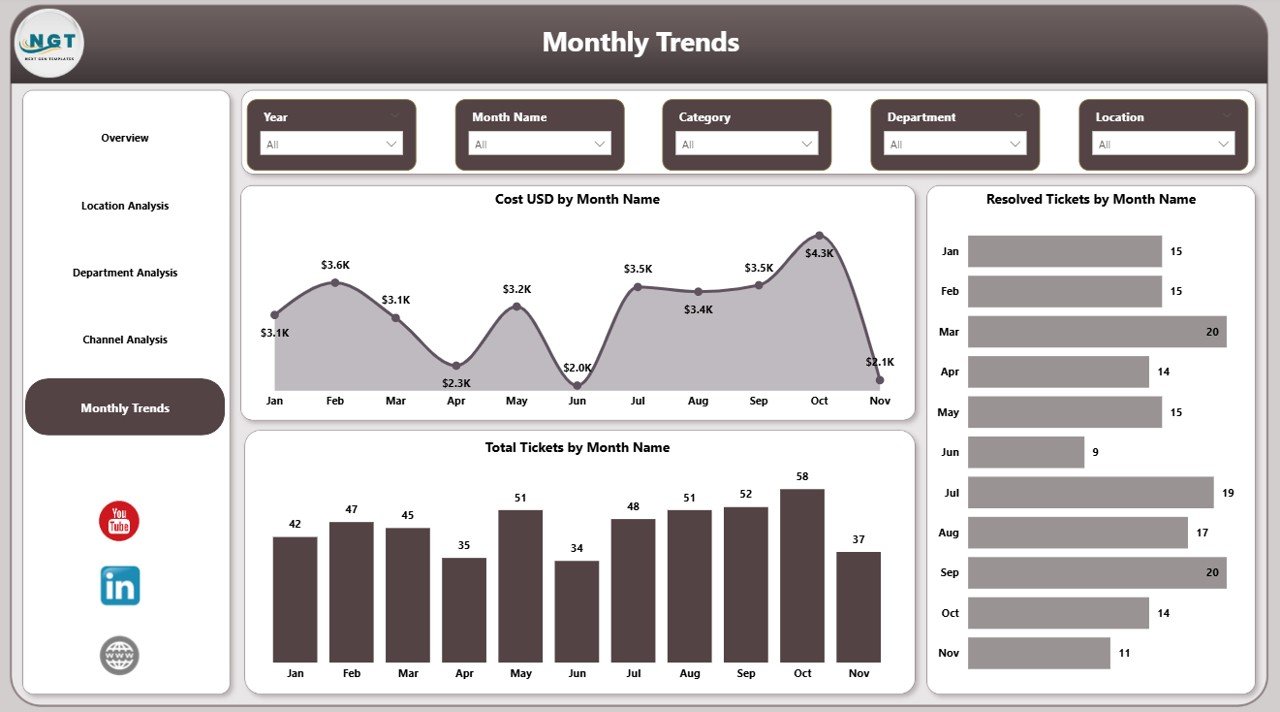
5️⃣ Monthly Trends
Total Tickets by Month
Resolved Tickets by Month
Cost by Month
Each page is designed to answer a specific business question quickly and clearly.
⚙️ How to Use the Office IT Helpdesk Dashboard in Power BI
Using this dashboard is simple:
Import your IT ticket data (Excel, ITSM tool export, ERP, or helpdesk software).
Ensure fields include date, department, location, category, status, cost, and response time.
Refresh the Power BI file.
Use slicers to filter insights by month, department, or location.
Share insights with leadership for faster decisions.
Within hours, you can turn scattered ticket logs into structured performance intelligence.
👥 Who Can Benefit from This Office IT Helpdesk Dashboard
IT Managers who want better control over ticket backlogs
HR and Operations Leaders monitoring IT support efficiency
CFOs tracking IT cost allocation
Multi-location Businesses comparing branch performance
Small and Mid-Sized Companies wanting structured IT reporting
Enterprises aiming for performance accountability
If your organization depends on technology (and every modern office does), this dashboard becomes essential.
This dashboard doesn’t just track numbers — it improves accountability, reduces delays, optimizes IT spending, and increases employee satisfaction.
Instead of manually checking reports, you gain a professional, interactive Power BI system that gives you clarity in seconds.
If you want to eliminate ticket confusion, reduce IT costs, improve response time, and make smarter decisions backed by data, this is your solution.
Click here to read the Detailed blog post
Watch the step-by-step video tutorial: