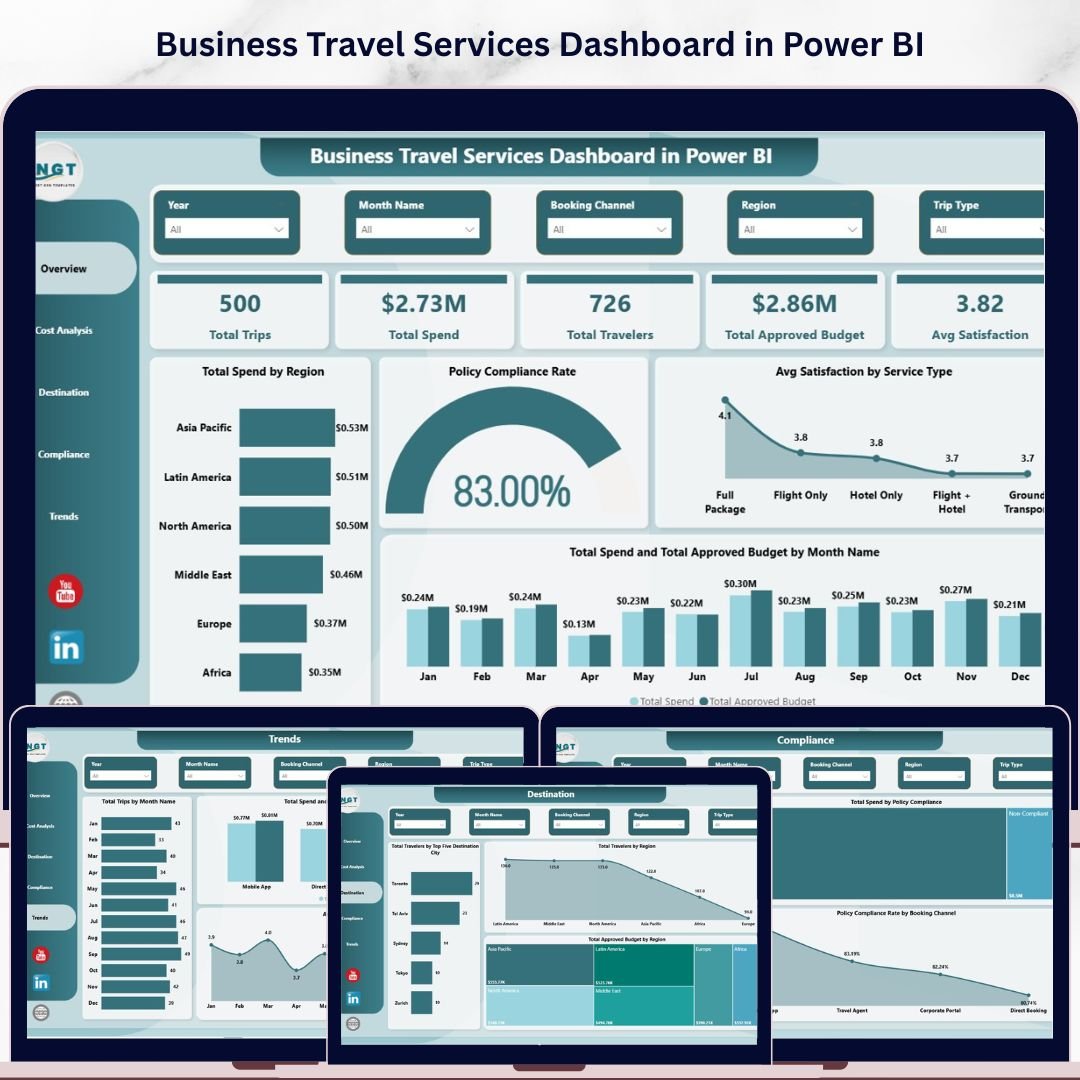

The Business Travel Services Dashboard in Power BI tracks 5 core KPIs across 5 fully interactive report pages, with 13 pre-built visualizations covering spend, compliance, destinations, cost breakdowns, and monthly trends. Corporate travel programs lose an average of 23% of their budget to policy non-compliance — this dashboard puts that data front and center so finance and operations teams can act before costs spiral.
🌍 Join 8,400+ teams in 40+ countries using Nextgen Templates to replace paid SaaS tools with one-time-purchase Excel, Google Sheets, Power BI, and HTML templates.
✅ Instant download · One-time payment · No subscription · No per-user fees · Lifetime access
🔑 Key Features of the Business Travel Services Dashboard in Power BI
This dashboard tracks 5 high-level KPIs — Total Trips, Total Spend, Total Travelers, Total Approved Budget, and Avg Satisfaction — giving finance managers and travel coordinators a complete view of their corporate travel program in a single glance. Every metric is driven by your imported data source and refreshes with one click.
🔹 13 pre-built visualizations — covering spend by region, policy compliance rate, satisfaction by service type, monthly spend vs budget, travel cost by airline and class, spend by trip type, destination city rankings, budget by region, approval rate by department, compliance by booking channel, and monthly trend lines for trips and satisfaction.
🔹 Multi-dimensional slicers on the Overview page — filter the entire dashboard instantly by any dimension without touching a formula. Ideal for ad-hoc analysis during management reviews.
🔹 Policy Compliance Rate tracking — visualize compliance across booking channels and departments in dedicated charts. This single feature can identify which teams are booking outside policy and quantify the financial impact before the next audit.
🔹 Five focused analysis pages — Overview, Cost Analysis, Destination, Compliance, and Trends. Each page answers a specific business question, making it easy to present to different stakeholders from finance to HR to operations leadership.
🔹 Power BI .pbix format — open in Power BI Desktop (free from Microsoft). Connect your own travel data source and every visual refreshes automatically. No additional license or subscription required.
📦 What’s Inside the Business Travel Services Dashboard in Power BI
The template ships as a single .pbix file with 5 report pages, each delivering focused analysis for corporate travel management:
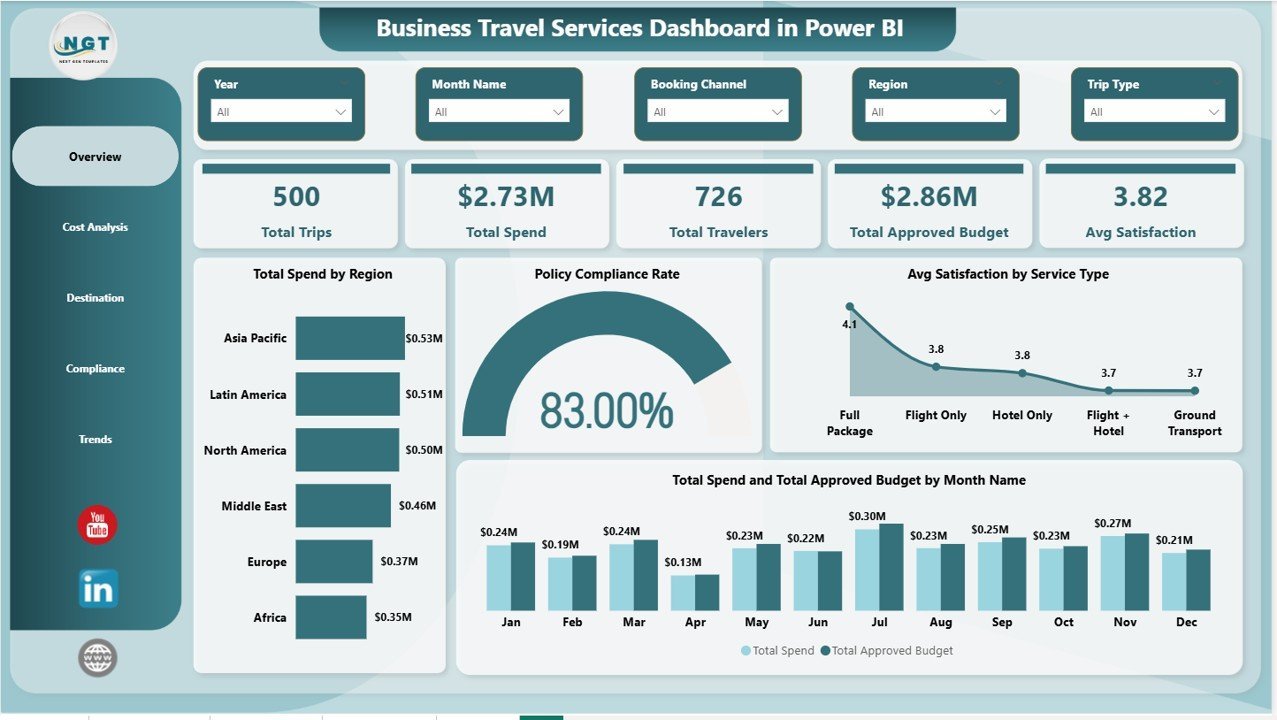
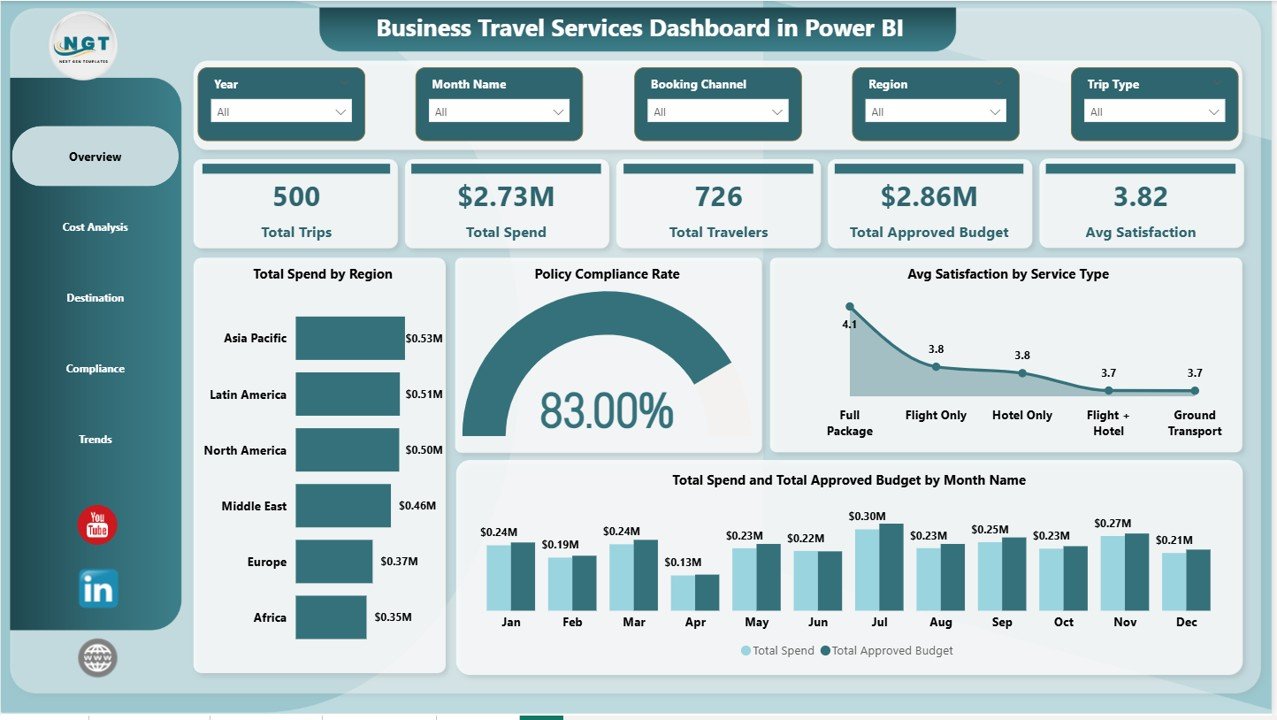
1 — Overview Page
Five KPI cards (Total Trips, Total Spend, Total Travelers, Total Approved Budget, Avg Satisfaction) sit at the top for immediate executive-level visibility. Below, four charts provide deeper context: Total Spend by Region shows which geographies are consuming the most budget; Policy Compliance Rate gives a single at-a-glance compliance gauge; Avg Satisfaction by Service Type reveals how different travel services (hotels, airlines, car hire) are rated by employees; and Total Spend and Total Approved Budget by Month Name surfaces over- or under-spend trends across the year. Multiple slicers let stakeholders filter the entire page instantly.
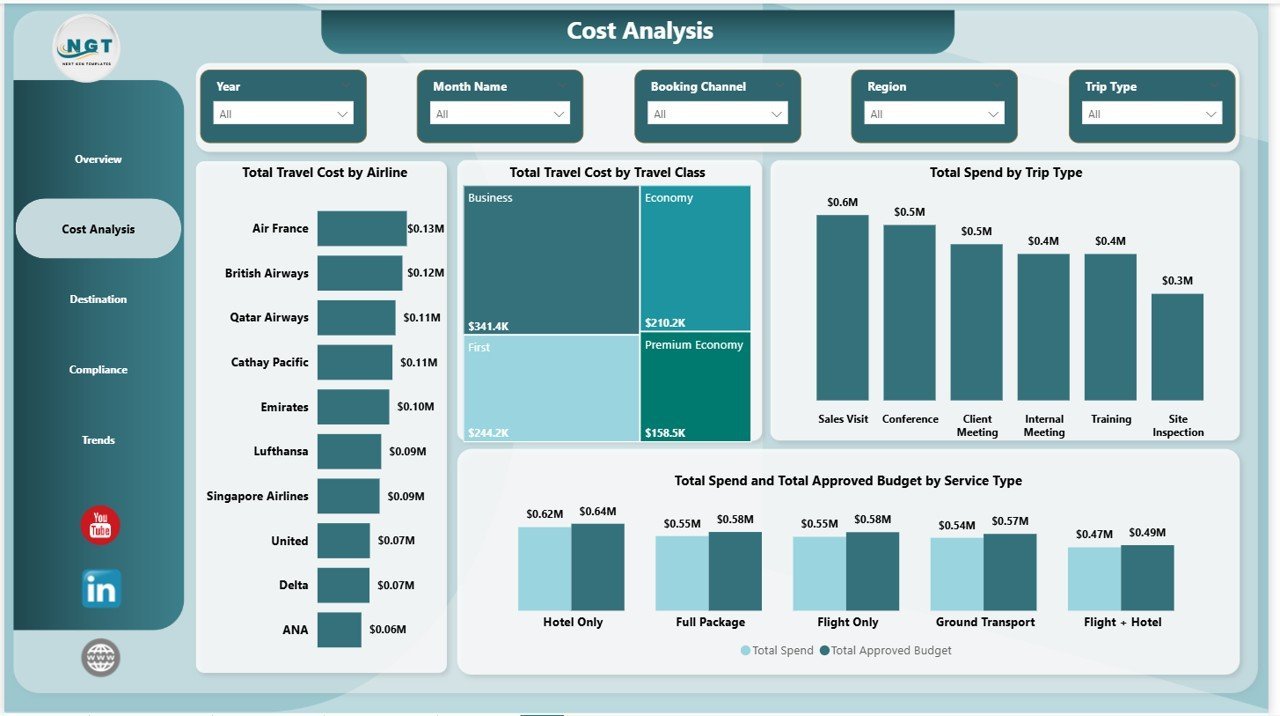
2 — Cost Analysis Page
Four targeted cost breakdowns drill into the financial detail: Total Travel Cost by Airline ranks carriers by spend to support supplier negotiations; Total Travel Cost by Travel Class shows the split between economy, business, and first class bookings; Total Spend by Trip Type compares domestic vs international or client vs internal travel; Total Spend and Total Approved Budget by Service Type highlights which categories (flights, hotels, ground transport) are running over budget.
 Business Travel Services Dashboard in Power BI — Cost Analysis Page
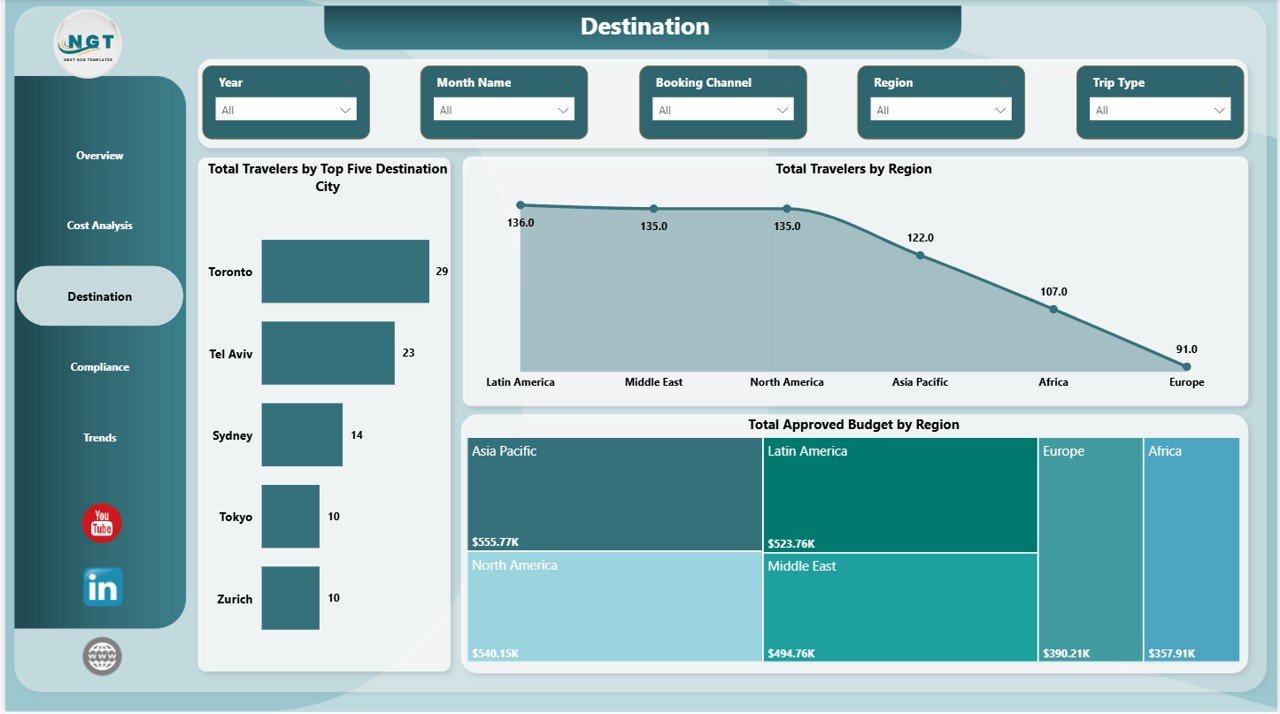
3 — Destination Page
Three destination-focused visuals provide geographic intelligence: Total Travelers by Top Five Destination City identifies the most-visited locations for focused vendor agreements; Total Travelers by Region shows the geographic distribution of travel activity; Total Approved Budget by Region maps budget allocation against actual travel patterns so finance teams can rebalance where needed.
 Business Travel Services Dashboard in Power BI — Destination Page
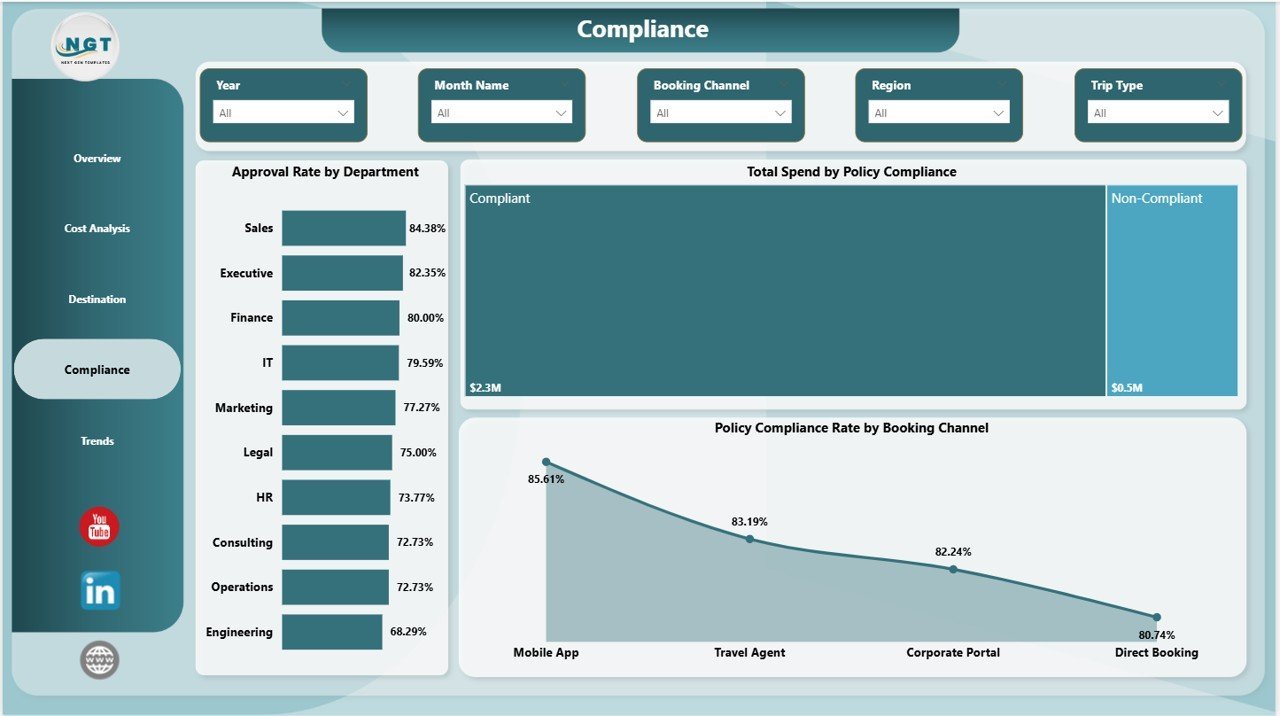
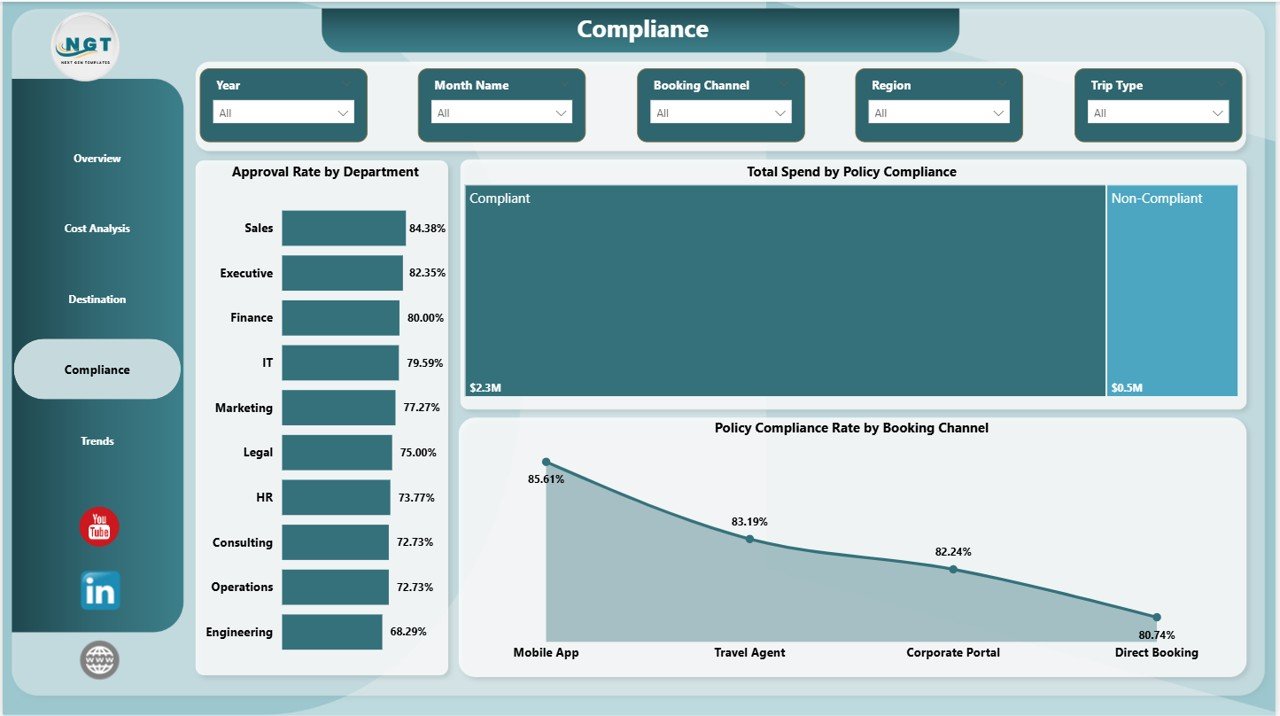
4 — Compliance Page
Three compliance-centric visuals make audit preparation straightforward: Approval Rate by Department shows which teams are getting their travel pre-approved vs booking ad hoc; Total Spend by Policy Compliance quantifies how much spend is in-policy vs out-of-policy in dollar terms; Policy Compliance Rate by Booking Channel reveals whether direct bookings, travel agencies, or self-service tools have the best compliance record.
 Business Travel Services Dashboard in Power BI — Compliance Page
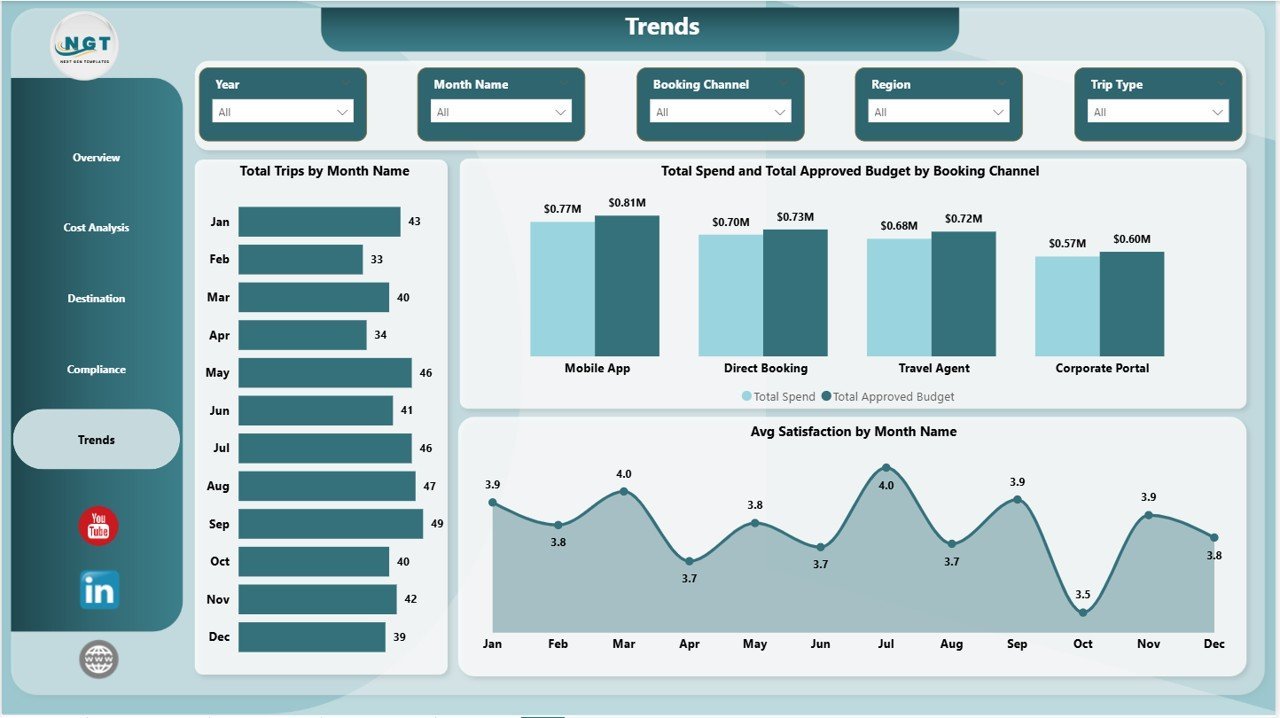
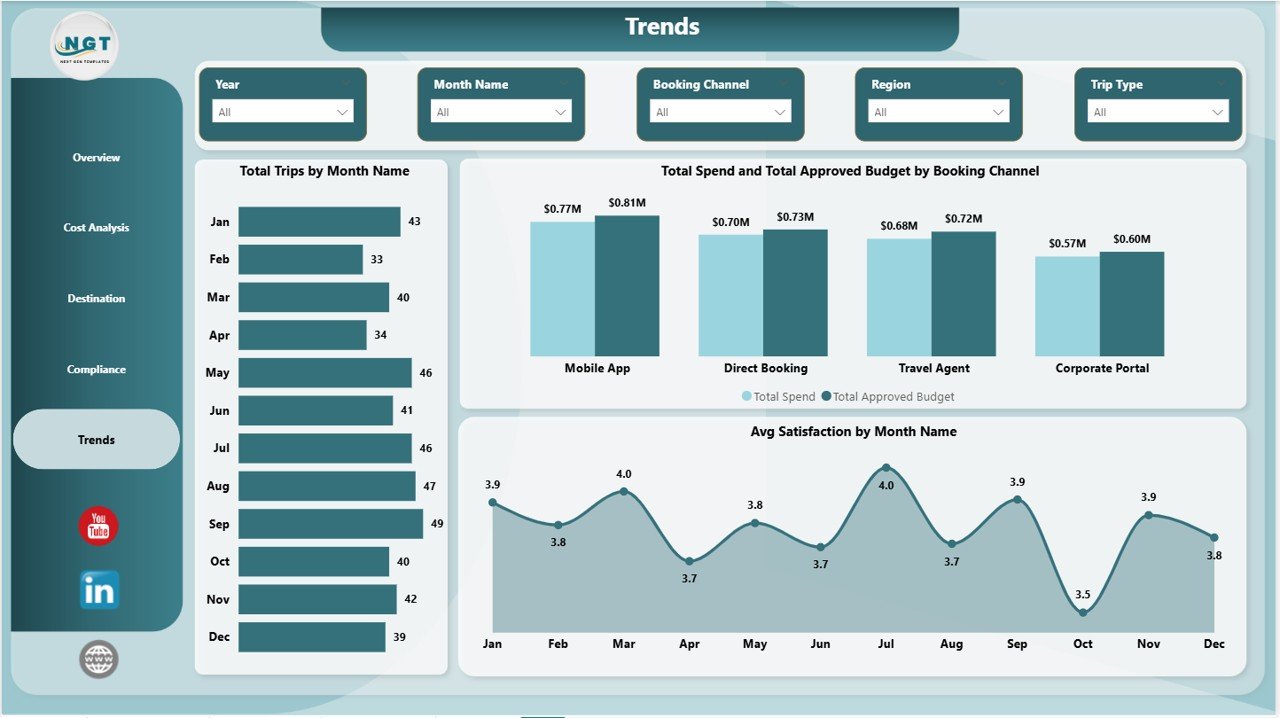
5 — Trends Page
Three trend visualizations support longitudinal analysis: Total Trips by Month Name tracks travel volume seasonality so HR and operations can plan ahead; Total Spend and Total Approved Budget by Booking Channel shows whether managed travel channels are staying within budget vs self-booked options; Avg Satisfaction by Month Name correlates employee travel experience with time of year, helping identify whether certain seasons generate service complaints.
 Business Travel Services Dashboard in Power BI — Trends Page
📊 Business Travel Services Dashboard in Power BI vs. Tableau Alternative vs. Concur/SAP — Where This Fits
| Feature | Business Travel Services Dashboard in Power BI | Tableau Desktop | SAP Concur Travel |
|---|---|---|---|
| Cost | $17.99 one-time | $70/user/month | $8–25/user/month + implementation |
| Platform | Power BI Desktop (free) | Tableau Desktop license required | Cloud SaaS only |
| Setup time | Under 30 minutes | Hours of custom build | Weeks of implementation |
| Policy compliance tracking | ✅ Built-in (3 dedicated charts) | Custom build required | ✅ Native |
| Satisfaction tracking | ✅ By service type and month | Custom build required | Limited |
| Destination analytics | ✅ Top 5 cities + region maps | Custom build required | Basic |
| Customizable fields | ✅ Fully editable .pbix | ✅ | Limited |
| Year-1 cost (5 users) | $17.99 total | $4,200+ | $480–1,500+ |
| No per-user fees | ✅ | ❌ | ❌ |
For finance and operations teams that need corporate travel visibility without a SaaS subscription, the Business Travel Services Dashboard in Power BI sits in the sweet spot.
👥 Who This Template Is For — and Who It’s Not For
✅ This template is built for:
- Finance managers and travel coordinators tracking corporate travel spend and budget compliance
- Operations teams at 20–500 person companies who need audit-ready travel reporting
- HR and admin teams responsible for employee travel satisfaction and policy enforcement
- Power BI users who want a professional travel dashboard without building from scratch
- Consultants and analysts building travel spend reports for clients
❌ This template is NOT for:
- Teams needing real-time automated expense ingestion directly from booking systems (requires custom connectors)
- Enterprise organizations requiring SOC 2 compliance, SSO, or role-based data access controls
- Users without access to Power BI Desktop (available free from Microsoft)
⚙️ How to Use the Business Travel Services Dashboard in Power BI
- Download and unzip — extract the .pbix file from the downloaded ZIP archive
- Open in Power BI Desktop — download Power BI Desktop free from Microsoft’s website if not already installed
- Connect your data source — replace the sample data with your actual travel records via the Transform Data panel
- Verify your field mapping — ensure columns like Region, Service Type, Booking Channel, Department, and Month match your source schema
- Refresh the report — click Refresh and all 5 pages update simultaneously with your live data
- Apply slicers — use Overview page slicers to filter by date, department, region, or trip type for focused analysis
- Export or share — publish to Power BI Service or export pages to PDF for stakeholder presentations
💼 Real-World Use Cases
Priya manages finance operations at a 120-person technology firm. Each quarter she pulls travel data from their booking system into the Business Travel Services Dashboard in Power BI. Within minutes she can see which departments are overspending, which booking channels have the lowest compliance rate, and whether satisfaction has dipped for a specific service type — and she presents it all to the CFO without building a single custom report.
Marcus is a travel policy manager at a professional services firm. He uses the Compliance page to identify that one regional office consistently books flights outside the approved airline list. With the Policy Compliance Rate by Booking Channel chart, he can demonstrate to HR leadership exactly where the policy gaps are and make a data-backed case for a mandatory approval workflow.
Tanuja handles operations and vendor management for a consulting group. She uses the Destination page to negotiate preferred hotel rates in the top 5 destination cities, and the Cost Analysis page to show the CFO that shifting 20% of business-class bookings to economy could save $40K annually — with the charts to back it up.
❓ Frequently Asked Questions
What KPIs does the Business Travel Services Dashboard in Power BI track?
The Business Travel Services Dashboard in Power BI tracks 5 top-level KPIs: Total Trips, Total Spend, Total Travelers, Total Approved Budget, and Avg Satisfaction. These update automatically when you connect your own travel data source and refresh the report in Power BI Desktop.
Do I need a paid Power BI license to use this template?
No. The Business Travel Services Dashboard in Power BI opens in Power BI Desktop, which is completely free to download from Microsoft. A paid Power BI Pro license is only needed if you want to publish the report to the Power BI Service and share it with colleagues via a web link.
How does this compare to SAP Concur for travel reporting?
SAP Concur charges $8–25 per user per month plus implementation fees, totalling thousands annually for a mid-size team. The Business Travel Services Dashboard in Power BI is a $17.99 one-time purchase with the same core travel analytics — spend, compliance, destinations, and trends — built and ready to use in under 30 minutes.
Can I customize the dashboard for my own data fields?
Yes. The .pbix file is fully editable. You can rename fields, add or remove visuals, adjust color themes, and connect different data sources through the Power Query editor. All standard Power BI customization options are available without any restrictions.
How long does setup take?
Most users are up and running in under 30 minutes. The main steps are downloading Power BI Desktop (if needed), connecting your travel data file or database, mapping your column names to the template fields, and clicking Refresh. No DAX coding or custom setup is required for the standard configuration.
Is the Excel version of this dashboard also available?
Yes — the Business Travel Services Dashboard in Excel is available for teams that prefer pivot-table-driven dashboards without Power BI. Both versions cover the same 5 analysis pages and KPIs.
What file format is included in the download?
The download includes a ZIP file containing one .pbix Power BI report file with all 5 pages pre-built and connected to sample travel data. Simply replace the sample data with your own records and refresh to see your live dashboard.
👤 About the Author
Built by PK — Microsoft Certified Professional with 15+ years of Excel, Google Sheets, and Power BI experience. Founder of Nextgen Templates, reaching 300K+ subscribers across YouTube channels (@PK-AnExcelExpert, @NextGenTemplates, @NeoTechNavigators). Every template is hand-built and tested before release.
🔗 Explore Related Templates
Also available as: Business Travel Services Dashboard in Excel — same 5-page analysis in a pivot-table format for Excel users.
You may also like these Power BI Dashboard Templates:
- Business Angel Networks Dashboard in Power BI
- Bridge Construction Dashboard in Power BI
- Security Company Dashboard in Power BI
📖 Click here to read the Detailed Blog Post
🎥 Visit our YouTube channel for step-by-step video tutorials
👉 YouTube.com/@NextGenTemplates
📅 Last updated: May 2026
Watch the step-by-step video tutorial:
YouTube


Reviews
There are no reviews yet.