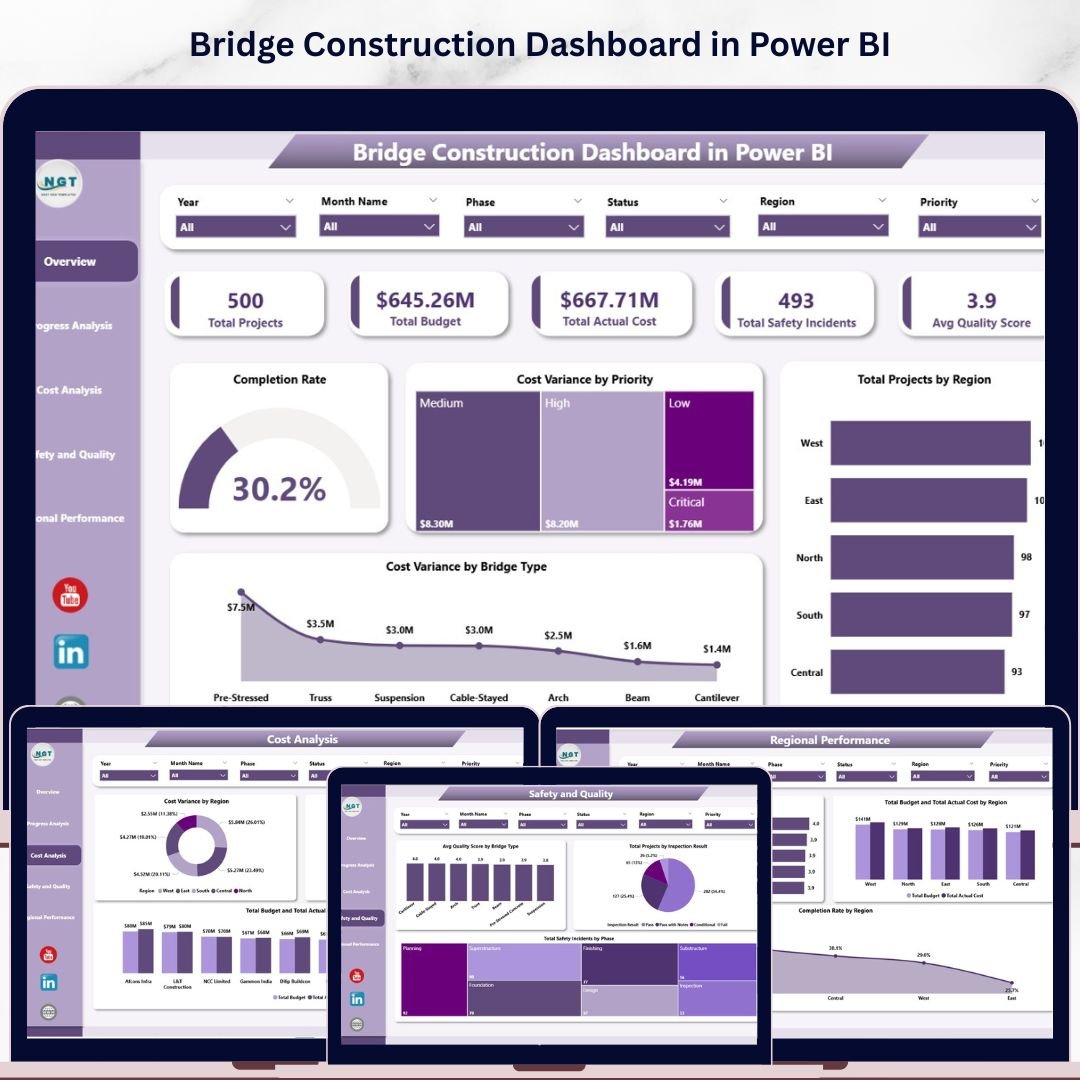


The Bridge Construction Dashboard in Power BI monitors 5 headline KPIs across 5 interactive report pages — tracking Total Projects, Total Budget, Total Actual Cost, Total Safety Incidents, and Avg Quality Score — with 17 pre-built visuals covering cost variance, completion rates, regional benchmarking, and safety trend analysis. Setup takes under 10 minutes: open the .pixy file in Power BI Desktop, connect your data source, and every chart and KPI card updates automatically.
🌍 Join 8,400+ teams in 40+ countries using NextGenTemplates to replace paid SaaS tools with one-time-purchase Excel, Google Sheets, Power BI, and HTML templates.
✅ Instant download · One-time payment · No subscription · No per-user fees · Lifetime access
🔑 Key Features of the Bridge Construction Dashboard in Power BI
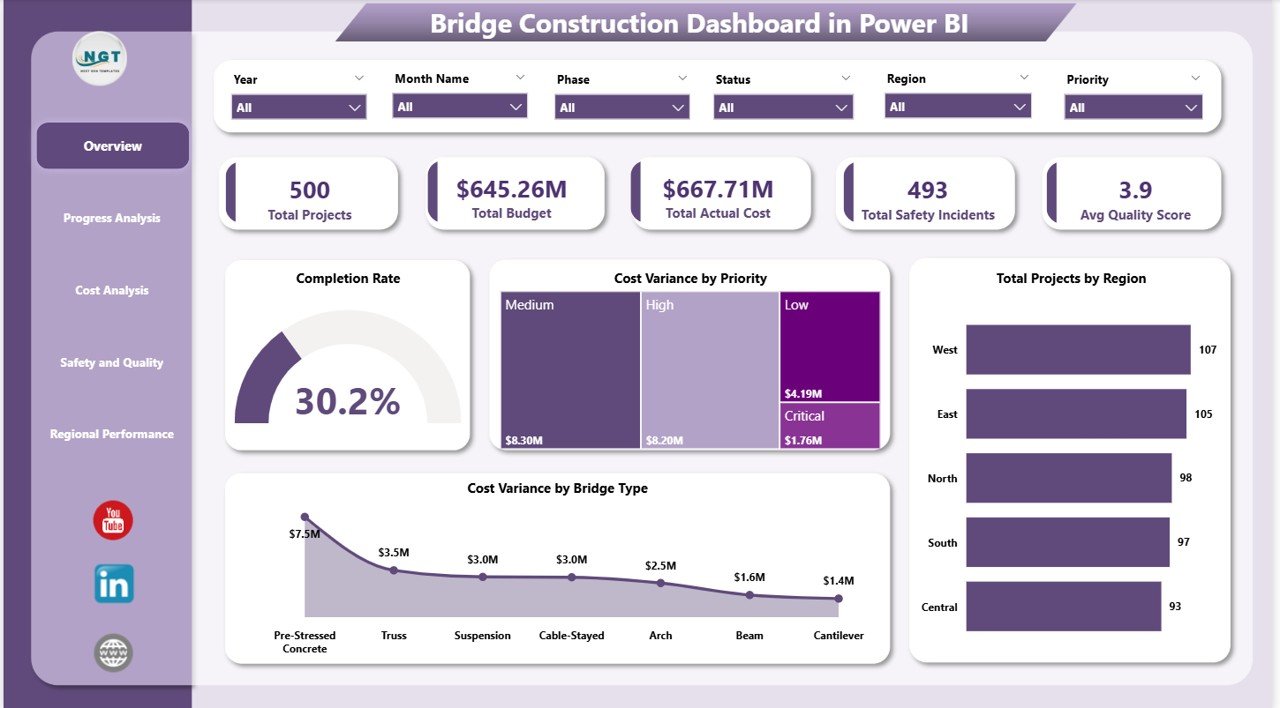
📊 5 KPI cards on the Overview page — Total Projects, Total Budget, Total Actual Cost, Total Safety Incidents, and Avg Quality Score deliver at-a-glance portfolio health for project managers and site directors. All cards connect directly to your data and refresh with a single click.
📈 17 pre-built charts and visuals — This dashboard tracks Completion Rate, Cost Variance by Priority, Total Projects by Region, Cost Variance by Bridge Type, Total Projects by Phase, Completion Rate by Month Name, Cost Variance by Region, Total Actual Cost by Project Type, Budget vs. Actual Cost by Contractor, Avg Quality Score by Bridge Type, Total Projects by Inspection Result, Total Safety Incidents by Phase, Avg Quality Score by Project Type, Budget vs. Actual Cost by Region, and Completion Rate by Region. Every chart is interactive and responds to slicer selections instantly.
🔍 Multi-dimensional slicer filtering — Apply filters across region, bridge type, priority level, construction phase, and project status to drill into exactly the slice of data you need. No manual recalculation required.
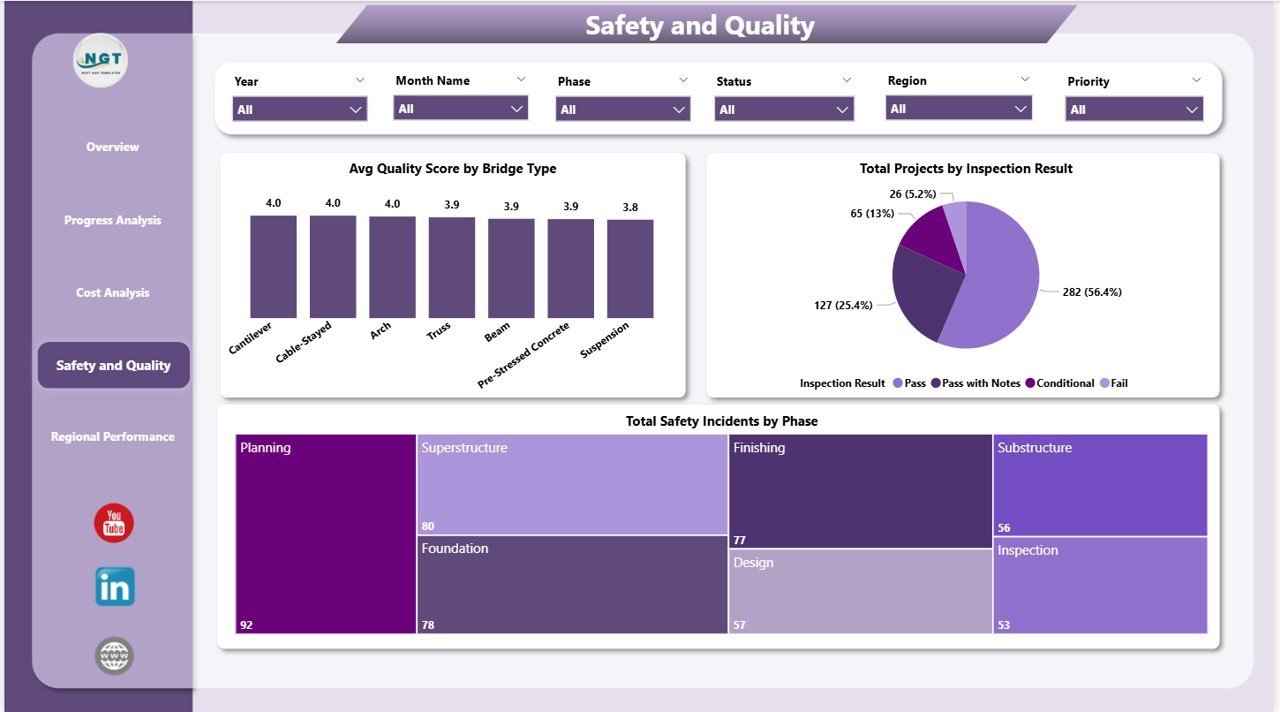
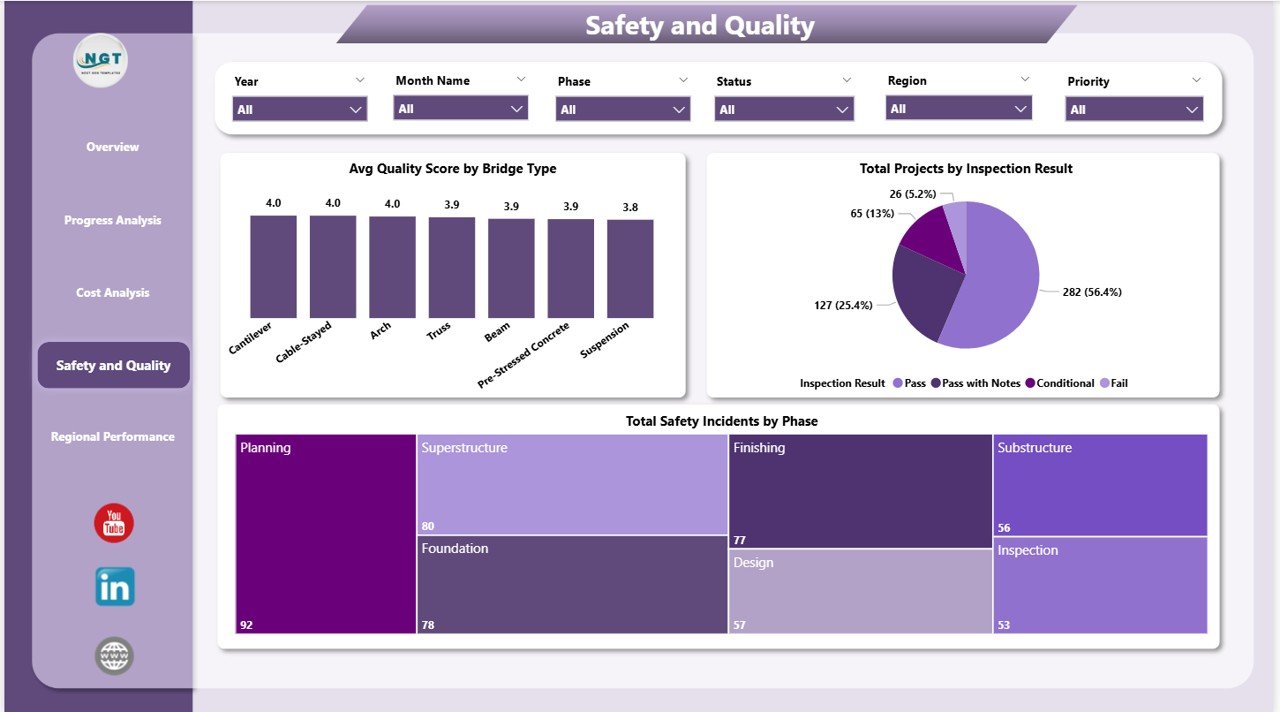
⚠️ Safety and quality monitoring built in — The Safety and Quality page tracks Total Safety Incidents by Phase and Avg Quality Score by Bridge Type, giving HSE managers a dedicated view of on-site risk and inspection outcomes across the entire portfolio.
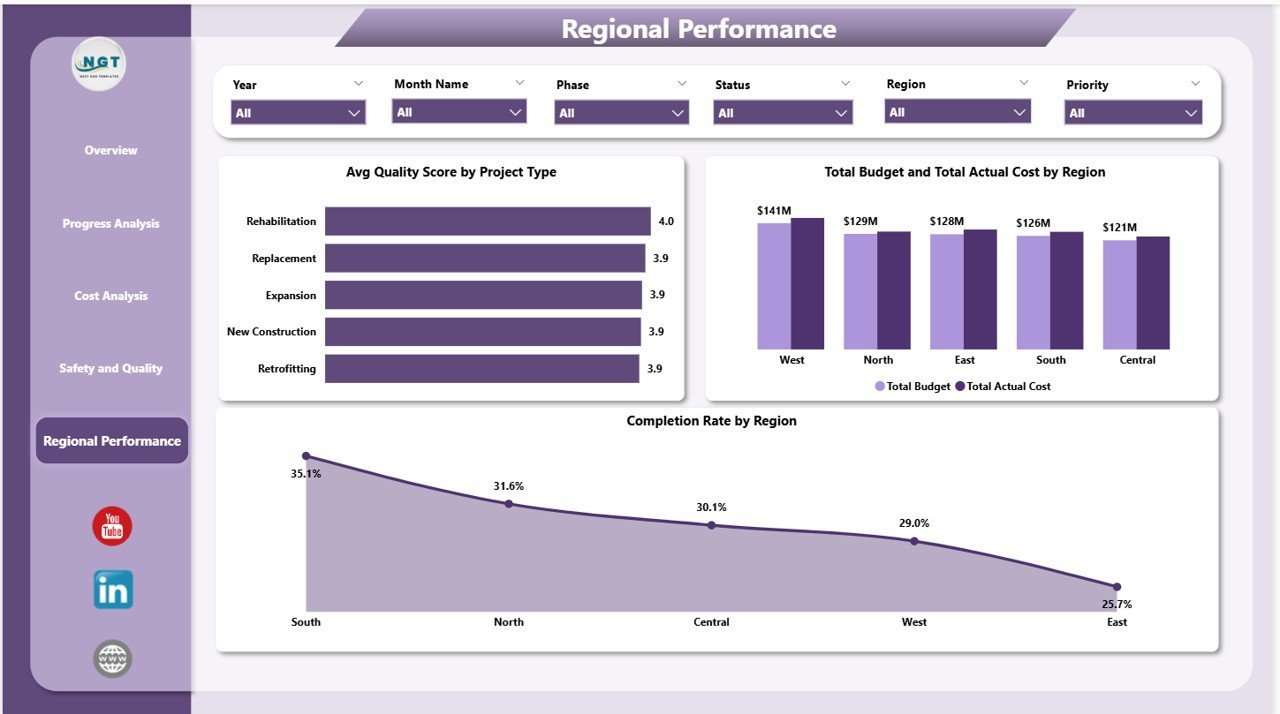
🗺️ Regional performance benchmarking — Compare Completion Rate, Budget vs. Actual Cost, and Avg Quality Score across all project regions simultaneously. Ideal for infrastructure program managers overseeing multi-region bridge portfolios.
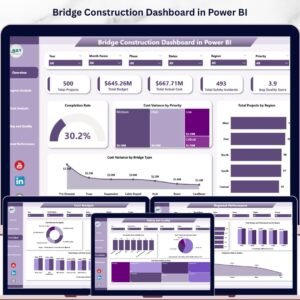
Bridge Construction Dashboard in Power BI – Overview Page
📦 What’s Inside the Bridge Construction Dashboard in Power BI
Page 1 — Overview: Top-level KPI cards (Total Projects, Total Budget, Total Actual Cost, Total Safety Incidents, Avg Quality Score) alongside charts for Completion Rate, Cost Variance by Priority, Total Projects by Region, and Cost Variance by Bridge Type. Slicers at the top let users filter the entire page instantly.
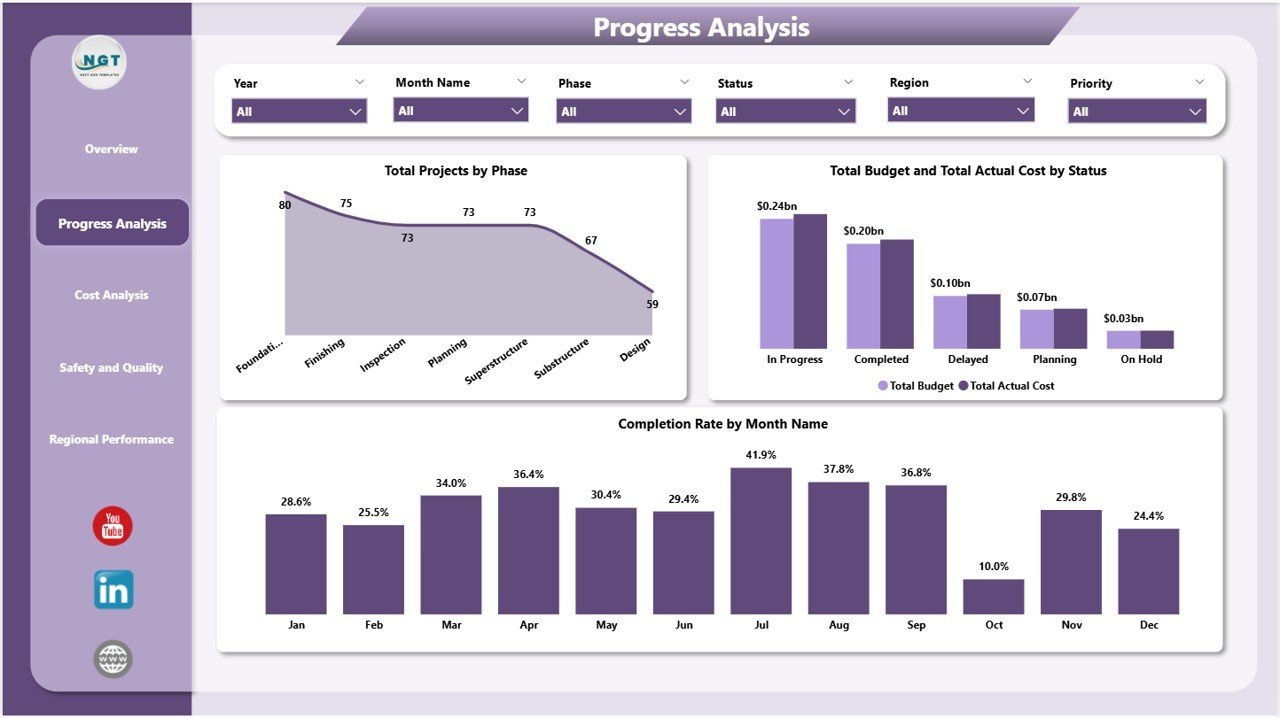
Bridge Construction Dashboard in Power BI – Progress Analysis Page
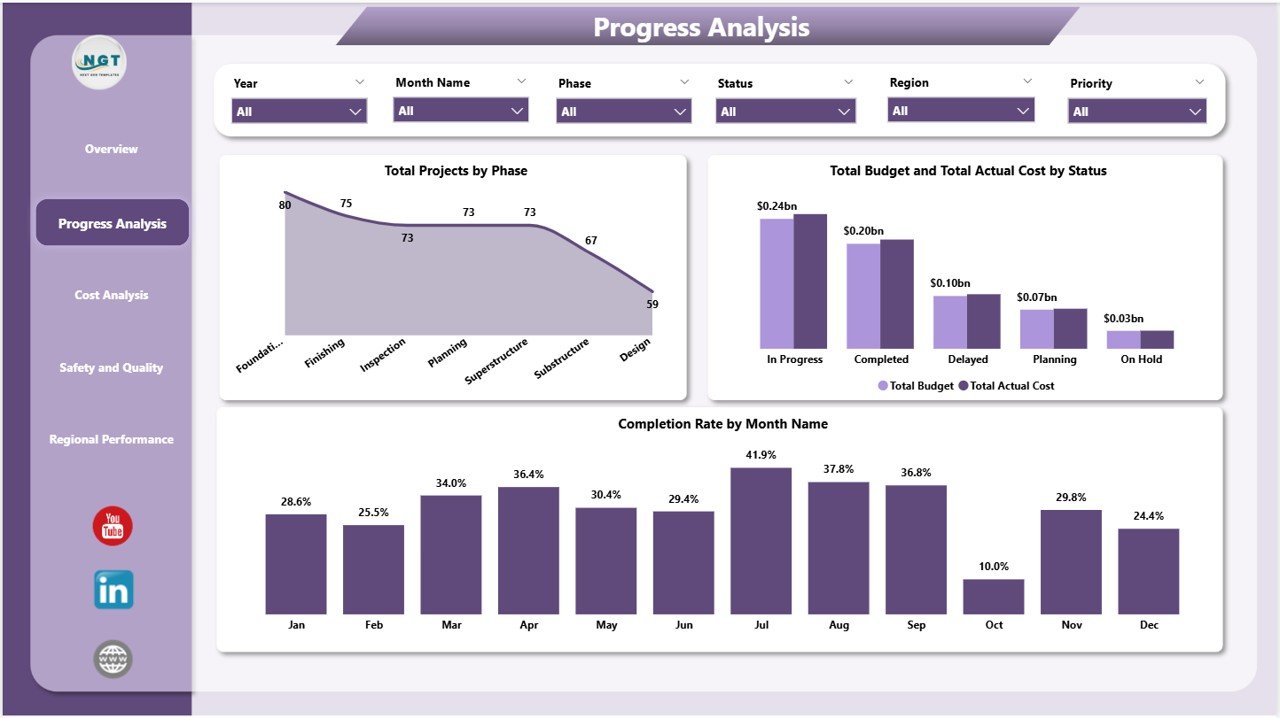
Page 2 — Progress Analysis: Charts showing Total Projects by Phase, Total Budget and Total Actual Cost by Status, and Completion Rate by Month Name — giving program managers a month-by-month timeline view of construction progress and phase distribution.
Bridge Construction Dashboard in Power BI – Cost Analysis Page
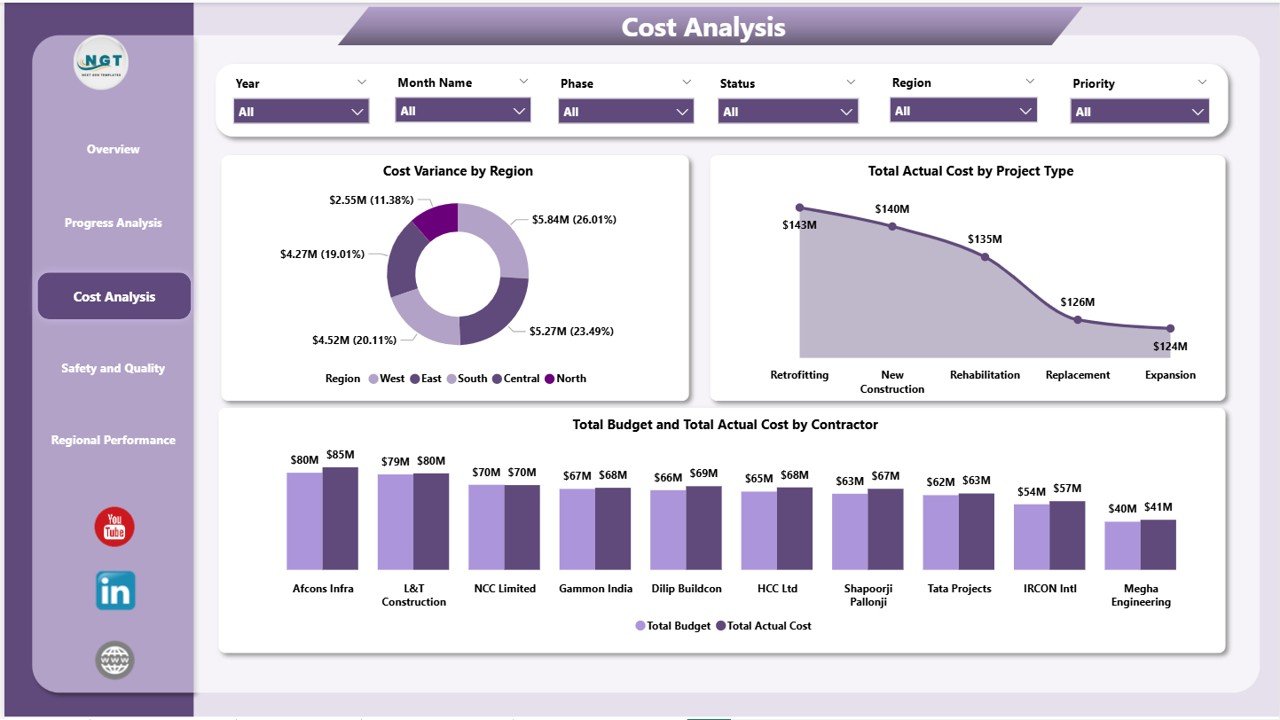
Page 3 — Cost Analysis: Cost Variance by Region, Total Actual Cost by Project Type, and Budget vs. Actual Cost by Contractor help finance teams identify which contractors and project types are running over budget and by how much.
Bridge Construction Dashboard in Power BI – Safety and Quality Page
Page 4 — Safety and Quality: Avg Quality Score by Bridge Type, Total Projects by Inspection Result, and Total Safety Incidents by Phase surface HSE trends and quality gaps across the construction portfolio in one focused view.

Bridge Construction Dashboard in Power BI – Regional Performance Page
Page 5 — Regional Performance: Avg Quality Score by Project Type, Budget vs. Actual Cost by Region, and Completion Rate by Region let executives benchmark every regional office against budget and schedule targets simultaneously.
Also available: Bridge Construction Dashboard in Excel for teams that prefer spreadsheet-based reporting.
📊 Bridge Construction Dashboard in Power BI vs. Tableau vs. Oracle Primavera — Where This Fits
| Feature | Bridge Construction Dashboard in Power BI | Tableau Desktop | Oracle Primavera P6 |
|---|---|---|---|
| Cost | $17.99 one-time | $70/user/month | $1,500+ per user/year |
| Platform | Power BI Desktop (free app) | Tableau Desktop / Browser | Windows enterprise software |
| Setup time | Under 10 minutes | 2-5 hours (data modeling) | Days to weeks |
| Bridge-specific KPIs | ✅ Pre-built (5 cards, 17 visuals) | ❌ Build from scratch | ⚠️ Project mgmt focus only |
| Safety & quality tracking | ✅ Dedicated page | ❌ Custom build required | ⚠️ Add-on module |
| Regional benchmarking | ✅ Built in | ❌ Manual setup | ⚠️ Limited |
| No per-user fees | ✅ | ❌ Per-seat licensing | ❌ Per-seat licensing |
| Year-1 cost at 5 users | $17.99 total | $4,200 | $7,500+ |
For construction teams that need bridge-specific reporting without enterprise software costs, the Bridge Construction Dashboard in Power BI sits in the sweet spot.
👥 Who This Template Is For — and Who It’s Not For
✅ This template is built for:
- Infrastructure project managers overseeing 5-50 active bridge construction projects
- Public works departments and government agencies tracking multi-region bridge portfolios
- HSE managers who need a dedicated safety and quality monitoring view
- Finance teams comparing contractor costs and identifying budget overruns by project type
- Power BI users who want a ready-made .pbix file without building from scratch
❌ This template is NOT for:
- Enterprise teams requiring SAP or Oracle ERP integration with real-time data feeds
- Organizations needing Gantt charts or CPM scheduling (see Construction Project Timeline in Google Sheets)
- Teams without Power BI Desktop installed (it is free from Microsoft)
⚙️ How to Use the Bridge Construction Dashboard in Power BI
- Download and unzip the .pbix file from your order confirmation email.
- Open in Power BI Desktop (free download from Microsoft — works on Windows).
- Replace the sample data with your project data by connecting to your Excel file, SQL database, or SharePoint list via the Transform Data menu.
- Use the slicers on each page to filter by region, bridge type, priority, and project phase.
- Publish to Power BI Service (optional) to share reports with your team on any device.
💼 Real-World Use Cases
Marco manages a state DOT portfolio of 22 bridge rehabilitation projects across three regions. He loads the Regional Performance page every Monday morning to see which regions are behind schedule and which contractors are running over budget — in under two minutes, without waiting for a weekly report.
Priya is a project controls analyst at an infrastructure consultancy. She uses the Cost Analysis page to track budget vs. actual spend by contractor on a monthly basis, flagging variances greater than 10% to project sponsors before they escalate.
James is an HSE officer on a 12-bridge highway expansion program. The Safety and Quality page gives him a live snapshot of incidents by phase and quality scores by bridge type — replacing a manual spreadsheet that used to take four hours to update each week.
❓ Frequently Asked Questions
What KPIs does the Bridge Construction Dashboard in Power BI track?
The Bridge Construction Dashboard in Power BI tracks 5 headline KPIs — Total Projects, Total Budget, Total Actual Cost, Total Safety Incidents, and Avg Quality Score — plus 17 additional metrics across cost variance, completion rate, regional performance, and safety analysis pages.
Do I need a Power BI Pro license to use this dashboard?
No. The dashboard works with Power BI Desktop, which is free from Microsoft. A Pro or Premium license is only needed if you want to publish and share the report via Power BI Service with other users.
How long does setup take?
Under 10 minutes. Open the .pbix file in Power BI Desktop, replace the sample data with your own by connecting to your data source, and all 17 visuals and 5 KPI cards update automatically. No formulas or DAX coding required.
How does this compare to building a custom dashboard in Tableau?
Tableau Desktop costs $70/user/month and requires 2-5 hours to build a bridge-specific layout from scratch. The Bridge Construction Dashboard in Power BI delivers a ready-made solution for a one-time $17.99 with no recurring fees.
Can I customize the charts and add my own KPIs?
Yes. The .pbix file is fully editable in Power BI Desktop — you can add new visuals, modify existing charts, update color themes, and add custom DAX measures for any additional KPIs your organization requires.
Is there an Excel version of this dashboard?
Yes — the Bridge Construction Dashboard in Excel is available for spreadsheet-first teams.
👤 About the Author
Built by PK — Microsoft Certified Professional with 15+ years of Excel, Google Sheets, and Power BI experience. Founder of Nextgen Templates, reaching 300K+ subscribers across YouTube channels (@PK-AnExcelExpert, @NextGenTemplates, @NeoTechNavigators). Every template is hand-built and tested before release.
🔗 Explore Related Templates
🔹 Bridge Construction Dashboard in Excel — The same bridge project analytics in Microsoft Excel for spreadsheet-first teams.
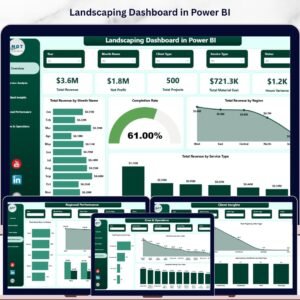
🔹 Landscaping Dashboard in Power BI — Field operations tracking for landscaping and outdoor service businesses.
🔹 Resource Allocation KPI Dashboard in Power BI — Track resource utilization and workload distribution across project teams.
🔹 Browse all Power BI Dashboard Templates →
📖 Click here to read the Detailed Blog Post
🎥 Visit our YouTube channel for step-by-step video tutorials
👉 YouTube.com/@NextGenTemplates
Watch the step-by-step video tutorial:
YouTube


Reviews
There are no reviews yet.