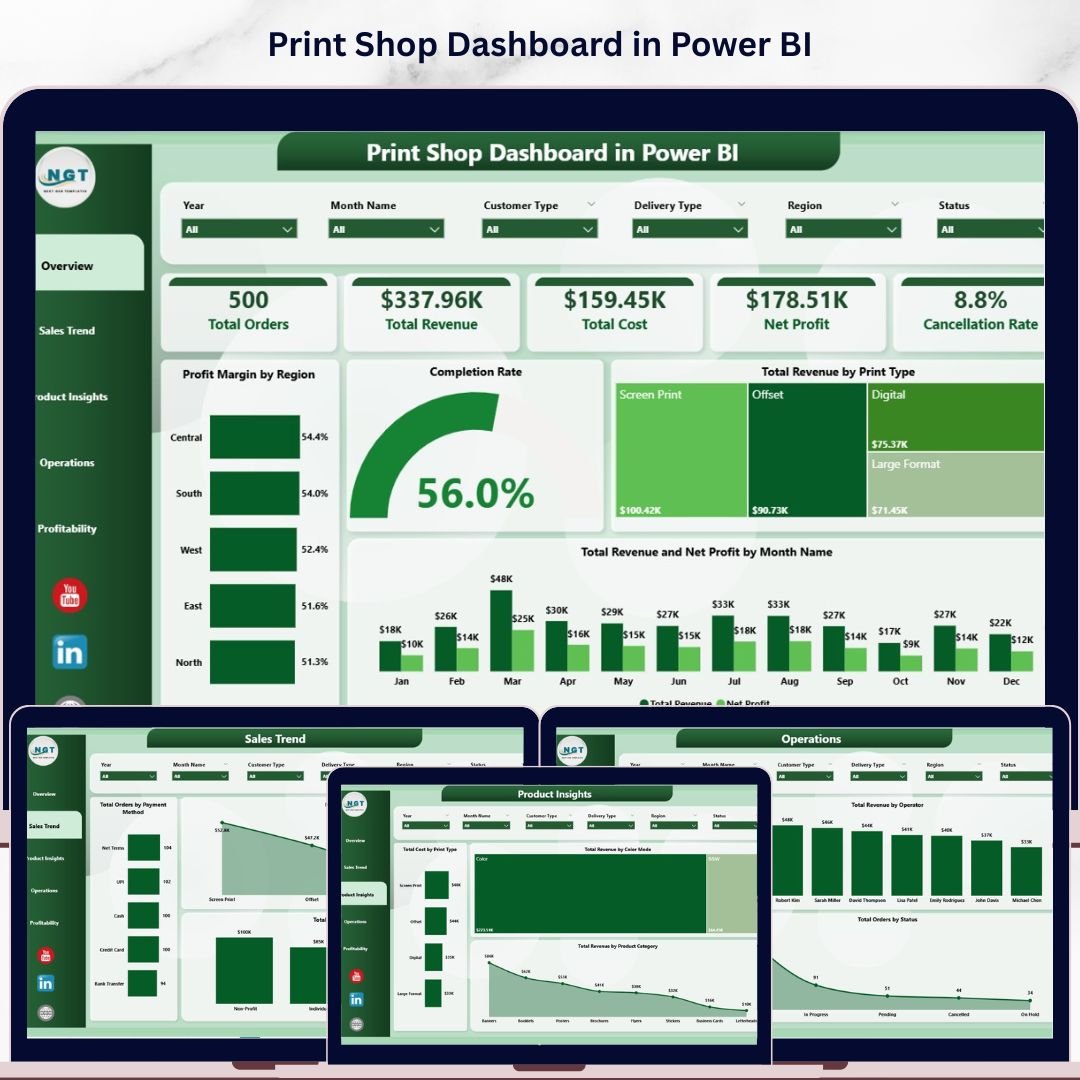


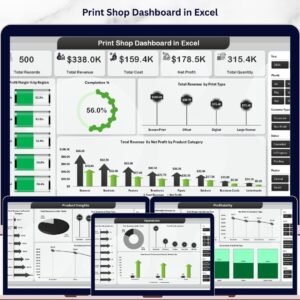
The Print Shop Dashboard in Power BI tracks 5 core business KPIs across 5 interactive analysis pages with 15+ pre-built visuals covering sales trends, product insights, operations, and profitability. Setup takes under 10 minutes — connect your data source and every chart, slicer, and KPI card refreshes automatically through Power BI’s DAX calculation engine.
🌍 Join 8,400+ teams in 40+ countries using NextGenTemplates to replace paid SaaS analytics tools with one-time-purchase Excel, Google Sheets, Power BI, and HTML templates.
✅ Instant download · One-time payment · No subscription · No per-user fees · Lifetime access
🔑 Key Features of the Print Shop Dashboard in Power BI
📊 5-Page Interactive Analytics Suite – The dashboard spans Overview, Sales Trend, Product Insights, Operations, and Profitability. Each page connects through shared slicers so a single click on region, print type, or customer type instantly refreshes every visual on the active page.
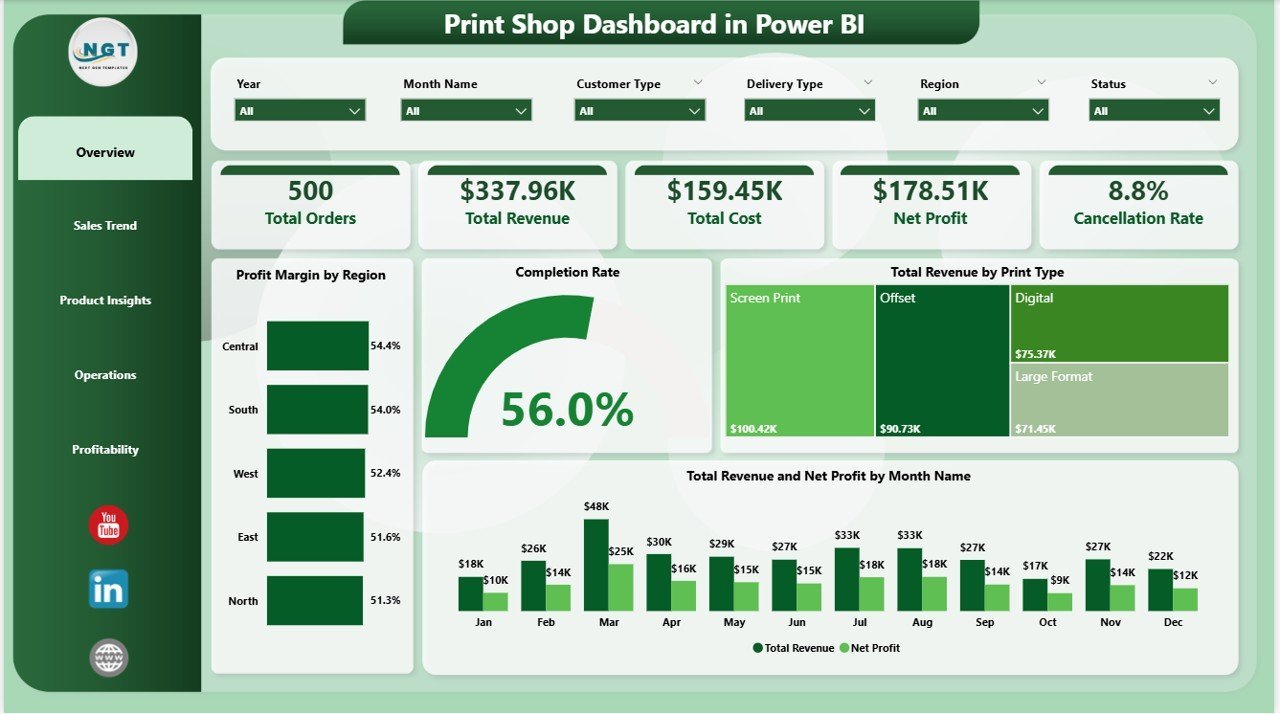
💰 5 Executive KPI Cards on the Overview Page – Surfaces Total Orders, Total Revenue, Total Cost, Net Profit, and Cancellation Rate — the five numbers every print shop manager reviews first, powered by DAX measures that recalculate dynamically as filters change.
📈 15+ Pre-Built Power BI Visuals – Charts include Profit Margin by Region, Completion Rate, Total Revenue by Print Type, Total Revenue and Net Profit by Month, Total Orders by Payment Method, Net Profit by Print Type, Total Revenue by Customer Type, Total Cost by Print Type, Total Revenue by Color Mode, Total Revenue by Product Category, Total Orders by Operator, Total Revenue by Operator, Total Orders by Status, Total Revenue and Net Profit by Region, Profit Margin by Delivery Type, and Net Profit by Customer Type.
🎛️ Multi-Dimensional Slicer Filtering – Apply filters by date, region, print type, customer type, payment method, delivery type, operator, and color mode. Slicers operate per page for focused segment-level analysis.
🏷️ Print Industry Coverage – Built for print shops handling business cards, banners, brochures, large-format printing, and custom orders. Tracks operations, profitability, and sales across product lines, operators, and geographic regions.
📦 What’s Inside the Print Shop Dashboard in Power BI
🔵 Overview Page — High-level command center with 5 KPI cards: Total Orders, Total Revenue, Total Cost, Net Profit, and Cancellation Rate. Charts include Profit Margin by Region (identifies highest- and lowest-margin geographies), Completion Rate (tracks order fulfillment efficiency), Total Revenue by Print Type (reveals which print categories drive the most revenue), and Total Revenue and Net Profit by Month (exposes seasonal sales patterns and margin trends over time).

Print Shop Dashboard in Power BI – Overview Page
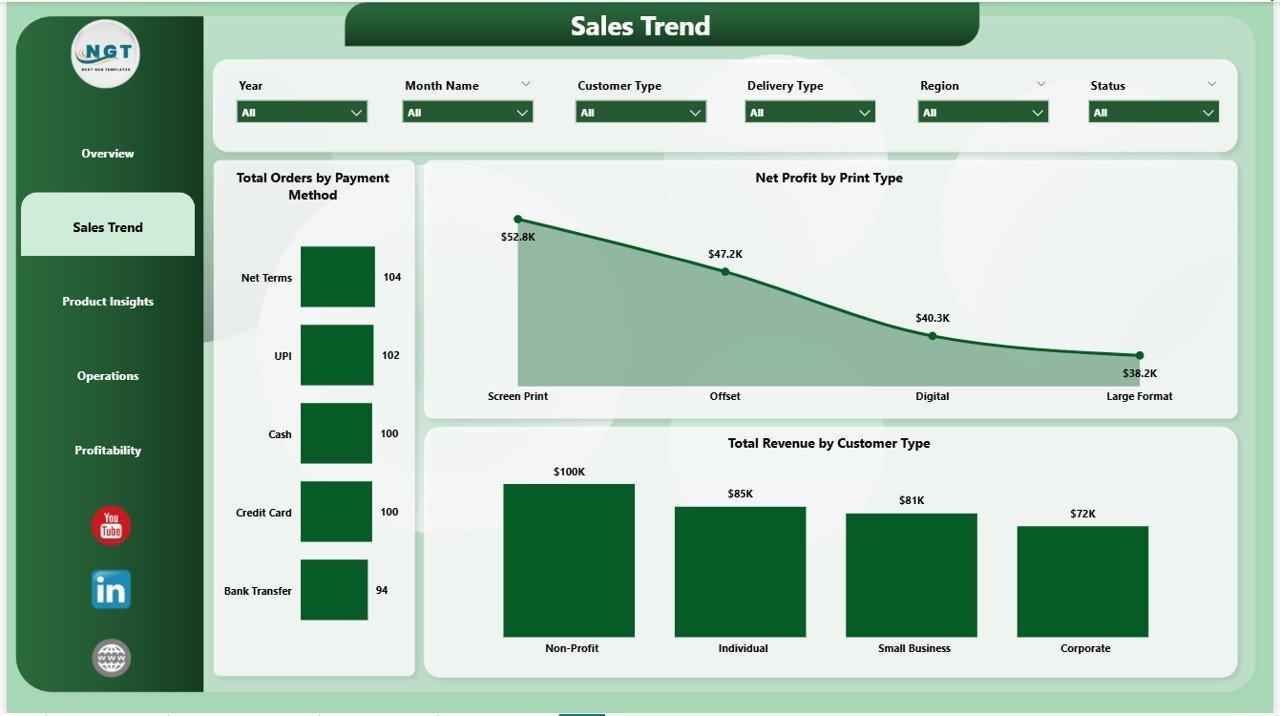
🔵 Sales Trend Page — Revenue and order pattern analysis by customer and payment dimensions. Total Orders by Payment Method surfaces preferred payment channels across your customer base. Net Profit by Print Type identifies which service lines generate the strongest margins. Total Revenue by Customer Type segments income between retail, corporate, and wholesale clients.

Print Shop Dashboard in Power BI – Sales Trend
🔵 Product Insights Page — Product-level performance breakdown. Total Cost by Print Type highlights cost-heavy service lines eroding margins. Total Revenue by Color Mode compares color versus black-and-white printing revenue. Total Revenue by Product Category identifies which print families — banners, brochures, cards — generate the most income.
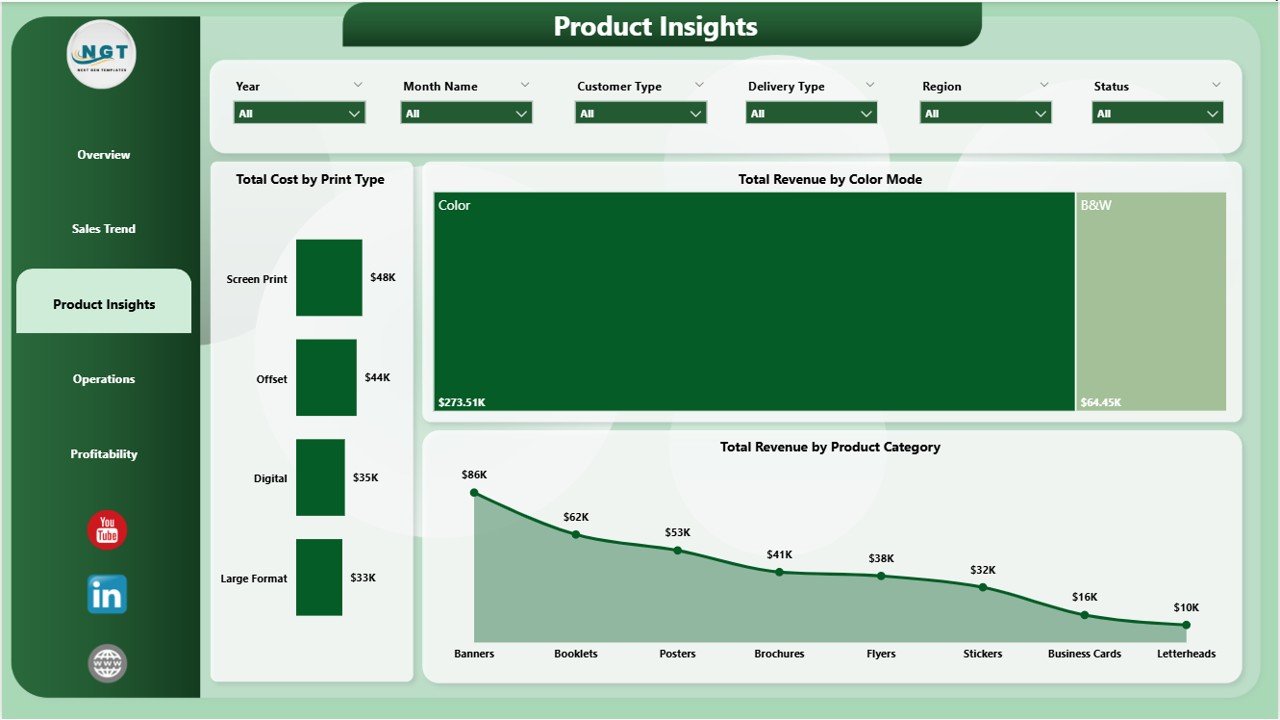
Print Shop Dashboard in Power BI – Product Insights
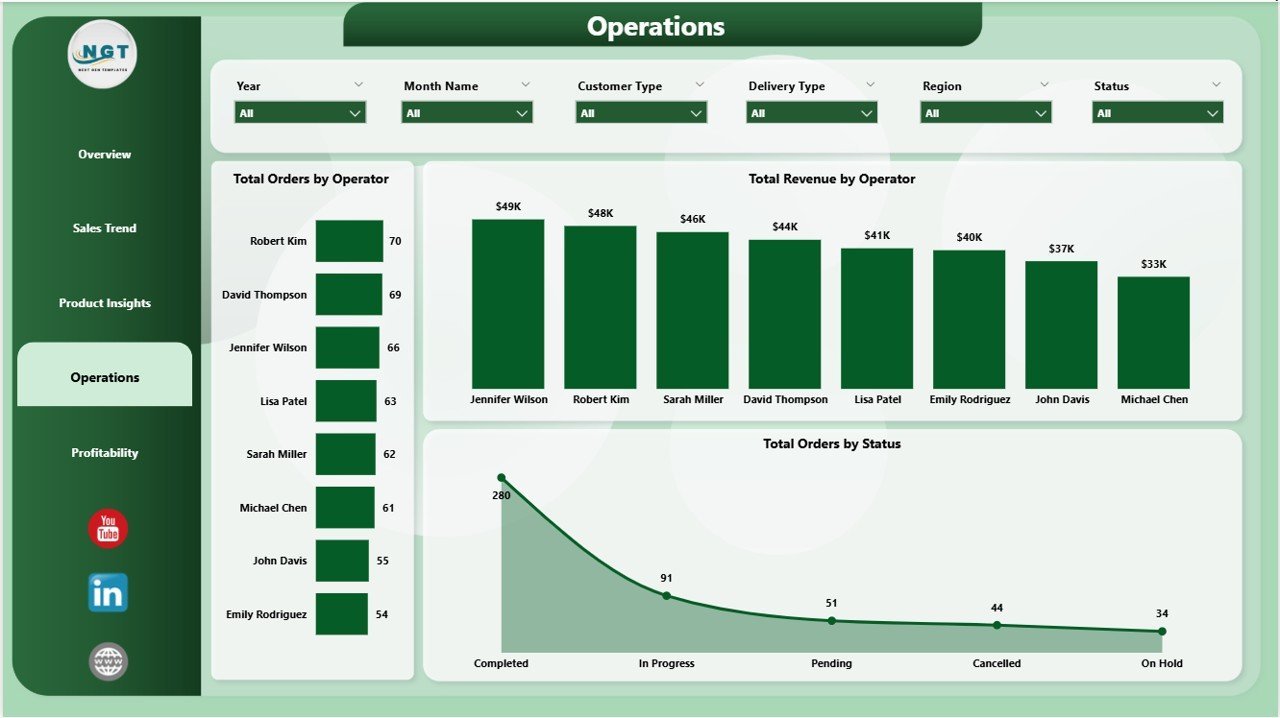
🔵 Operations Page — Operator-level and order status tracking. Total Orders by Operator measures workload distribution across your production team. Total Revenue by Operator identifies top revenue-generating staff. Total Orders by Status tracks pending, completed, and cancelled order ratios — a direct indicator of operational efficiency.

Print Shop Dashboard in Power BI – Operations Page
🔵 Profitability Page — Deep-dive into margins and net returns. Total Revenue and Net Profit by Region compares geographic profitability side by side. Profit Margin by Delivery Type benchmarks standard, express, and pickup delivery channels. Net Profit by Customer Type reveals which customer segments contribute the most bottom-line value.
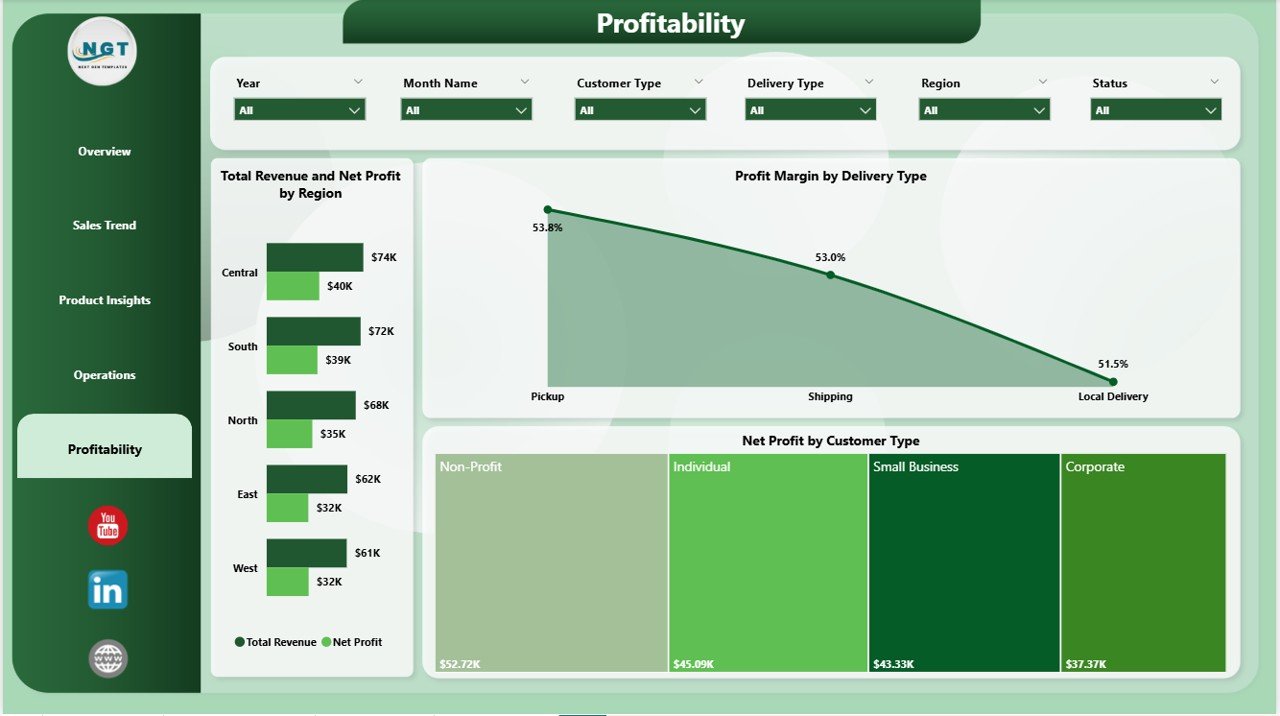
Print Shop Dashboard in Power BI – Profitability Page
📊 Print Shop Dashboard in Power BI vs. Tableau vs. Paid Print MIS — Where This Fits
| Feature | Print Shop Dashboard in Power BI | Tableau / Qlik Alternative | Paid Print MIS (PrintSmith / Printavo) |
|---|---|---|---|
| Cost | $17.99 one-time | $70–$900/user/month | $100–$500/user/month |
| Platform | Power BI Desktop (free) | Separate license required | SaaS subscription |
| Setup Time | Under 10 minutes | Hours to days | Days to weeks |
| Real-time Collaboration | Power BI Service (free tier) | ✅ (paid) | ✅ (paid) |
| Customizable Visuals | ✅ Full DAX customization | Partial | Limited by vendor |
| Print-Specific KPIs | ✅ 5 KPIs + 15+ charts | Build from scratch | ✅ (bundled with workflow) |
| One-Time Purchase | ✅ Yes | ❌ Subscription | ❌ Subscription |
| Year-1 Cost (5 users) | $17.99 total | $4,200–$54,000 | $6,000–$30,000 |
For print shop owners who want professional Power BI analytics without committing to a five-figure MIS subscription, the Print Shop Dashboard in Power BI sits in the sweet spot.
👥 Who This Template Is For — and Who It’s Not For
✅ This template is built for:
- Print shop owners and managers tracking revenue, costs, and profitability across print categories
- Operations managers who need operator-level workload and revenue visibility
- Sales analysts monitoring order trends by payment method, customer type, and delivery channel
- Print businesses transitioning from spreadsheets to structured Power BI analytics
❌ This template is NOT for:
- Businesses needing full order management and job ticketing workflow automation (use dedicated print MIS software)
- Teams requiring live data streaming or real-time IoT machine connectivity
- Organizations outside the Microsoft ecosystem who do not use Power BI Desktop
⚙️ How to Use the Print Shop Dashboard in Power BI
- Download the .pbix file and open it in Power BI Desktop (free from Microsoft)
- Navigate to the Data view and replace sample records with your actual print shop data
- Use the built-in slicers on each page to filter by date, region, print type, or customer type
- Review the Overview page KPIs, then drill into Sales Trend, Product Insights, Operations, and Profitability pages
- Publish to Power BI Service to share with your team or export pages as PDF reports
💼 Real-World Use Cases
Alex manages a mid-sized print shop with 8 operators. He uses the Print Shop Dashboard in Power BI to track which operators handle the most orders, which print types generate the highest margins, and which customer segments drive the most revenue — all in one .pbix file, without a single spreadsheet formula.
Maria runs a commercial printing company serving retail and corporate clients. She uses the Profitability page to compare delivery type margins and the Sales Trend page to spot seasonal revenue dips — helping her team adjust pricing and promotions before the drop hits.
James is a print shop consultant onboarding a new client. He uses the Operations page to benchmark workload distribution across operators and surface Completion Rate problems to management during quarterly business reviews.
❓ Frequently Asked Questions
What KPIs does the Print Shop Dashboard in Power BI track?
The Print Shop Dashboard in Power BI tracks 5 core KPIs: Total Orders, Total Revenue, Total Cost, Net Profit, and Cancellation Rate. These dynamic cards on the Overview page recalculate in real time as slicers are applied across all five dashboard pages.
Do I need a Power BI subscription to use this dashboard?
No subscription is needed. Power BI Desktop is free to download from Microsoft. A Power BI Pro license ($10/user/month) is only required to publish and share the dashboard with your team via Power BI Service.
Can I customize the charts and DAX measures?
Yes. The Print Shop Dashboard in Power BI is fully editable in Power BI Desktop. You can modify existing DAX measures, add calculated columns, change visual types, and adjust the color theme. Basic customization requires no advanced DAX knowledge.
How does this compare to PrintSmith or Printavo?
The Print Shop Dashboard in Power BI costs $17.99 once, versus $100–$500/user/month for PrintSmith or Printavo. It is a standalone analytics layer, not a full print MIS — ideal for shops wanting Power BI-quality reporting without full order management overhead.
How long does setup take?
Setup takes under 10 minutes. Download the .pbix file, open in Power BI Desktop, and replace the sample data with your own records. All 15+ visuals, 5 KPI cards, and slicer filters update automatically once your data is loaded.
Is there an Excel version of this dashboard?
Yes. The Print Shop Dashboard in Excel is available separately, using pivot tables and SUMIFS instead of DAX. Both templates cover the same 5 pages and KPIs.
What types of print shop data does this template support?
The Print Shop Dashboard in Power BI supports orders, revenue, cost, operator performance, print types, color modes, product categories, delivery types, customer segments, and payment methods — suitable for digital print shops, commercial printers, and large-format printing businesses.
👤 About the Author
Built by PK — Microsoft Certified Professional with 15+ years of Excel, Google Sheets, and Power BI experience. Founder of Nextgen Templates, reaching 300K+ subscribers across YouTube channels (@PK-AnExcelExpert, @NextGenTemplates, @NeoTechNavigators). Every template is hand-built and tested before release.
🔗 Explore Related Templates
Also available for Excel users: Print Shop Dashboard in Excel — same 5 pages and KPIs, powered by pivot tables and SUMIFS.
Explore more Power BI Dashboard Templates across industries including sports, SaaS, retail, and manufacturing.
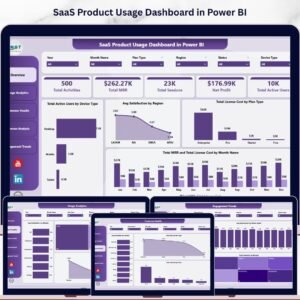
Related: Sports Team Dashboard in Power BI | SaaS Product Usage Dashboard in Power BI | Pricing Strategy KPI Dashboard in Power BI
📖 Click here to read the Detailed Blog Post
🎥 Visit our YouTube channel for step-b
Watch the step-by-step video tutorial:
👉 YouTube.com/@NextGenTemplates
📅 Last updated: May 2026


Reviews
There are no reviews yet.