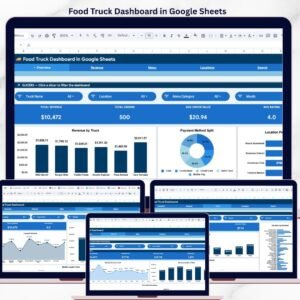
The Food Truck Dashboard in Google Sheets tracks 4 KPIs across 6 interactive pages, with 10+ pre-built charts and multiple slicer filters. Setup takes under 10 minutes — just copy the template to your Google Drive, replace the 500 sample rows with your own data, and every chart updates automatically.
🌍 Join 8,400+ teams in 40+ countries using NextGenTemplates to replace paid SaaS tools with one-time-purchase Excel, Google Sheets, Power BI, and HTML templates.
✅ Instant download · One-time payment · No subscription · No per-user fees · Lifetime access
🔑 Key Features of Food Truck Dashboard in Google Sheets
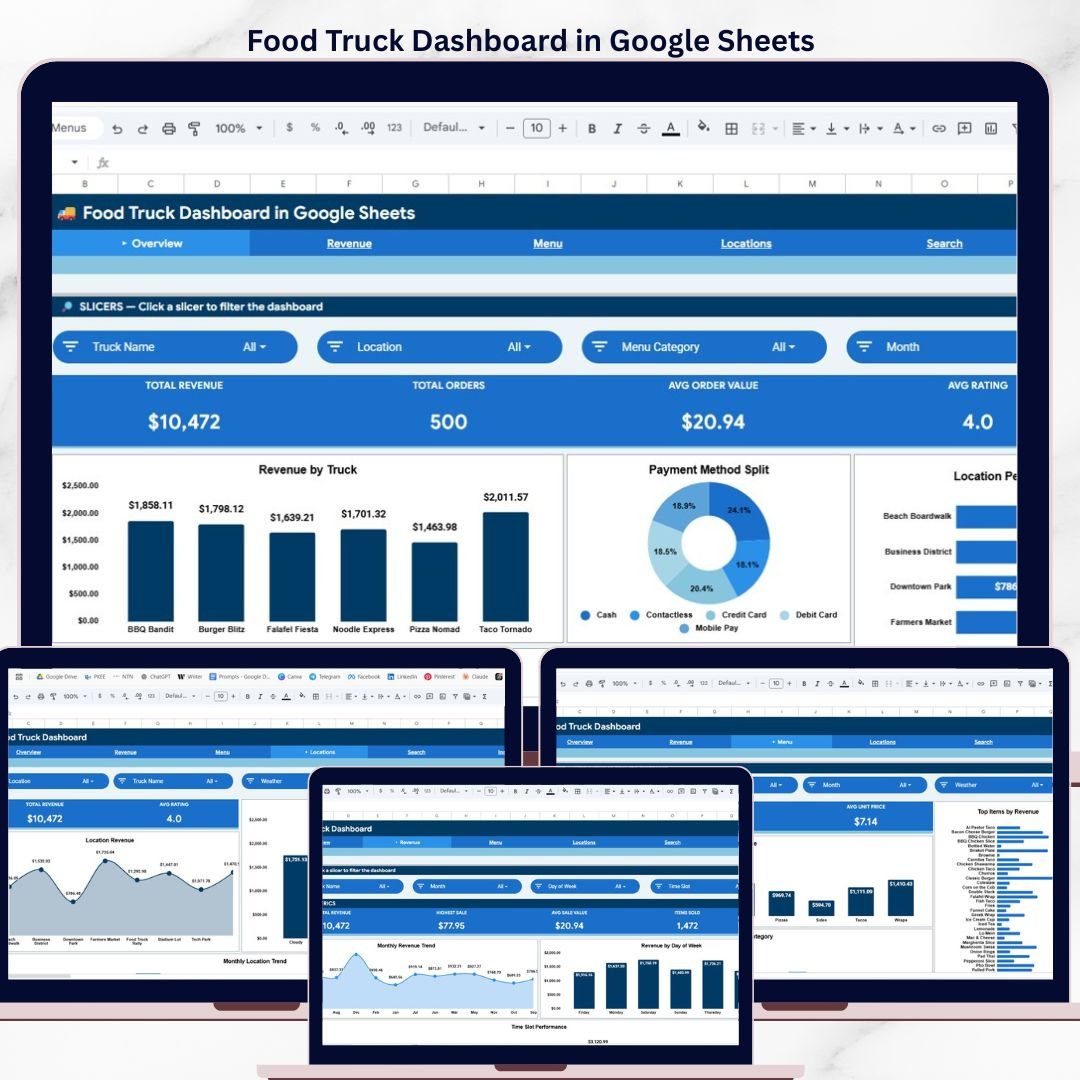
📊 4 KPI Cards on Overview Page — The dashboard tracks Total Revenue, Total Orders, Average Order Value, and Average Rating. These cards update automatically when you add or modify your food truck sales data, giving you a real-time snapshot of business health.
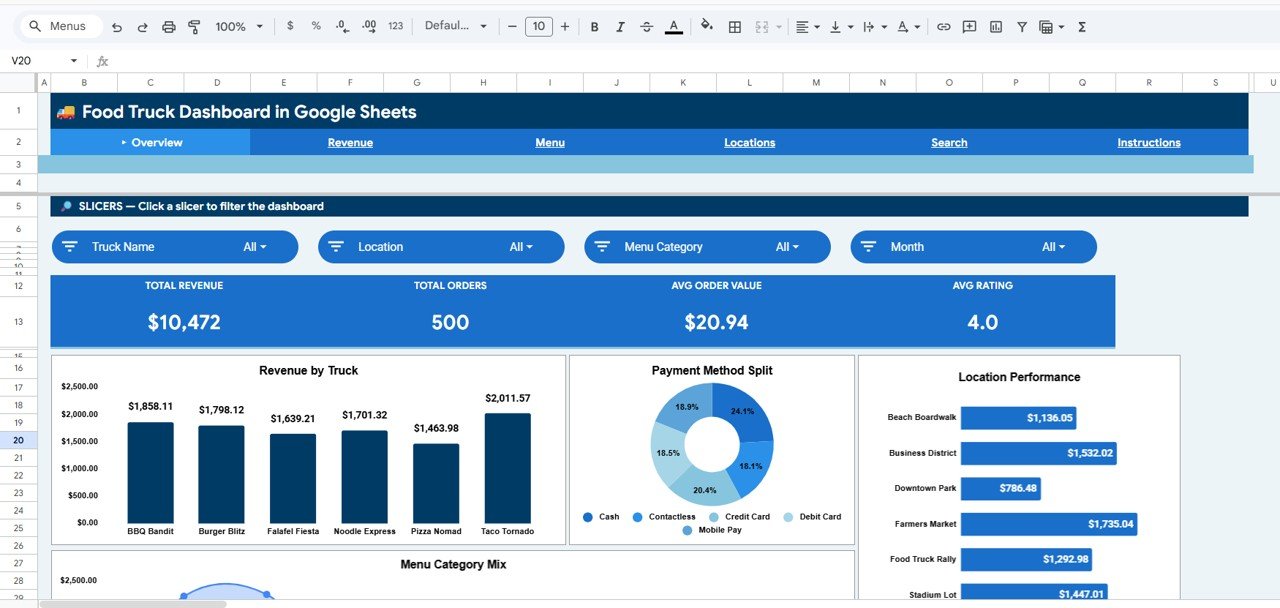
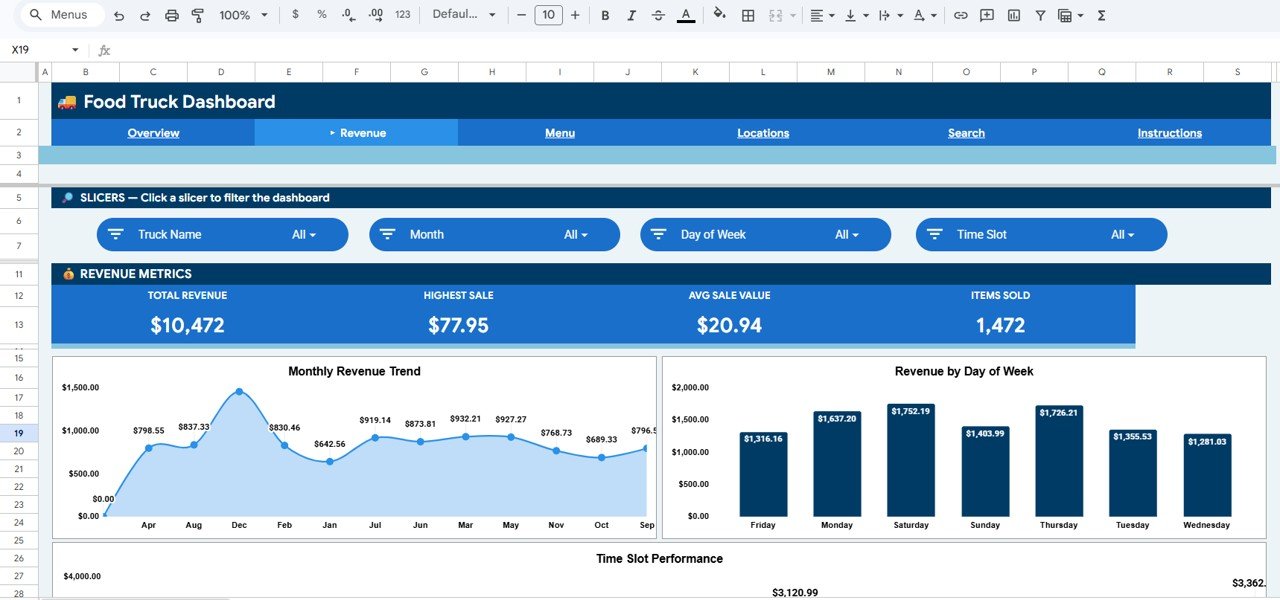
📈 10+ Charts Across 4 Analysis Pages — Revenue by Truck, Payment Method Split, Location Performance, and Menu Category Mix on the Overview page. Revenue Analysis includes Monthly Revenue Trend, Revenue by Day of Week, and Time Slot Performance. Menu Analysis covers Category Revenue, Top Items by Revenue, and Monthly Revenue by Category. Location Analysis tracks Location Revenue, Revenue by Weather, and Monthly Location Trend.
🔍 Transaction Lookup Page — Select any Transaction ID from the dropdown and instantly see full details including Date, Truck Name, Location, Menu Category, Menu Item, Quantity, Unit Price, Revenue, Payment Method, Day of Week, Time Slot, Customer Rating, and Weather conditions.
🎛️ Slicer-Based Filtering — Multiple slicers on the Overview page let you filter the entire dashboard by truck, location, time period, menu category, and more. No formulas to edit — just click and filter.
📋 500-Row Sample Dataset — Pre-loaded with realistic food truck transaction data covering multiple trucks, locations, menu items, and payment methods. Replace with your own data and the dashboard rebuilds instantly.
🔗 Explore more Google Sheets Dashboard Templates for every business need.
📦 What’s Inside the Food Truck Dashboard in Google Sheets
📄 Overview Page — 4 KPI cards (Total Revenue, Total Orders, Avg Order Value, Avg Rating) plus 4 analysis charts (Revenue by Truck, Payment Method Split, Location Performance, Menu Category Mix) with slicer filters for quick drill-down.
 Food Truck Dashboard in Google Sheets
📄 Revenue Analysis Page — Monthly Revenue Trend, Revenue by Day of Week, and Time Slot Performance charts help you identify peak selling periods and optimize scheduling.
 Revenue Analysis
📄 Menu Analysis Page — Category Revenue breakdown, Top Items by Revenue ranking, and Monthly Revenue by Category trends let you identify best-sellers and underperforming menu items.
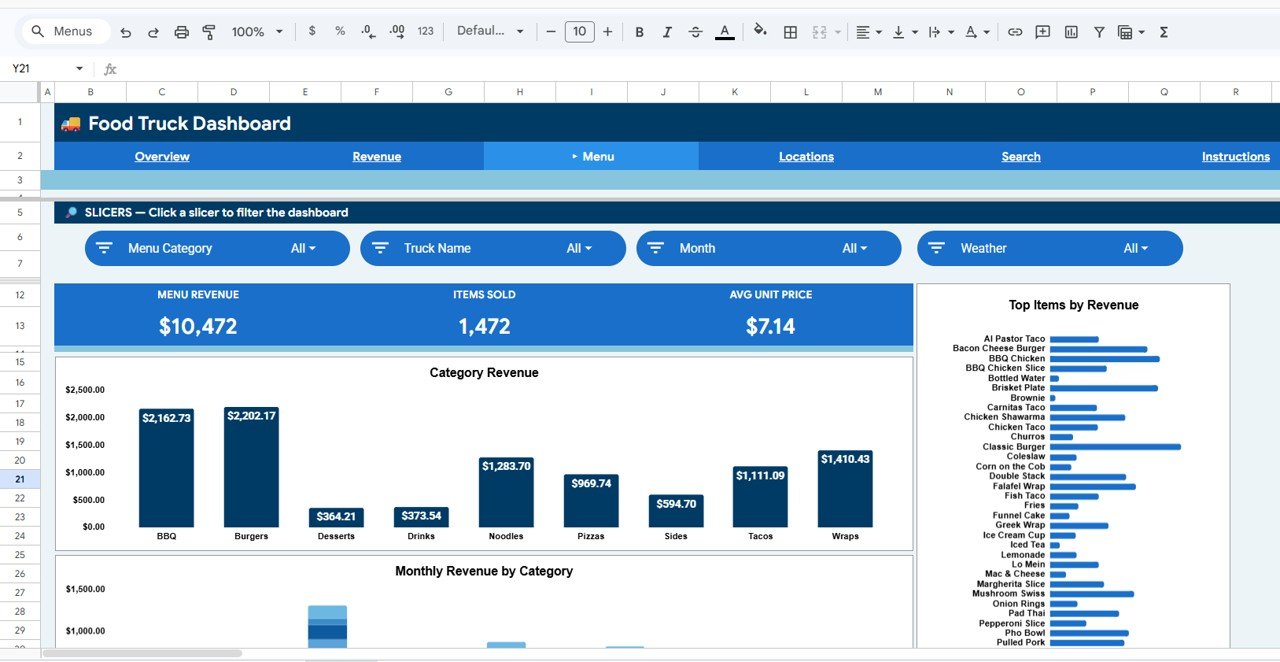 Menu Analysis
📄 Location Analysis Page — Location Revenue comparison, Revenue by Weather conditions, and Monthly Location Trend help you decide which locations are most profitable and how weather impacts sales.
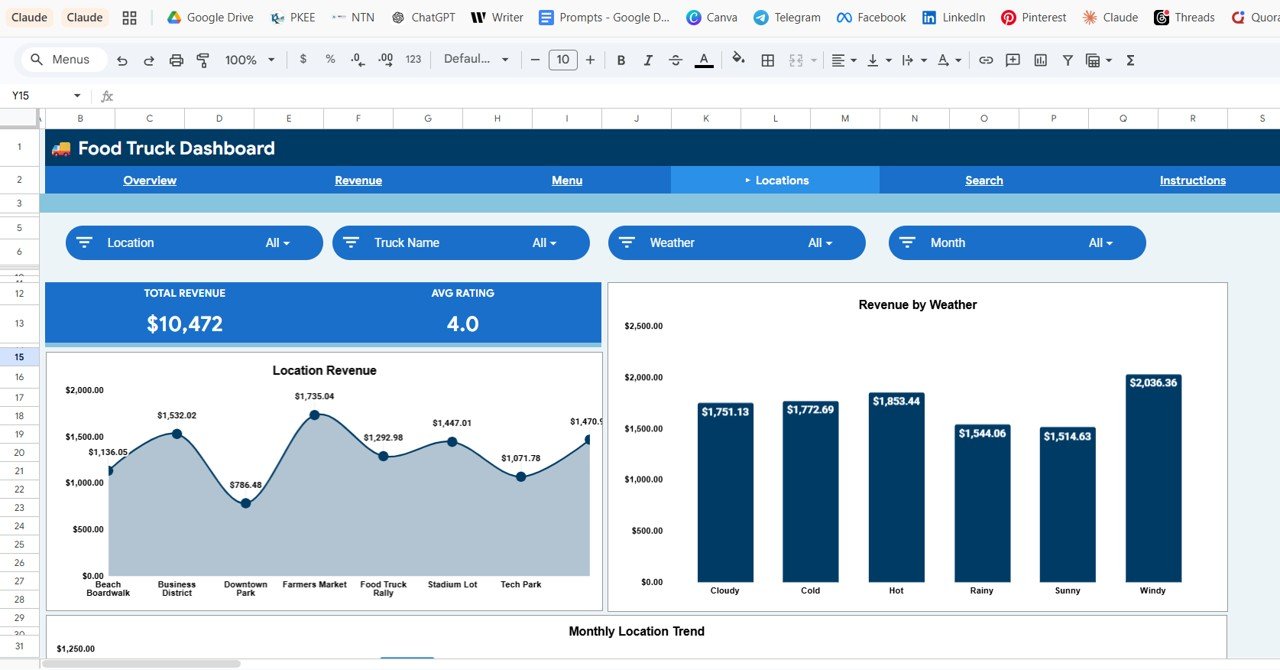 Location Analysis
📄 Search Page — Transaction Lookup feature lets you select a Transaction ID from a dropdown and view all details: Transaction ID, Date, Truck Name, Location, Menu Category, Menu Item, Quantity, Unit Price, Revenue, Payment Method, Day of Week, Time Slot, Customer Rating, and Weather.
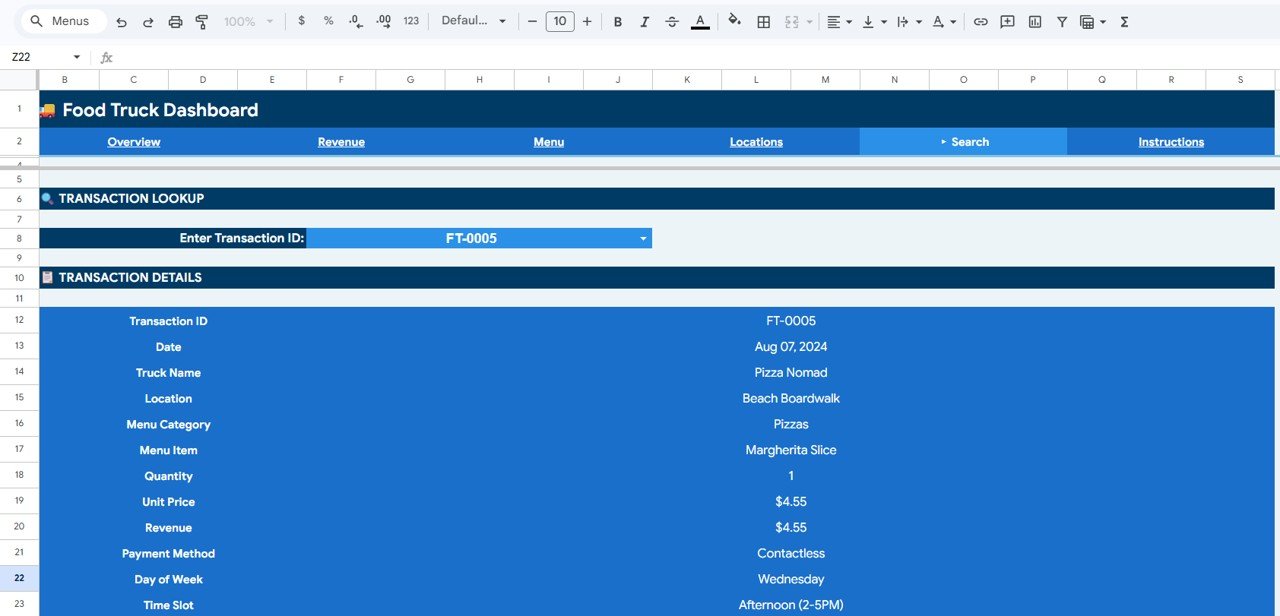 Search Sheet Tab
📄 Data Sheet — This is where you add your food truck transaction data in the same format. 500 sample rows are pre-loaded for immediate use.
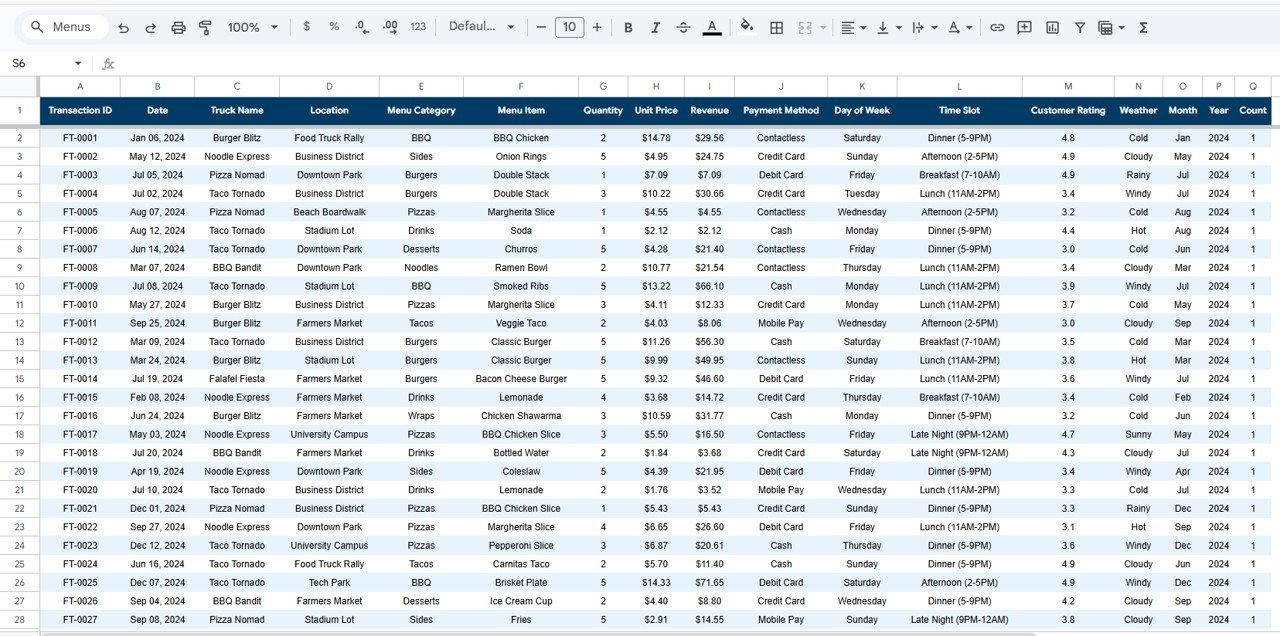 Data Sheet Tab
📊 Food Truck Dashboard in Google Sheets vs. Microsoft Excel Dashboard vs. Square for Restaurants — Where This Fits
| Feature | Food Truck Dashboard in Google Sheets | Excel Food Truck Dashboard | Square for Restaurants |
|---|---|---|---|
| Cost | $9.99 one-time | $9.99–$14.99 one-time | $60/month + processing fees |
| Platform | Google Sheets (browser-based) | Microsoft Excel (desktop) | Web + mobile app |
| Setup Time | Under 10 minutes | 10–15 minutes | 1–2 hours |
| Real-Time Team Collaboration | ✅ Built-in (Google Sheets) | ❌ Requires OneDrive | ✅ Yes |
| Mobile Access | ✅ Google Sheets app | Limited on mobile | ✅ Full mobile app |
| Customizable Fields | ✅ Fully editable | ✅ Fully editable | Limited to plan |
| Share with Link | ✅ One-click sharing | ❌ Need to send file | ✅ Yes |
| Year-1 Cost (3 users) | $9.99 total | $9.99 + Excel license | $720+ per year |
| Weather Impact Analysis | ✅ Built-in | Requires custom setup | ❌ Not available |
For food truck owners who want location-level revenue analytics without paying $60+/month for Square reporting, the Food Truck Dashboard in Google Sheets sits in the sweet spot.
👥 Who This Template Is For — and Who It’s Not For
✅ This template is built for:
- Food truck owners and operators tracking revenue across 1–10 trucks
- Mobile food business managers analyzing menu performance and location profitability
- Food truck fleet operators who need team-shared dashboards without per-user SaaS fees
- Street food vendors and pop-up restaurant owners who want data-driven location decisions
❌ This template is NOT for:
- Enterprise restaurant chains needing POS-integrated real-time inventory management
- Food truck businesses needing automated order processing or payment gateway integration
- Operators who need mobile-first data entry from the truck (this is a reporting dashboard, not a POS)
⚙️ How to Use the Food Truck Dashboard in Google Sheets
- Download the PDF guide from your purchase and click the Google Sheets copy link
- Open the Data sheet and replace the 500 sample rows with your own food truck transaction data
- Navigate to the Overview page to see KPI cards and charts update automatically
- Use slicer filters to drill down by truck, location, time period, or menu category
- Visit Revenue Analysis, Menu Analysis, and Location Analysis pages for detailed breakdowns
- Use the Search page to look up any individual transaction by its Transaction ID
💼 Real-World Use Cases
Marco runs a fleet of 3 taco trucks in Austin. He uses the Food Truck Dashboard in Google Sheets to compare daily revenue across trucks and locations. The Location Analysis page showed him that his downtown spot earned 40% more on rainy days than his park location — so he rerouted his fleet and increased weekly revenue by $800.
Priya operates a single dessert truck in Portland. She uses the Menu Analysis page to identify which items drive the most revenue per category. After dropping two low-performing items and promoting her top seller, average order value jumped from $8.50 to $11.20 within a month.
Jake and Lisa co-own a food truck catering business in Denver. They share the Google Sheets dashboard with their accountant and event coordinator via link. The Revenue by Day of Week chart helps them decide which events to book, and the Payment Method Split tracks their cash-to-card ratio for tax planning.
❓ Frequently Asked Questions
How many KPIs does the Food Truck Dashboard in Google Sheets track?
The Food Truck Dashboard in Google Sheets tracks 4 key performance indicators: Total Revenue, Total Orders, Average Order Value, and Average Rating. All metrics update automatically when you replace the sample data with your own food truck transactions.
Can I track multiple food trucks in one dashboard?
Yes. The Food Truck Dashboard in Google Sheets includes a Truck Name column in the Data sheet. Add data for all your trucks, then use slicer filters on the Overview page to view individual truck performance or the entire fleet at once.
How does this compare to Square for Restaurants?
Square for Restaurants costs $60+/month plus processing fees. The Food Truck Dashboard in Google Sheets is a $9.99 one-time purchase with no recurring costs. Square offers POS integration; this dashboard focuses on analytics, reporting, and location-level revenue tracking.
Do I need any Google Sheets skills to use this?
No advanced skills required. The Food Truck Dashboard in Google Sheets comes pre-built with formulas, charts, and slicer filters. Just replace the 500 sample rows in the Data sheet with your own data. An Instructions sheet is included for guidance.
Can I customize the charts and add new menu categories?
Yes. The Food Truck Dashboard in Google Sheets is fully editable. You can add new menu categories, modify chart ranges, change colors, and add columns to the Data sheet. All formulas and charts reference the Data sheet dynamically.
Does this dashboard work on mobile?
Yes. Since it runs in Google Sheets, you can view the Food Truck Dashboard on any device using the Google Sheets app. Slicer filters and charts render on tablets and phones, though desktop provides the best editing experience.
How long does setup take?
Setup takes under 10 minutes. Download the PDF guide, click the copy link to add the template to your Google Drive, then paste your food truck data into the Data sheet. All 6 dashboard pages update automatically.
👤 About the Author
Built by PK — Microsoft Certified Professional with 15+ years of Excel, Google Sheets, and Power BI experience. Founder of NextGenTemplates, reaching 300K+ subscribers across YouTube channels (@PK-AnExcelExpert, @NextGenTemplates, @NeoTechNavigators). Every template is hand-built and tested before release.
🔗 Explore Related Templates
📊 Church Finance Dashboard in Google Sheets — Track donations, expenses, and fund balances with interactive charts and filters.
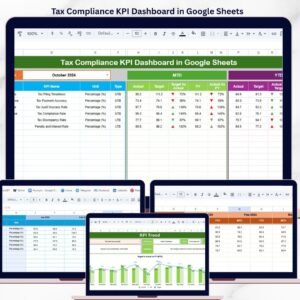
📊 Tax Compliance KPI Dashboard in Google Sheets — Monitor tax filing status, compliance rates, and deadlines across departments.
📊 Browse All Google Sheets Dashboard Templates
📖 Click here to read the Detailed Blog Post
🎥 Visit our YouTube channel for step-by-step video tutorials
👉 YouTube.com/@NextGenTemplates


Reviews
There are no reviews yet.