

Climate Change NGOs Dashboard in Power BI is a professionally designed, ready-to-use analytics solution built for environmental organizations that need to visualize budgets, expenditures, carbon offsets, beneficiaries, volunteers, and regional performance across their climate programs. If your NGO is still relying on disconnected spreadsheets and static reports to manage program data, this Power BI dashboard will completely transform the way you track, analyze, and communicate your climate impact 🌍📊.
This interactive dashboard delivers filterable, multi-page analysis across five powerful pages—covering overview metrics, regional breakdowns, program insights, funding analysis, and impact tracking. With slicers and dynamic visuals, decision-makers can explore data from every angle and present compelling, data-backed stories to donors and stakeholders.
🔑 Key Features of Climate Change NGOs Dashboard in Power BI
📊 Multi-Page Interactive Dashboard – Five dedicated analysis pages covering Overview, Regional Analysis, Program Insights, Funding Analysis, and Impact Tracking provide complete visibility into NGO operations and climate program performance.
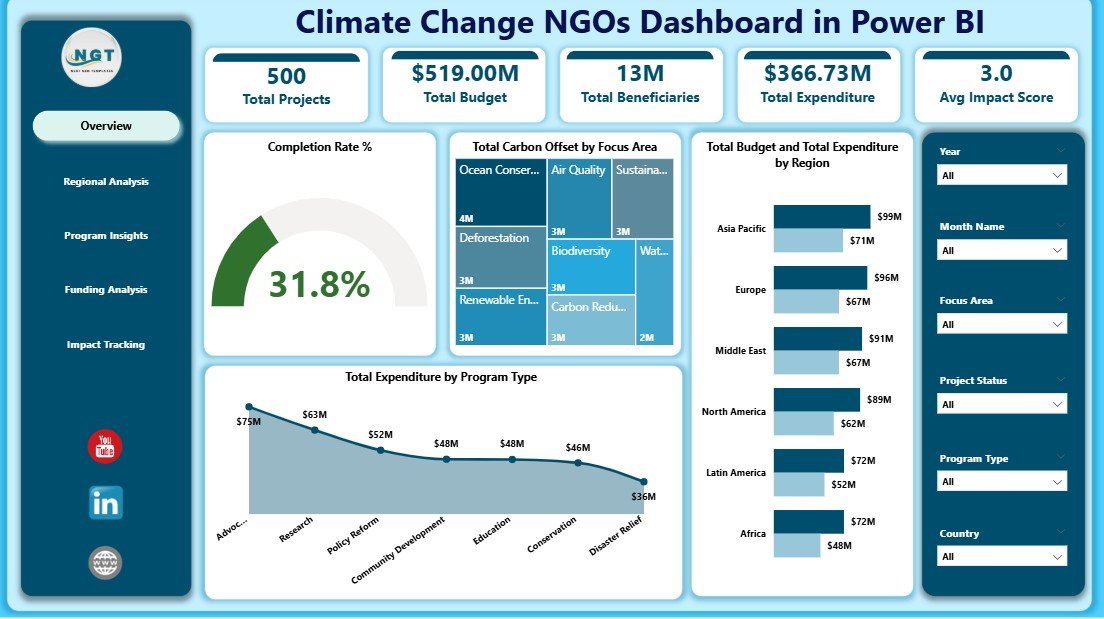
🎯 High-Level KPI Cards – The Overview page displays essential cards including Total Projects, Total Budget, Total Beneficiaries, Total Expenditure, Avg Impact Score, and Completion Rate % for instant executive-level insights.
🔍 Interactive Slicers for Quick Filtering – Multiple slicers on the Overview page allow you to instantly filter data by Region, Program Type, Focus Area, Funding Source, and more to drill down into specific segments.
📈 Carbon Offset Analysis – Visualize Total Carbon Offset by Focus Area and by Region to measure your environmental footprint and track progress toward emission reduction goals.
🌱 Budget vs Expenditure Comparison – Compare Total Budget and Total Expenditure by Region to identify spending efficiency, underspending, or resource allocation gaps across your programs.
🤝 Beneficiary and Volunteer Tracking – Analyze Total Beneficiaries by Focus Area, Total Volunteers by Region, and Total Beneficiaries by Month Name to evaluate outreach and community engagement over time.
💰 Comprehensive Funding Analysis – Understand how funds flow from different sources with detailed breakdowns of Total Beneficiaries, Total Expenditure, and Total Projects by Funding Source.
⚡ Project Status and Completion Monitoring – Track Total Projects by Project Status and Completion Rate % by Funding Source to ensure timely delivery and accountability across all climate initiatives.
 Climate Change NGOs Dashboard in Power BI
📦 What’s Inside the Climate Change NGOs Dashboard in Power BI
📊 Overview Page – The main summary page displays high-level KPI cards including Total Projects, Total Budget, Total Beneficiaries, Total Expenditure, Avg Impact Score, and Completion Rate %. Interactive charts show Total Carbon Offset by Focus Area, Total Budget and Total Expenditure by Region, and Total Expenditure by Program Type. Multiple slicers allow instant filtering for focused analysis.
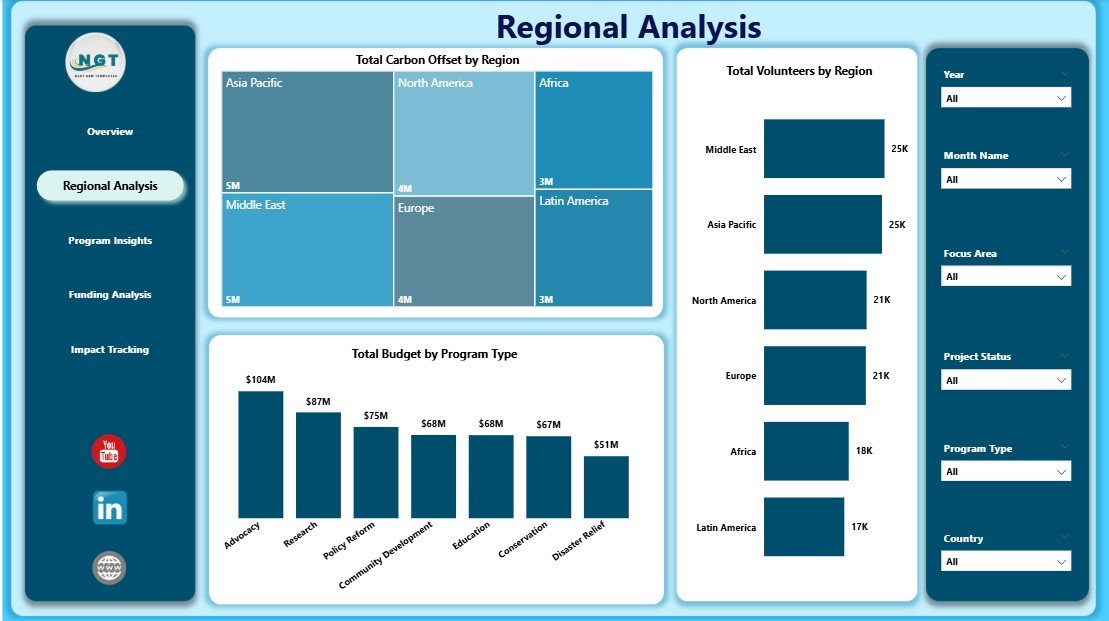
🌍 Regional Analysis Page – Dive deep into geographic performance with charts showing Total Carbon Offset by Region, Total Volunteers by Region, and Total Budget by Program Type to understand how each region contributes to your climate mission.
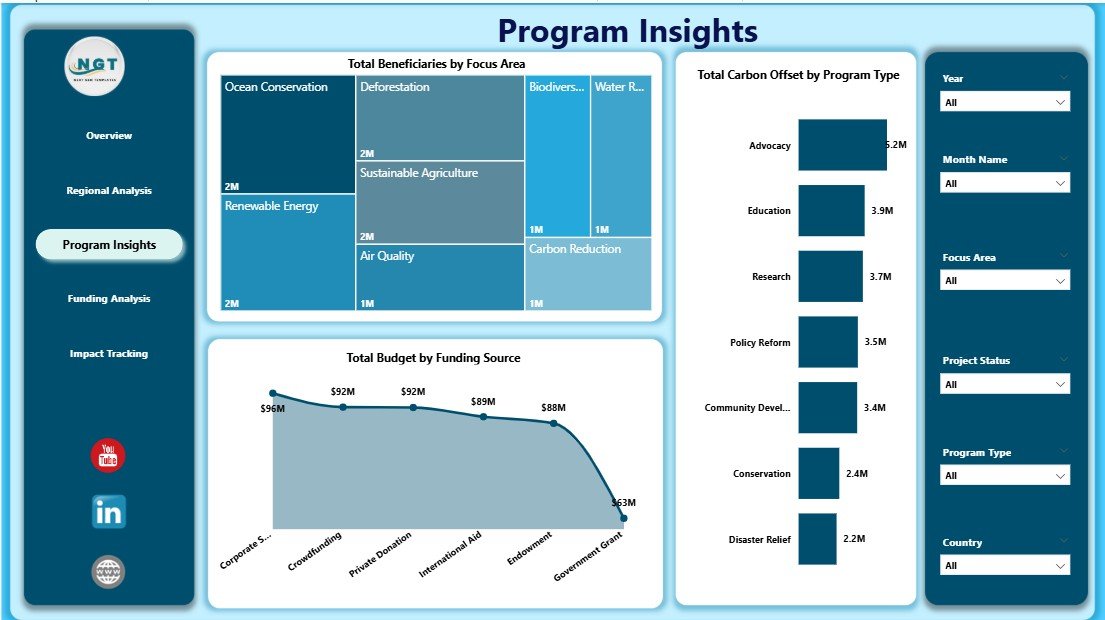
📋 Program Insights Page – Analyze program-level effectiveness through Total Beneficiaries by Focus Area, Total Carbon Offset by Program Type, and Total Budget by Funding Source to optimize resource allocation and maximize program outcomes.
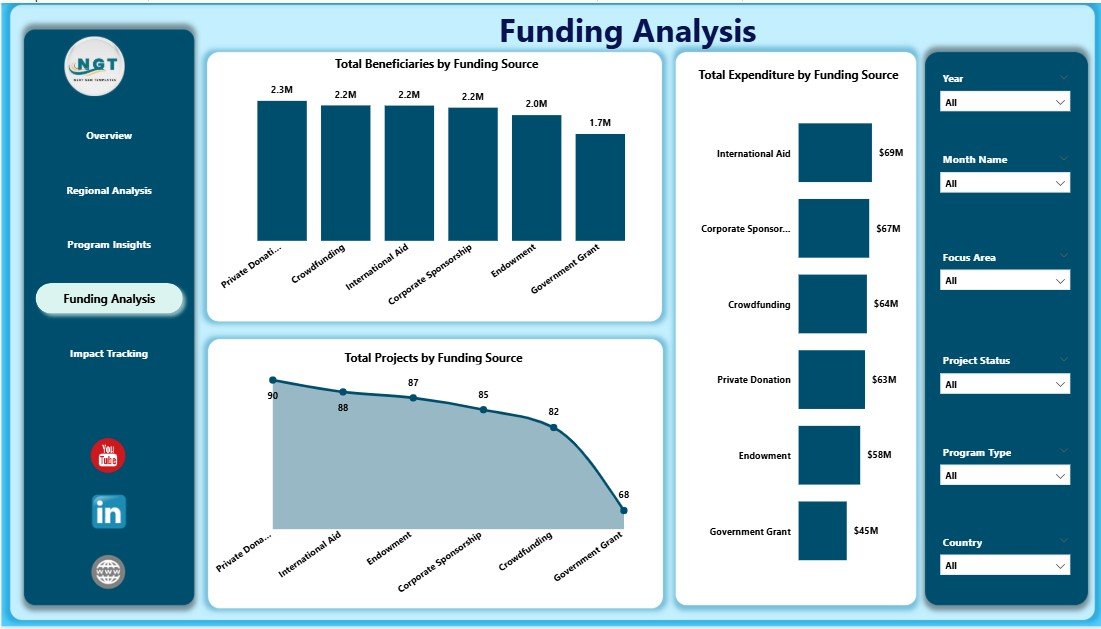
💰 Funding Analysis Page – Track funding efficiency with Total Beneficiaries by Funding Source, Total Expenditure by Funding Source, and Total Projects by Funding Source to ensure transparent and accountable donor reporting.
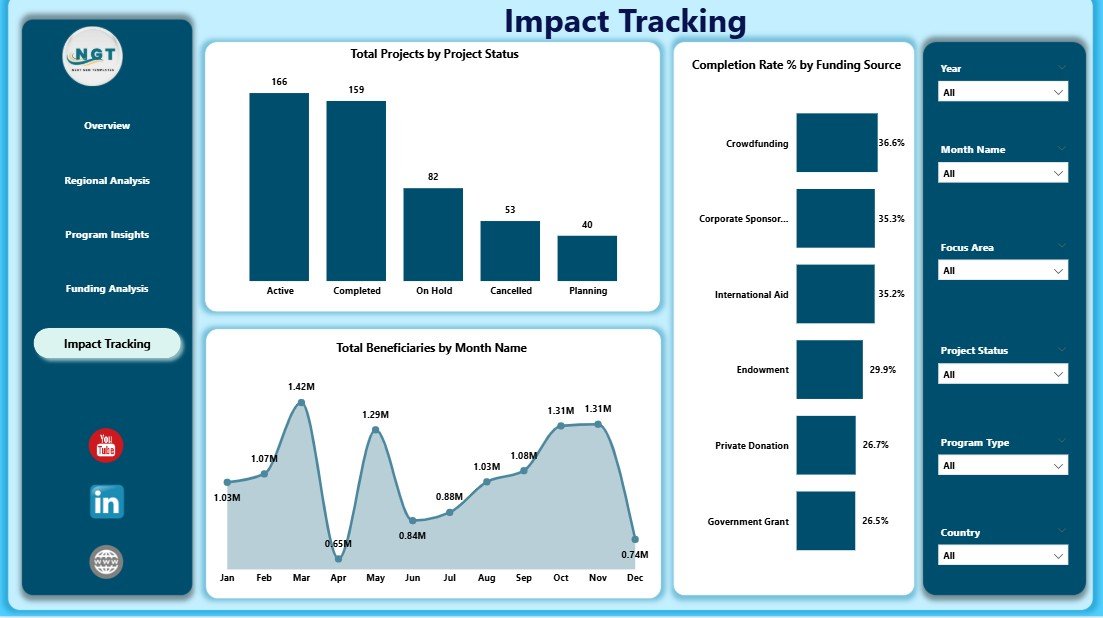
📈 Impact Tracking Page – Monitor impact trends through Total Projects by Project Status, Completion Rate % by Funding Source, and Total Beneficiaries by Month Name to evaluate the effectiveness of your environmental initiatives over time.
⚙️ How to Use the Climate Change NGOs Dashboard in Power BI
1️⃣ Open the Power BI Desktop file (.pbix) included in the download package
2️⃣ Connect or replace the sample data source with your own NGO operational data
3️⃣ Click Refresh to update all visuals across all five dashboard pages
4️⃣ Use slicers on the Overview page to filter and explore your data dynamically
5️⃣ Navigate between pages to analyze regional, program, funding, and impact insights
👥 Who Can Benefit from This Climate Change NGOs Dashboard in Power BI
🌱 Climate Change NGOs & Environmental Organizations – Visualize program performance and climate impact clearly across all operations
📊 Monitoring & Evaluation Teams – Track budgets, beneficiaries, carbon offsets, and outcomes across programs and regions effortlessly
💰 Donor Reporting & Grant Management Teams – Present transparent, data-backed reports to donors, funders, and stakeholders
📈 Sustainability & Program Managers – Optimize resource allocation, measure environmental outcomes, and improve program delivery
🏛️ Government & Policy Organizations – Analyze NGO performance data for evidence-based policy decisions and funding approvals
📖 Click here to read the Detailed Blog Post
🎥 Visit our YouTube channel to learn step-by-step video tutorials
👉 YouTube.com/@NextGenTemplates


Reviews
There are no reviews yet.