Managing blockchain development projects can quickly become overwhelming. With multiple sprints, platforms, teams, and budgets involved, keeping everything organized manually often leads to confusion, delays, and inefficiencies.
So, how can you simplify project tracking and gain complete visibility over your blockchain development lifecycle?
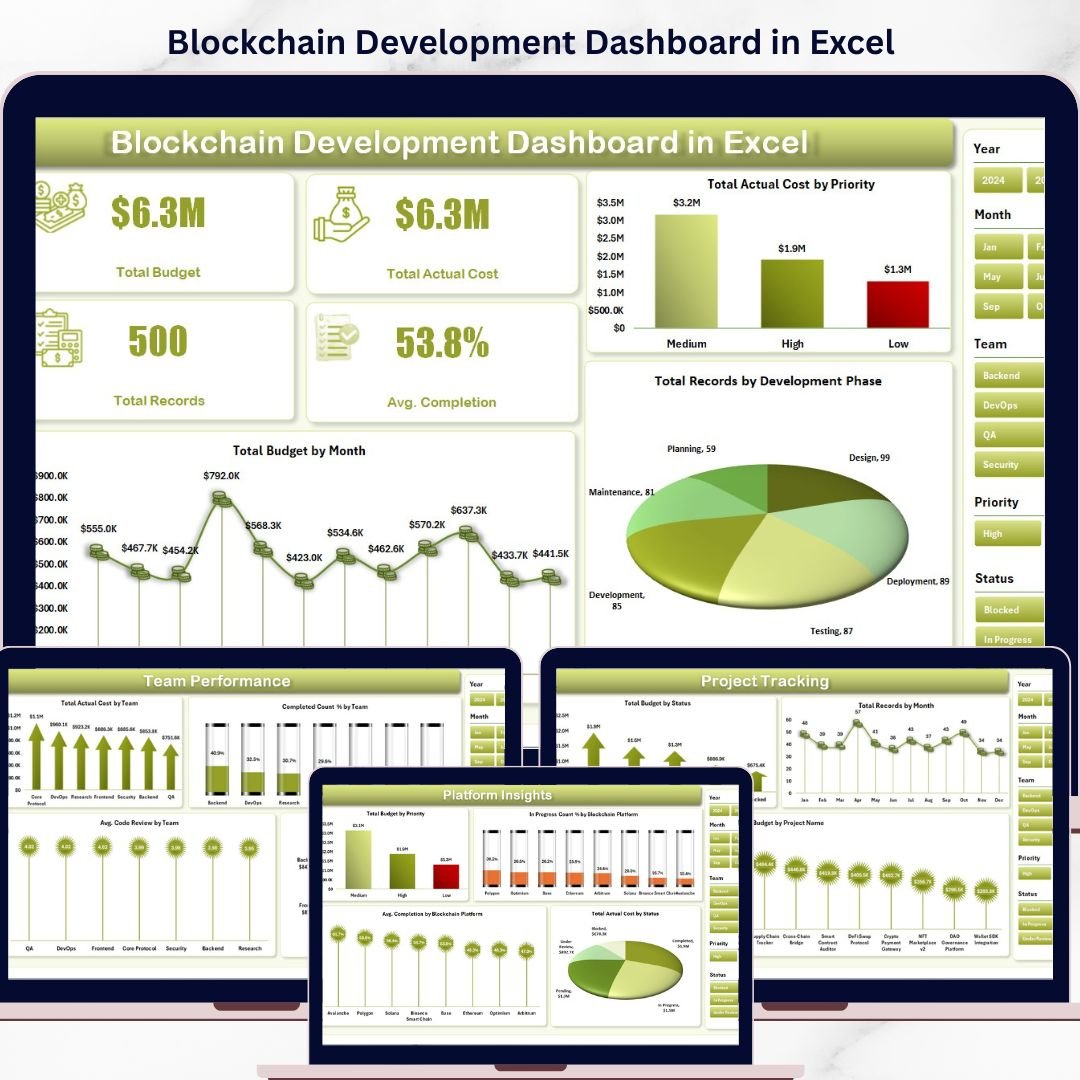
👉 The answer is simple — Blockchain Development Dashboard in Excel.
This powerful, ready-to-use Excel dashboard is designed to help you track, analyze, and manage blockchain projects efficiently. Instead of relying on scattered spreadsheets, this tool centralizes all your project data into one interactive and user-friendly dashboard.
With dynamic visuals, KPI cards, and slicers, you can instantly monitor budgets, actual costs, sprint progress, team performance, and platform insights. As a result, you can make faster, smarter, and more data-driven decisions.
Whether you are managing multiple blockchain projects or tracking agile development cycles, this dashboard gives you complete control over your operations.
🚀 Key Features of Blockchain Development Dashboard in Excel
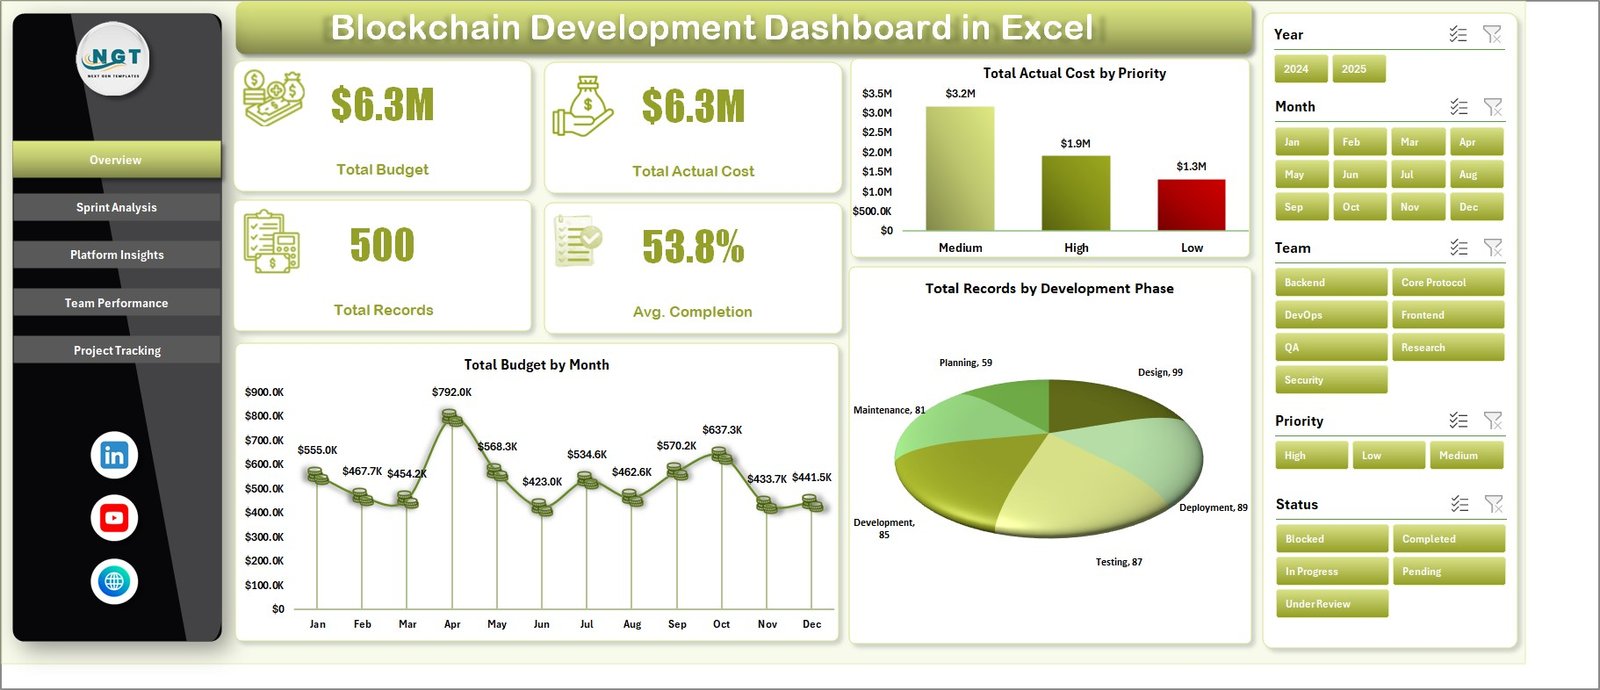
📊 Interactive Overview Dashboard
Get a high-level summary of budget, actual cost, total records, and completion percentage in one place.
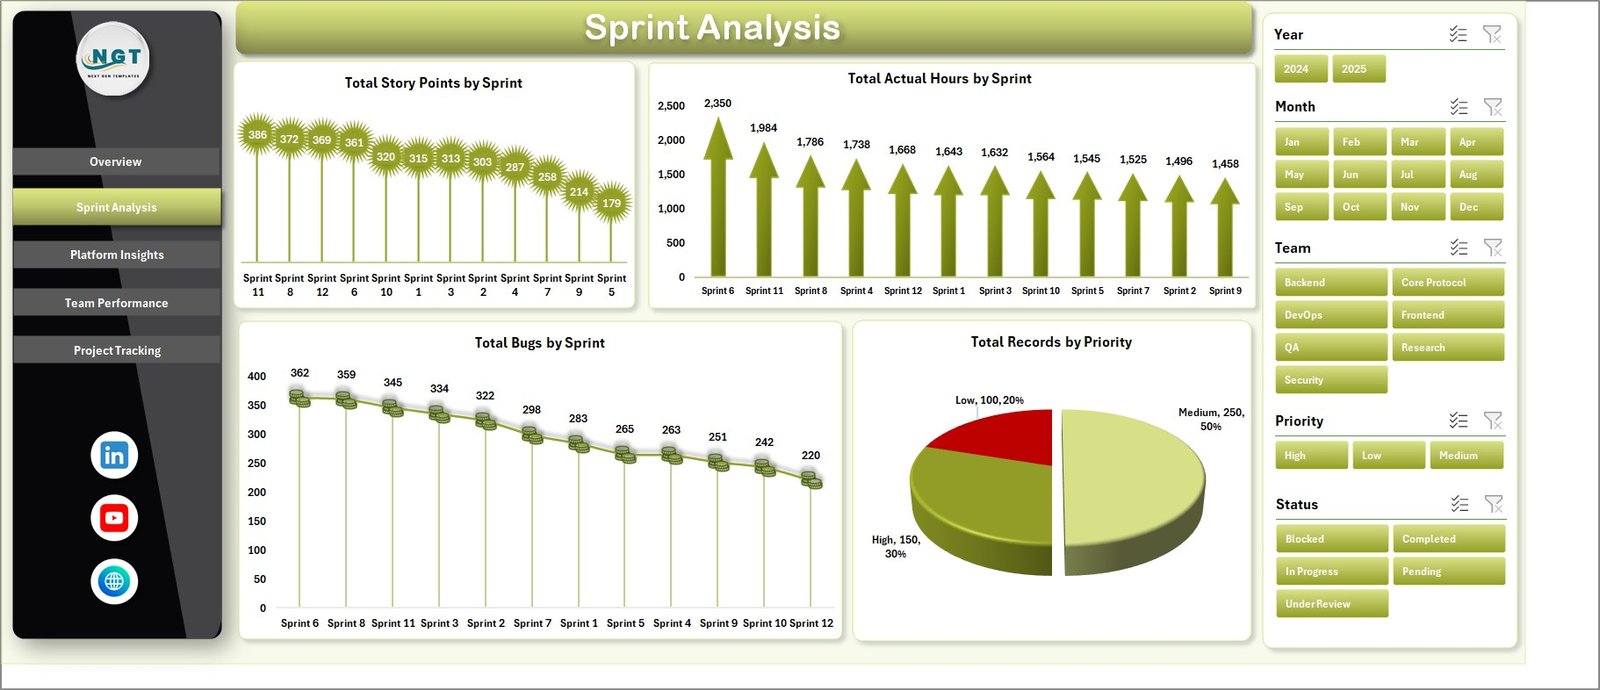
📅 Sprint Analysis Tracking
Monitor story points, actual hours, bugs, and priorities across sprints for better agile management.
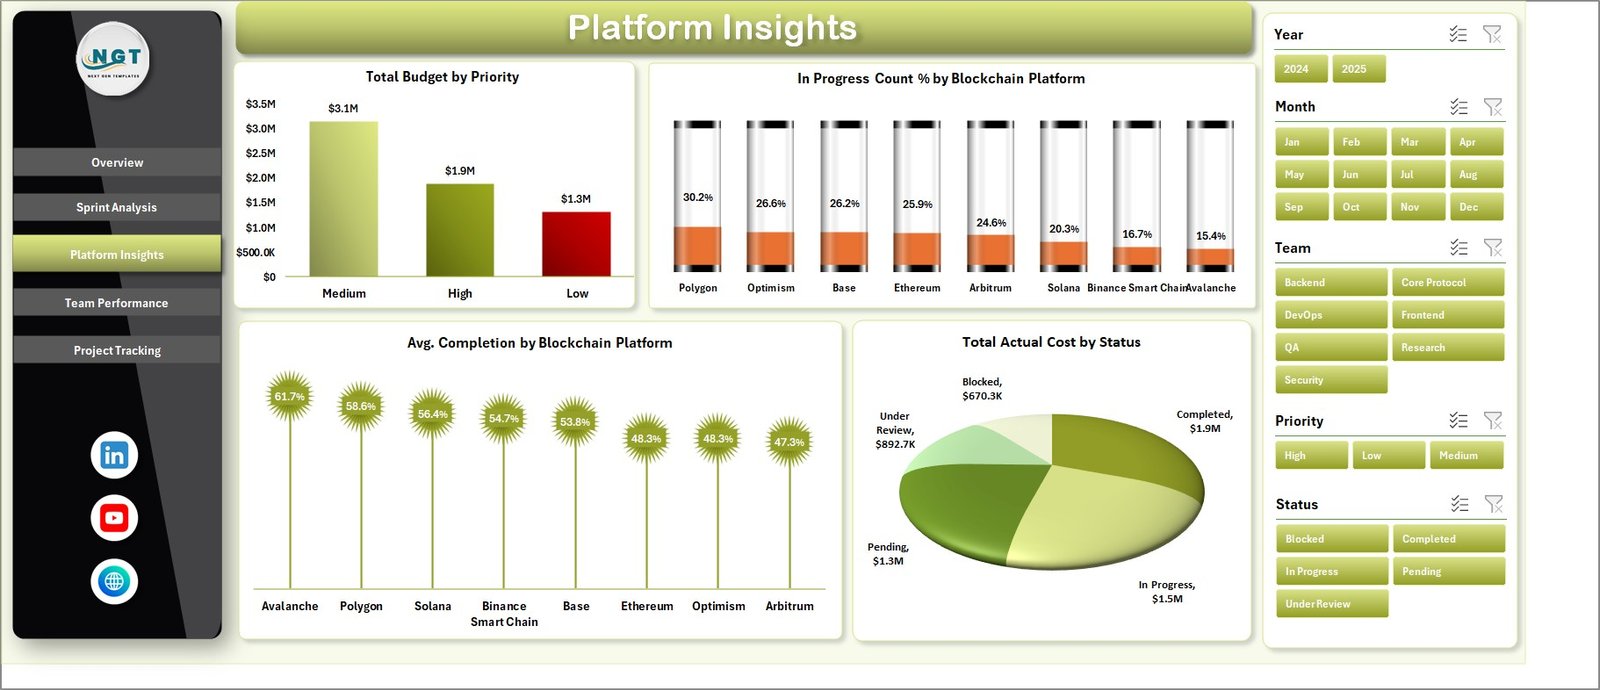
🌐 Platform Performance Insights
Analyze blockchain platform performance based on cost, progress, and completion rates.
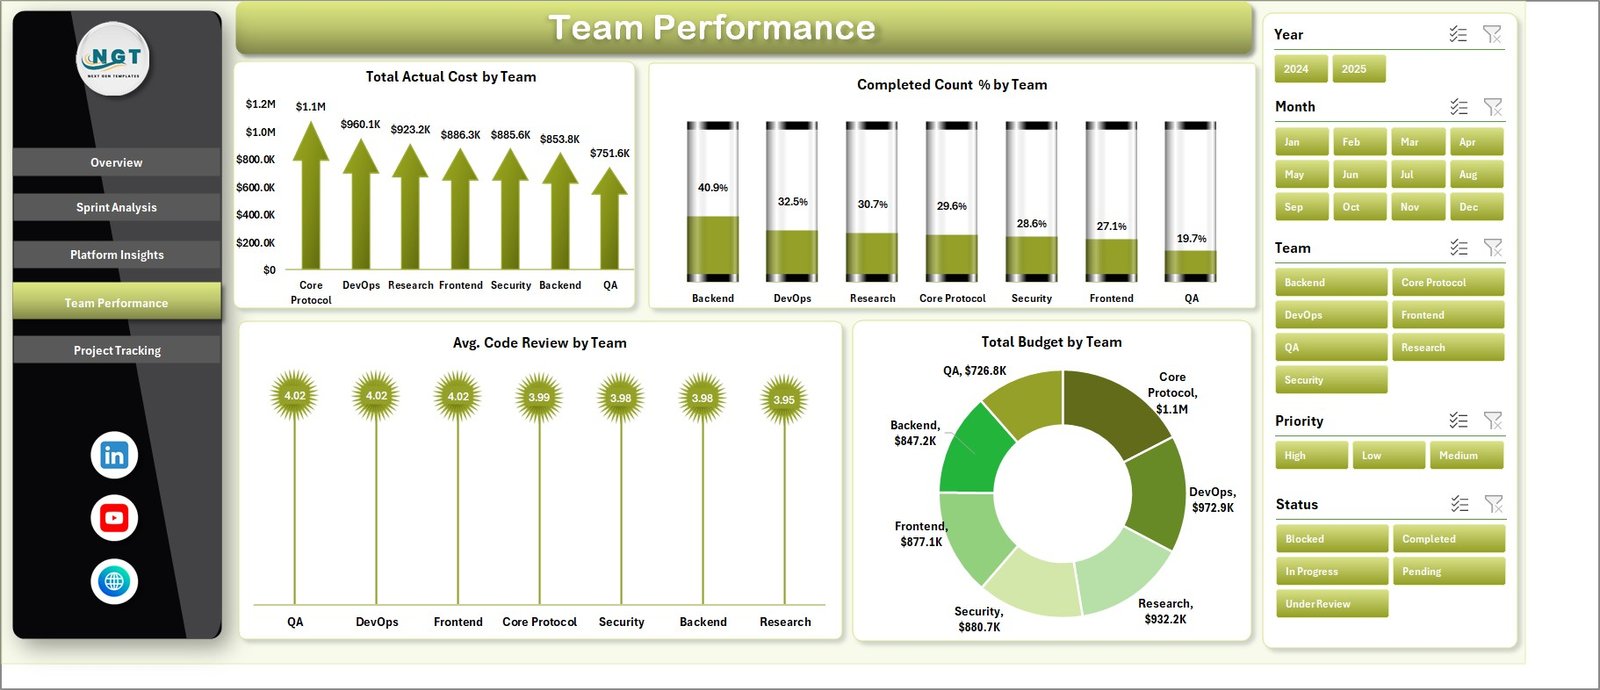
👨💻 Team Performance Evaluation
Track team productivity, budget allocation, and completion percentages to identify top performers.
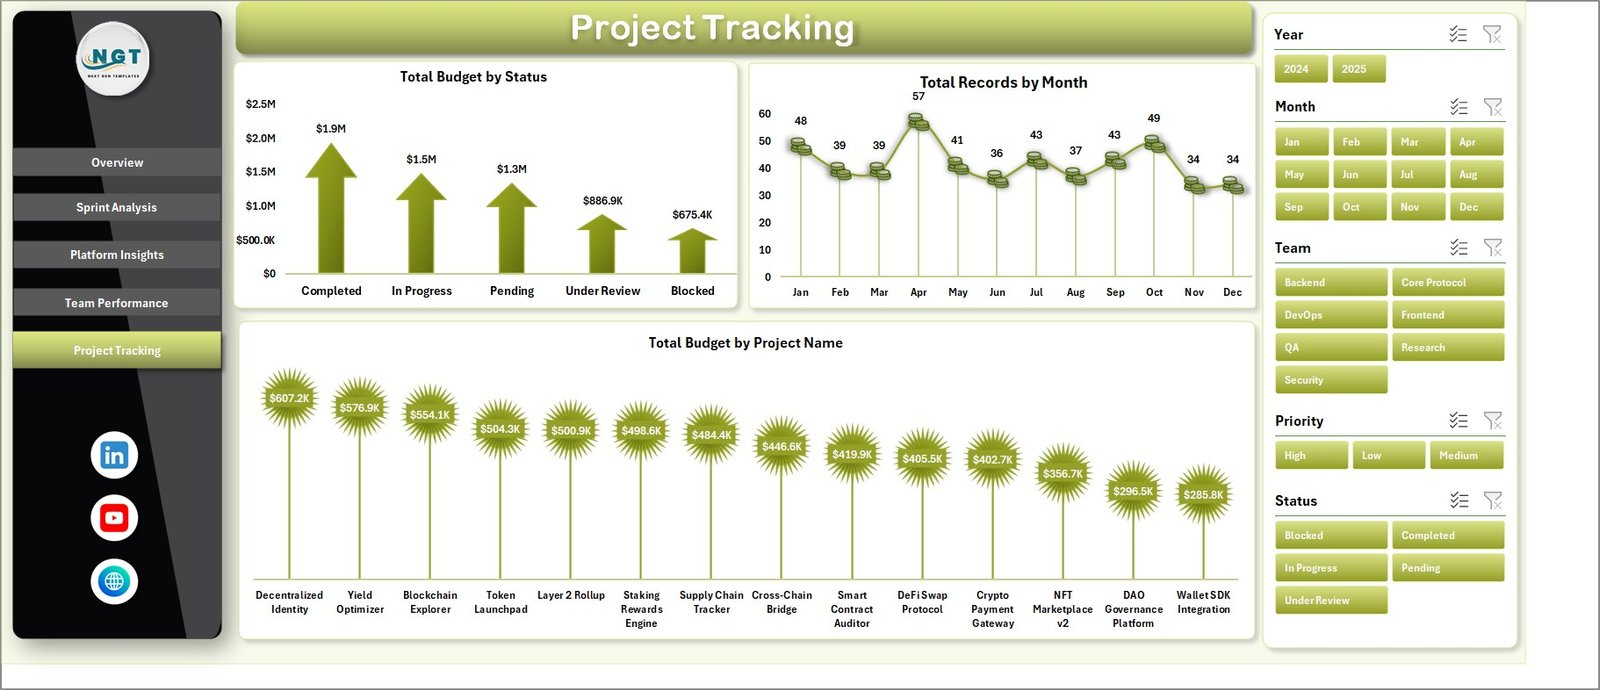
📁 Project Tracking Made Easy
Monitor project status, monthly records, and budget allocation across all projects.
🔄 Dynamic & Auto-Refreshing Dashboard
Update your data and simply click refresh to get real-time insights instantly.
🎯 KPI-Driven Decision Making
Track key metrics like budget vs actual cost and completion rates for better planning.
🎛️ Slicers for Smart Filtering
Filter data by month, team, platform, priority, and more for deep analysis.
📦 What’s Inside the Blockchain Development Dashboard in Excel
✔️ Fully functional Excel dashboard template
✔️ Multiple interactive sheets (Overview, Sprint Analysis, Platform Insights, Team Performance, Project Tracking)
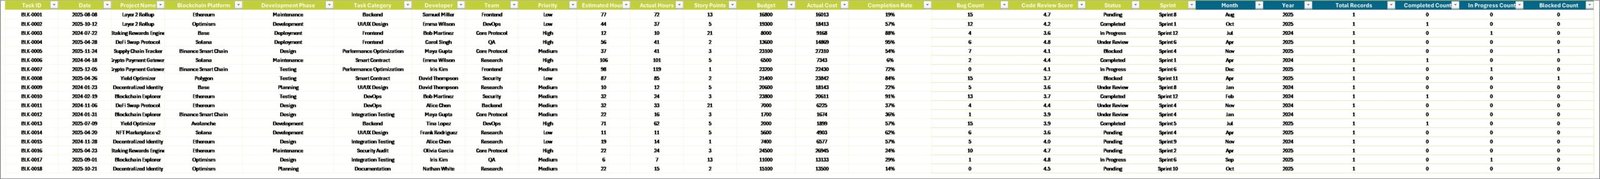
✔️ Raw data sheet for easy data entry
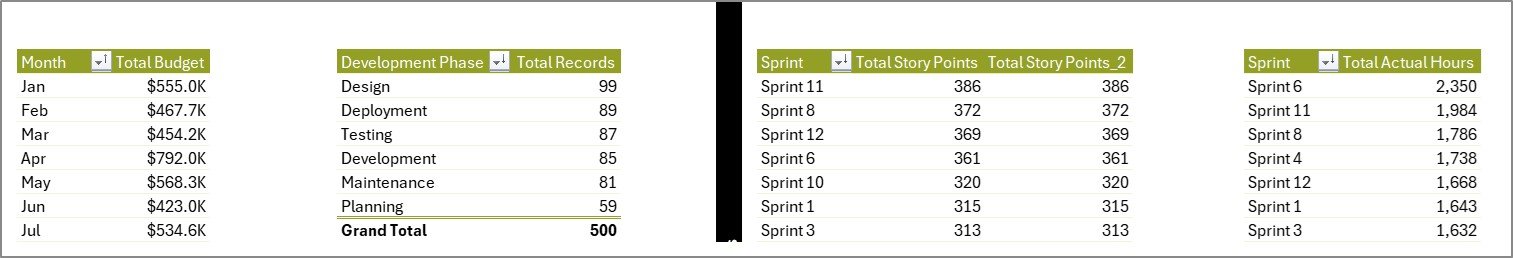
✔️ pre-built pivot tables and calculations
✔️ KPI cards and dynamic charts
✔️ Easy-to-use interface with navigation
⚙️ How to Use the Blockchain Development Dashboard in Excel
1️⃣ Enter your project data in the Data Sheet
2️⃣ Ensure the format remains consistent
3️⃣ Go to the Data tab → Click Refresh All
4️⃣ Use slicers to filter data as needed
5️⃣ Analyze insights across different dashboard pages
👉 No advanced Excel skills required — just update and analyze!
👥 Who Can Benefit from This Blockchain Development Dashboard in Excel
✔️ Blockchain Project Managers
✔️ Agile & Scrum Teams
✔️ Software Development Teams
✔️ Startup Founders & CTOs
✔️ Data Analysts & Business Analysts
✔️ IT Project Managers
If you are handling multiple projects, tracking budgets, or managing teams, this dashboard is a must-have tool.
💡 Why Choose This Dashboard?
Unlike basic spreadsheets, this dashboard provides a complete, interactive, and automated solution. It not only saves time but also improves accuracy and decision-making.
With everything in one place, you can easily identify bottlenecks, control costs, and improve project efficiency.
👉 Stop wasting hours on manual reporting and start making smarter decisions today!


