Running a backpacker hostel is not just about managing rooms—it’s about understanding your bookings, tracking revenue, improving guest satisfaction, and making smart business decisions. But when your data is scattered across spreadsheets, things can quickly become confusing.
What if you could manage everything in one powerful dashboard?
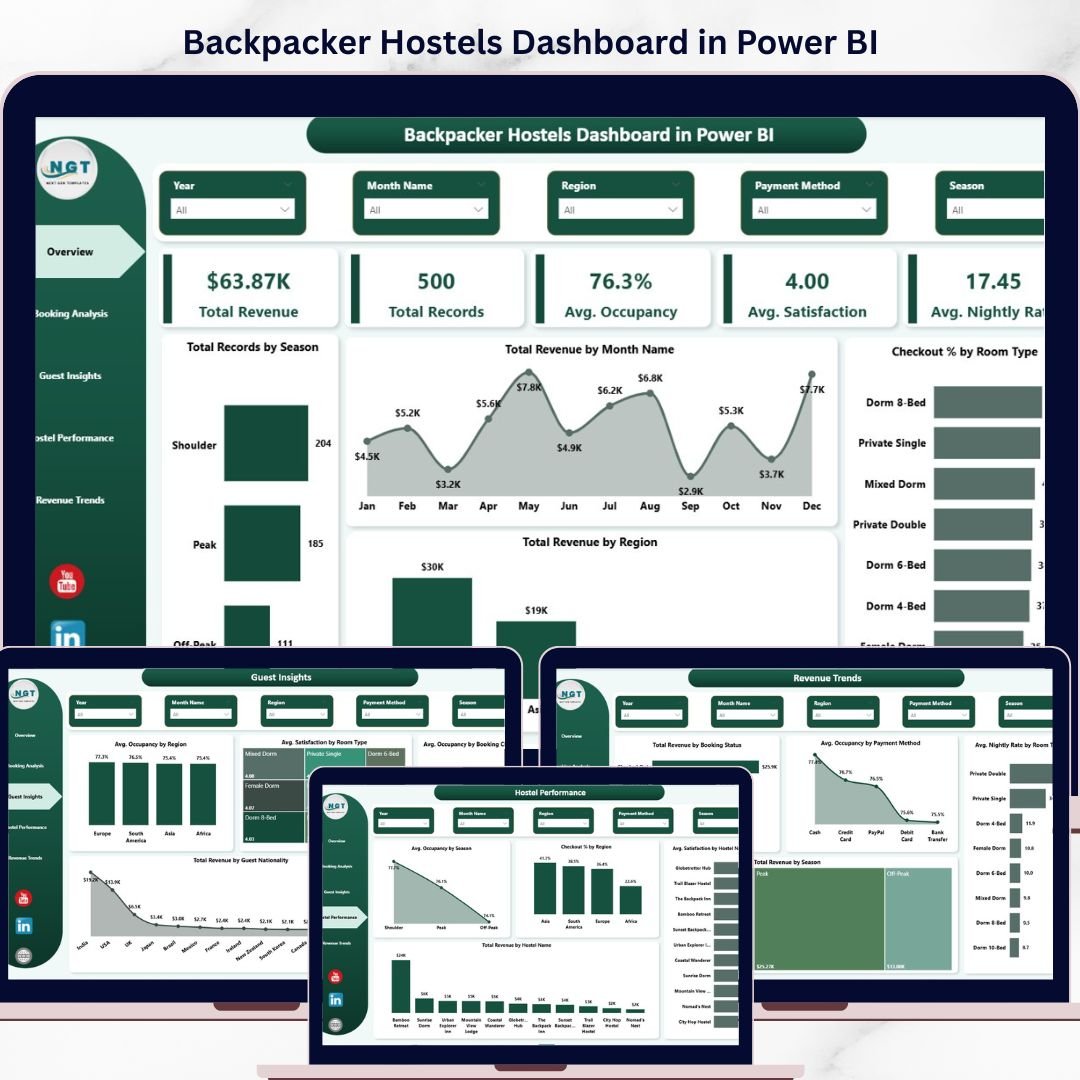
Introducing the Backpacker Hostels Dashboard in Power BI – a modern, interactive solution designed to help hostel owners and managers turn complex data into clear, actionable insights. Whether you operate a single hostel or manage multiple locations, this dashboard gives you complete control over your business performance.
With dynamic visuals, real-time filtering, and easy-to-understand KPIs, this dashboard helps you analyze trends, identify opportunities, and optimize operations without any hassle.
🚀 Key Features of Backpacker Hostels Dashboard in Power BI
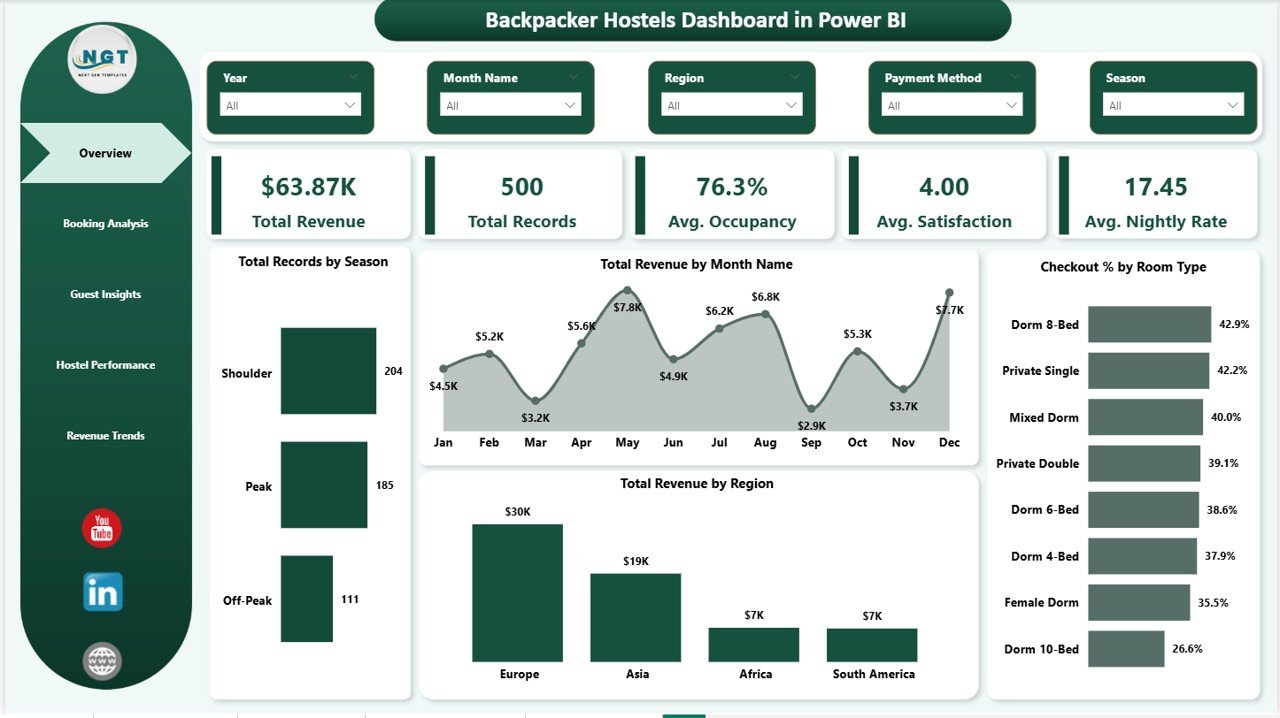
📊 Powerful KPI Monitoring – Track essential metrics like Total Revenue, Total Records, Avg. Occupancy, Avg. Satisfaction, and Avg. Nightly Rate instantly.
📈 Interactive Visual Reports – Analyze performance through charts like Revenue by Month, Region, and Booking Status with clarity.
🎯 Smart Filters & Slicers – Easily filter data by region, booking channel, payment method, and more for deeper insights.
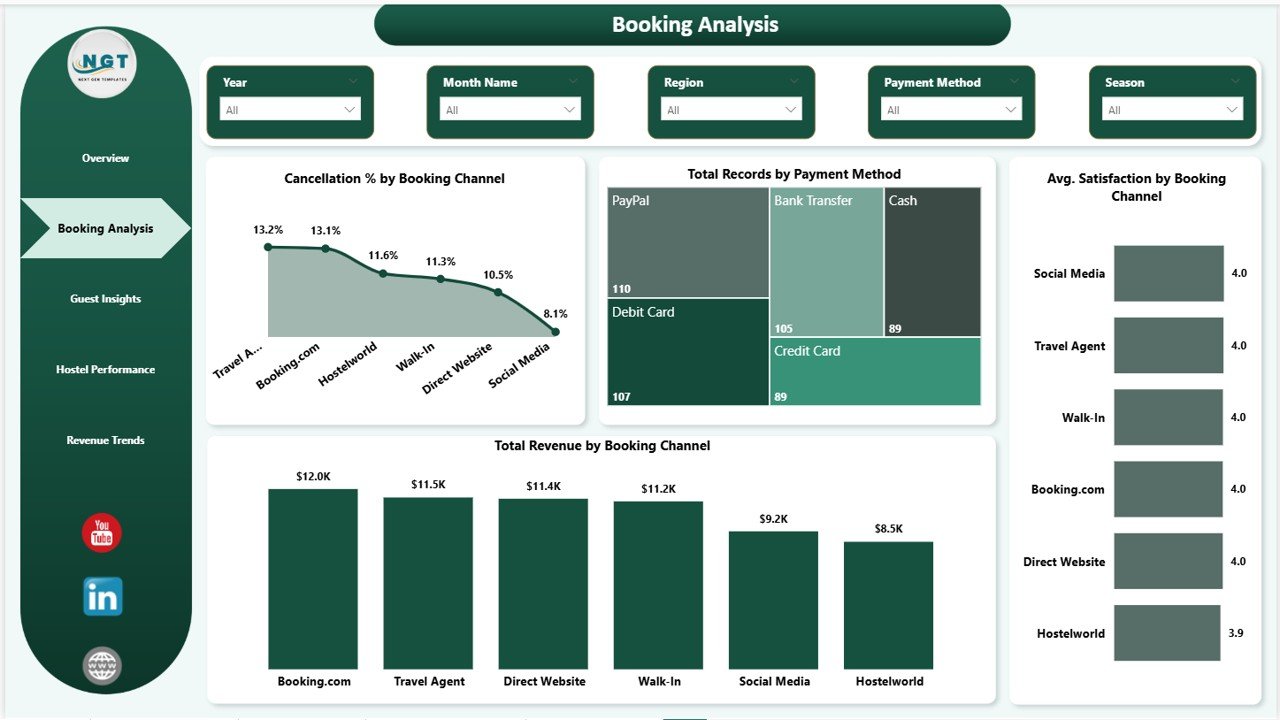
💡 Booking Channel Analysis – Identify which platforms drive the most revenue and which one’s cause cancellations.
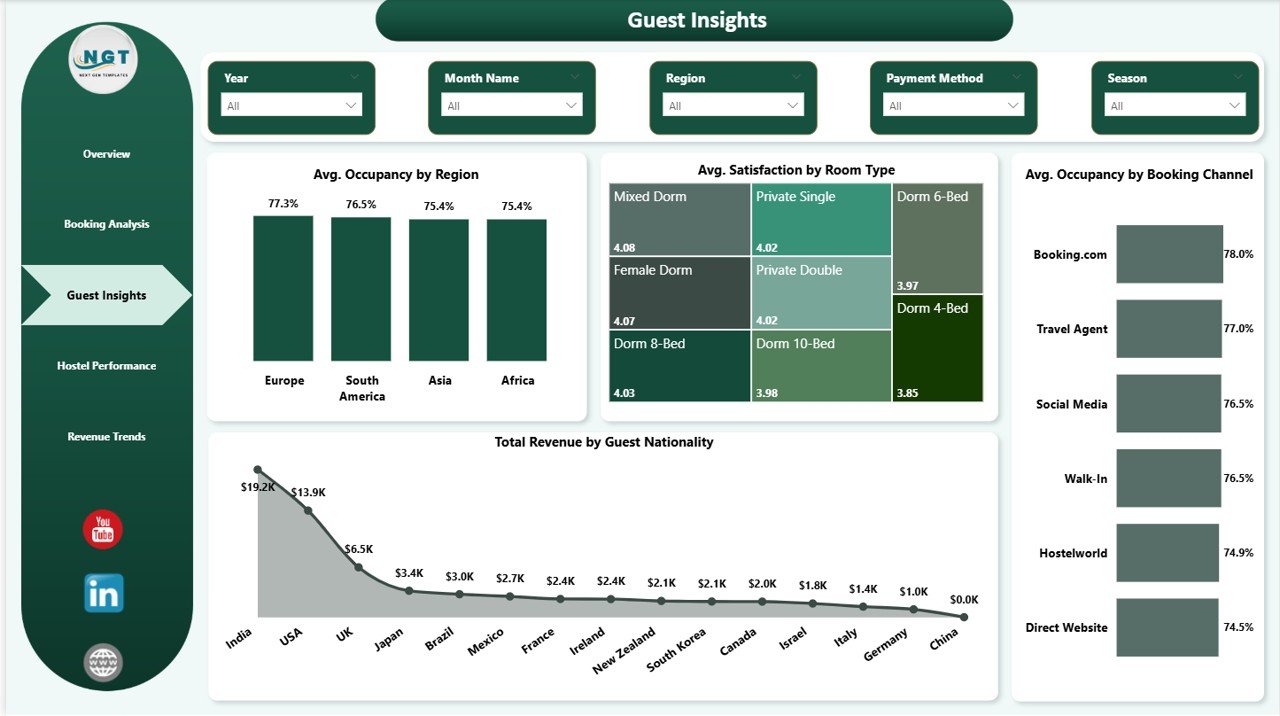
🌍 Guest Behavior Insights – Understand guest nationality, preferences, and satisfaction trends to improve services.
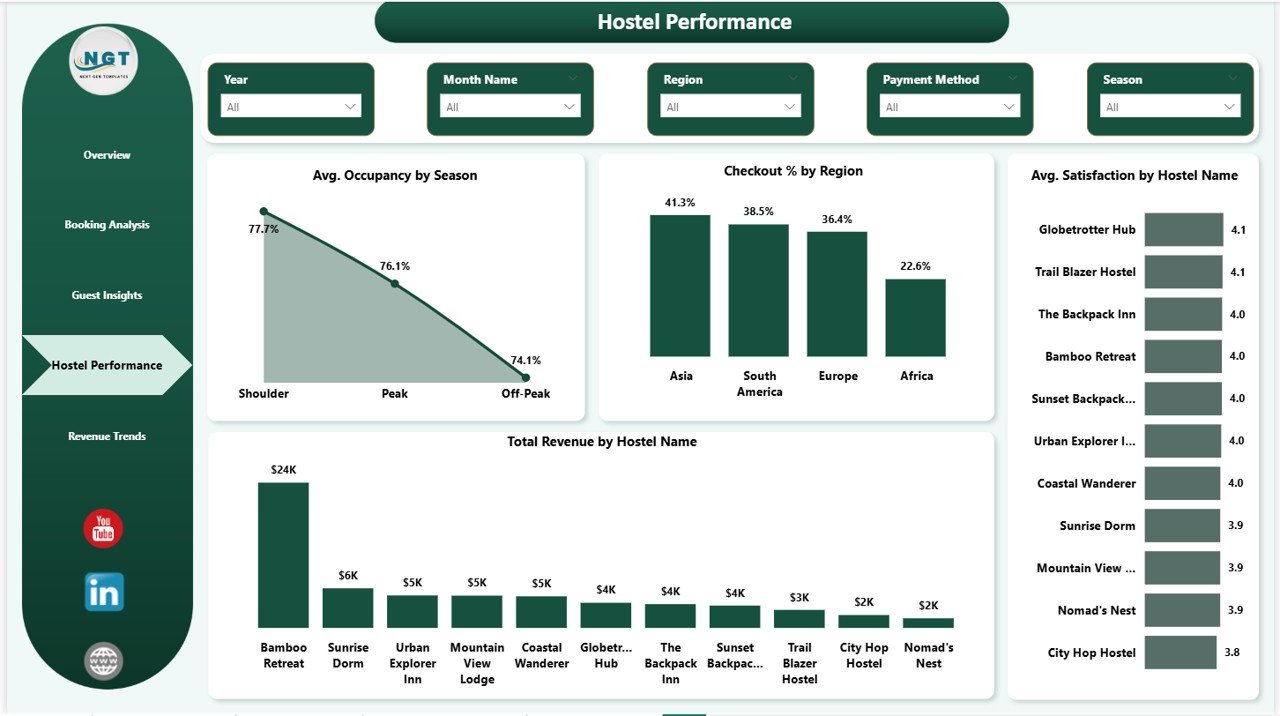
🏨 Multi-Hostel Performance Tracking – Compare multiple hostels and identify top-performing locations.
💰 Revenue Optimization Insights – Monitor seasonal trends and pricing strategies to maximize profitability.
⚡ Real-Time Data Analysis – Instantly update and visualize data using Power BI capabilities.
📂 What’s Inside the Backpacker Hostels Dashboard in Power BI
📁 Overview Page – Get a quick snapshot of your hostel with KPI cards and charts like Total Records by Season, Revenue by Month, Revenue by Region, and Checkout % by Room Type.
📁 Booking Analysis Page – Explore booking performance with insights on revenue by channel, cancellation rates, payment methods, and satisfaction levels.
📁 Guest Insights Page – Understand guest behavior through nationality trends, room preferences, occupancy patterns, and satisfaction scores.
📁 Hostel Performance Page – Compare hostel-wise performance using revenue, satisfaction, and occupancy metrics.
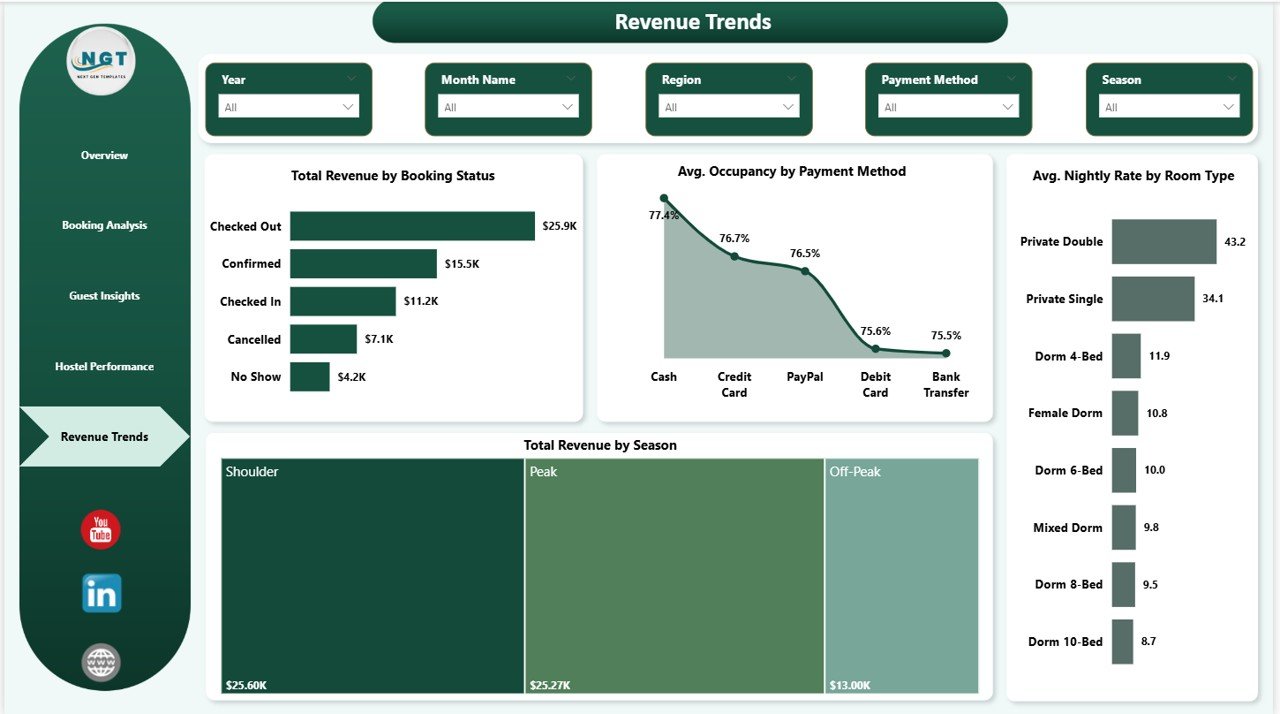
📁 Revenue Trends Page – Analyze financial performance with revenue by booking status, seasonal trends, nightly rates, and payment method impact.
📁 Dynamic Data Model – Structured data that allows seamless updates and accurate reporting.
⚙️ How to Use the Backpacker Hostels Dashboard in Power BI
🧩 Step 1: Load your dataset into Power BI Desktop.
🔄 Step 2: Refresh the data to update all visuals and KPIs instantly.
📊 Step 3: Use slicers and filters to explore specific insights.
📈 Step 4: Analyze trends and identify improvement areas.
🚀 Step 5: Take data-driven decisions to grow your hostel business.
This dashboard is designed for ease of use, even if you have only basic knowledge of Power BI.
👥 Who Can Benefit from This Backpacker Hostels Dashboard in Power BI
🏨 Hostel Owners & Managers who want better control over operations.
📊 Data Analysts looking for a ready-to-use Power BI solution.
🌍 Hospitality Professionals managing guest data and bookings.
💼 Business Owners aiming to improve performance and revenue.
📈 Consultants working with travel and accommodation businesses.


