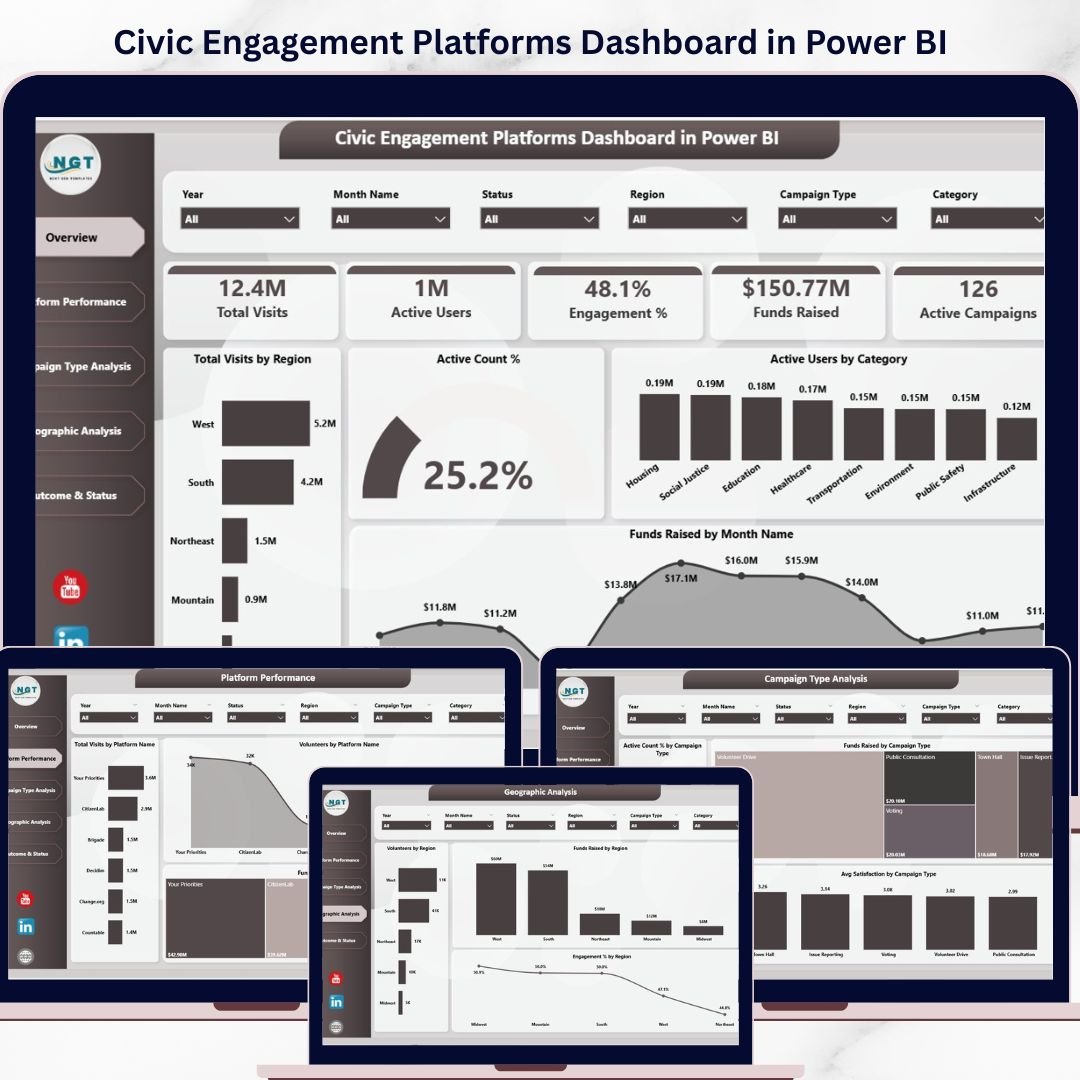
Key Features of Civic Engagement Platforms Dashboard in Power BI
Unlock the power of data with the Civic Engagement Platforms Dashboard in Power BI – a fully ready-to-use, interactive dashboard designed to help organizations analyze and optimize their civic engagement efforts. Simply update your data file, connect it to the Power BI file, and refresh to get instant, insightful analytics. This dashboard features multiple pages, each crafted to deliver critical insights into user engagement, campaign performance, fundraising, and geographic trends.
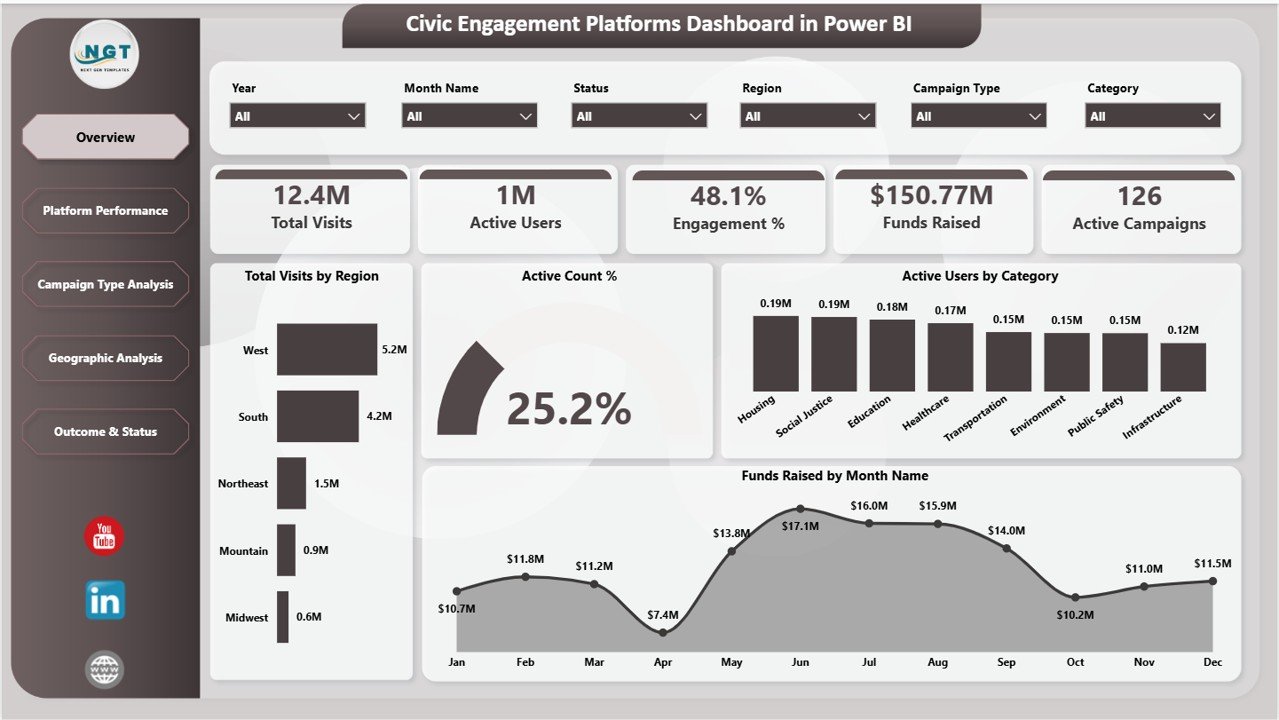
On the Overview Page, you’ll find high-level information displayed through intuitive cards such as Total Visits, Active Users, Engagement %, Funds Raised, and Active Campaigns. These KPIs give you a quick snapshot of your platform’s overall health. Supporting charts include Total Visits by Region, Active Count % in Active Users by Category, and Funds Raised by Month-each providing clear, actionable insights with easy-to-use slicers to filter data dynamically.
Civic Engagement Platforms Dashboard in Power BI
What’s Inside the Civic Engagement Platforms Dashboard in Power BI
This dashboard is divided into five powerful tabs, each designed to dissect your civic engagement data from different perspectives:
1. Overview Page: High-level KPIs and charts to track total visits, active users, engagement rates, funds raised, and active campaigns. Multiple slicers let you filter and drill down effortlessly.
2. Platform Performance: Analyze visits, volunteer counts, and funds raised by each platform. Easily identify which platforms drive the most engagement and donations.
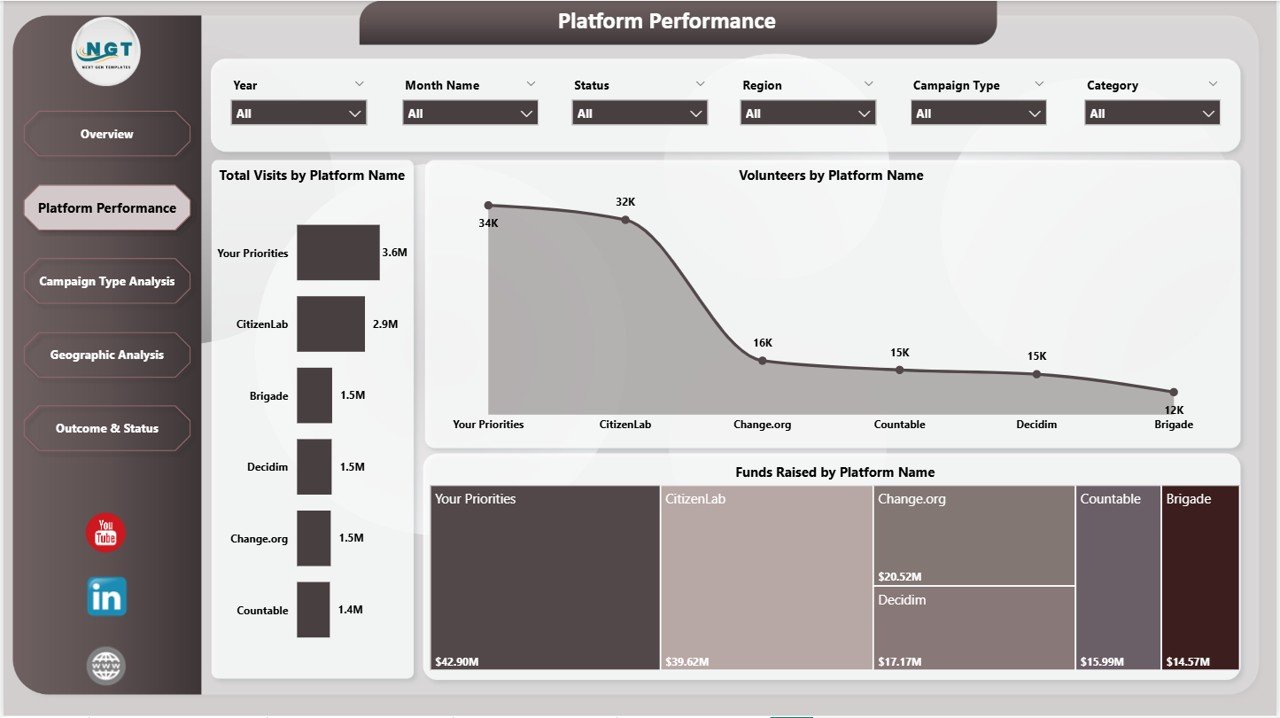
Platform Performance
3. Campaign Type Analysis: Dive into campaign performance metrics including active counts by campaign type, funds raised per campaign type, and average satisfaction scores, helping you optimize your campaigns.
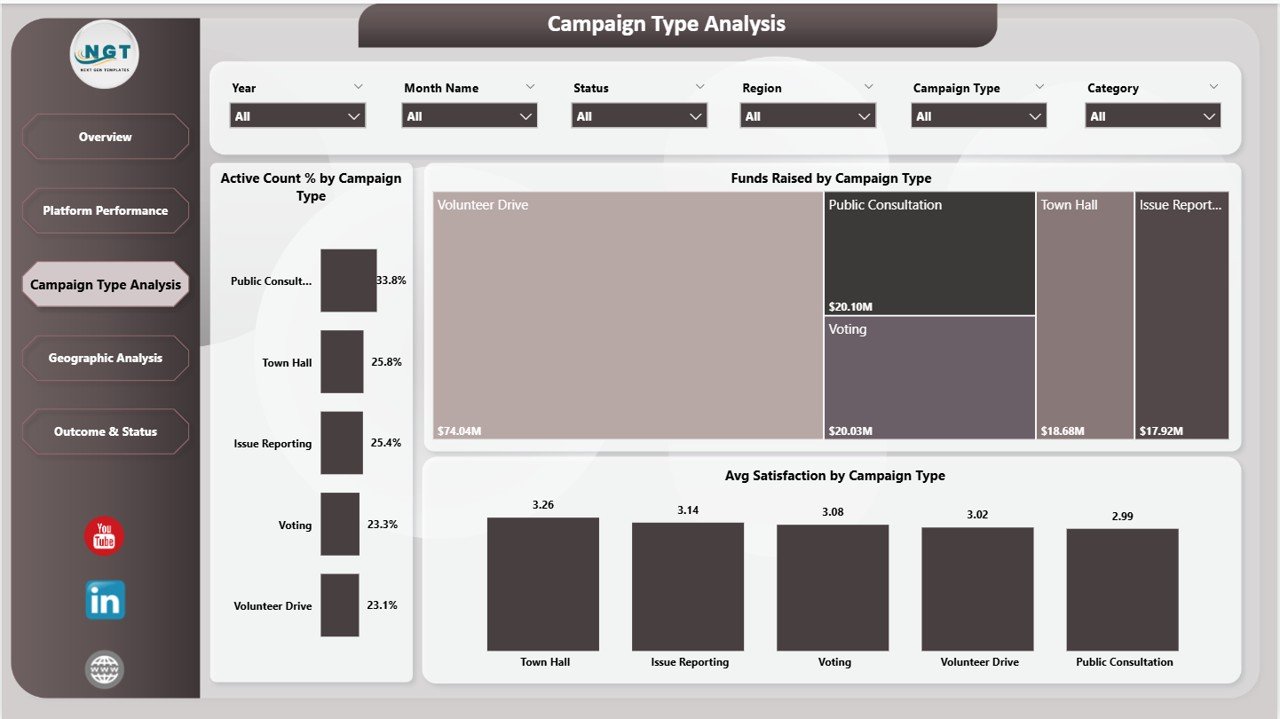
Campaign Type Analysis
4. Geographic Analysis: Visualize volunteer distribution, funds raised, and engagement percentages across different regions to target your efforts geographically.
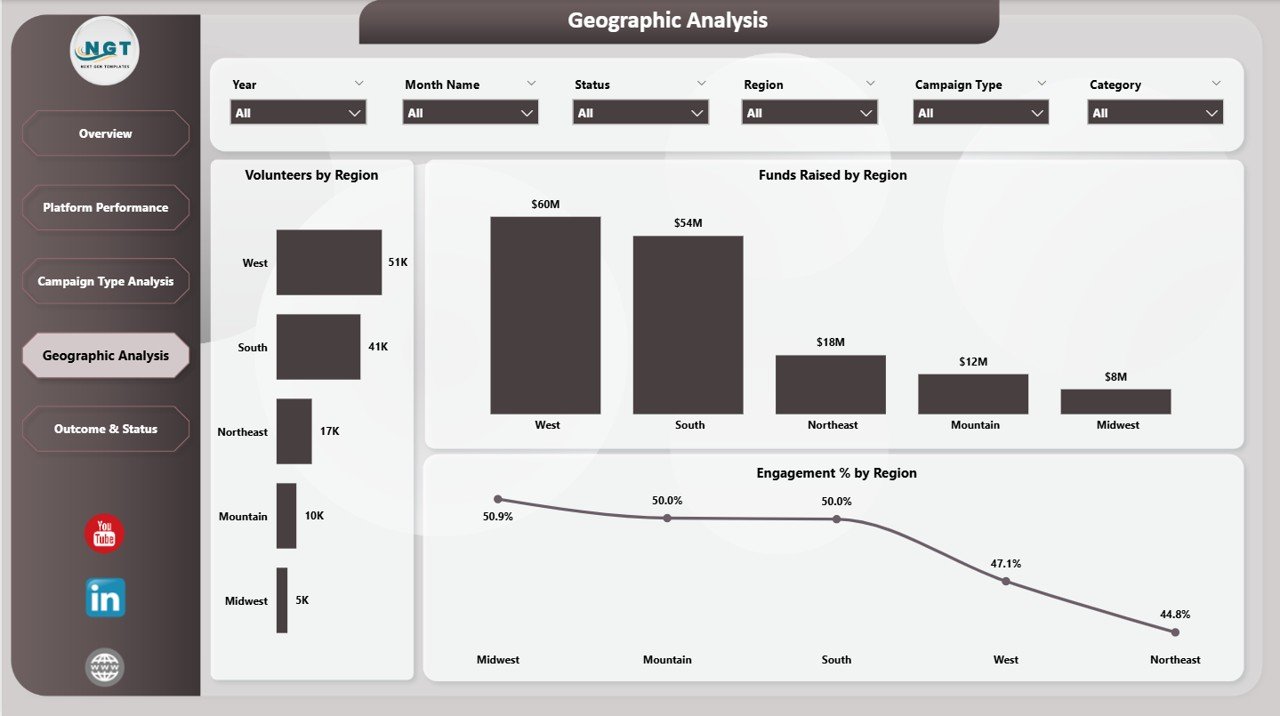
Geographic Analysis
5. Outcome & Status: Track monthly satisfaction averages, total visits, and successful campaign percentages by status to measure long-term impact and success rates.
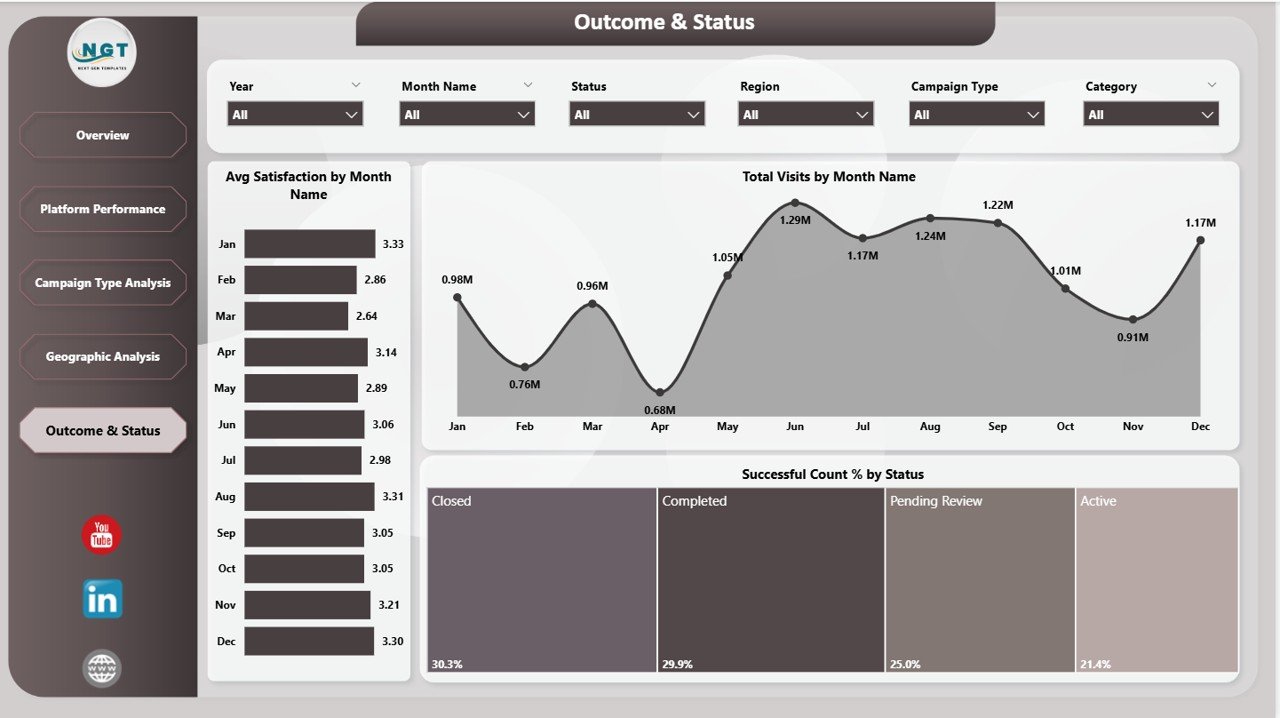
Outcome & Status
How to Use the Civic Engagement Platforms Dashboard in Power BI
Using this dashboard is straightforward and user-friendly. Simply update your data file with your latest civic engagement metrics, then connect it to the Power BI dashboard file. Once connected, navigate to the Home tab in Power BI and click Refresh. Your dashboard will automatically update to reflect your new data.
The multiple slicers enable you to filter data by region, platform, campaign type, and timeframe, allowing you to quickly analyze specific segments and uncover deep insights without needing advanced technical skills.
Whether you want to assess your overall engagement, compare platform effectiveness, or drill into campaign success, this dashboard provides a comprehensive, visual toolkit to empower your decision-making.
Who Can Benefit from This Civic Engagement Platforms Dashboard in Power BI
🎯 Nonprofit Organizations: Measure volunteer engagement, fundraising, and campaign success to optimize outreach and impact.
🎯 Civic Tech Platforms: Track platform usage, engagement levels, and regional performance to improve user experience and grow your community.
🎯 Campaign Managers: Analyze campaign types and outcomes to fine-tune strategies and maximize donations and participation.
🎯 Government Agencies: Monitor public engagement initiatives and allocate resources based on data-driven insights.
🎯 Data Analysts: Leverage a powerful, ready-made dashboard to accelerate analysis and reporting without building from scratch.
🎯 Fundraising Teams: Track funds raised by platform, region, and campaign type to identify top revenue sources and opportunities.
🎯 Volunteers & Coordinators: Understand volunteer distribution and activity trends for better resource planning and coordination.
🎯 Consultants & Strategists: Provide clients with actionable insights into civic engagement efforts backed by compelling visuals.
Click here to read the Detailed blog post.
Visit our YouTube channel to learn step-by-step video tutorials and maximize the value of your Civic Engagement Platforms Dashboard in Power BI.


Reviews
There are no reviews yet.