


🔑 Key Features of the Nonprofit Fundraising Dashboard in Power BI
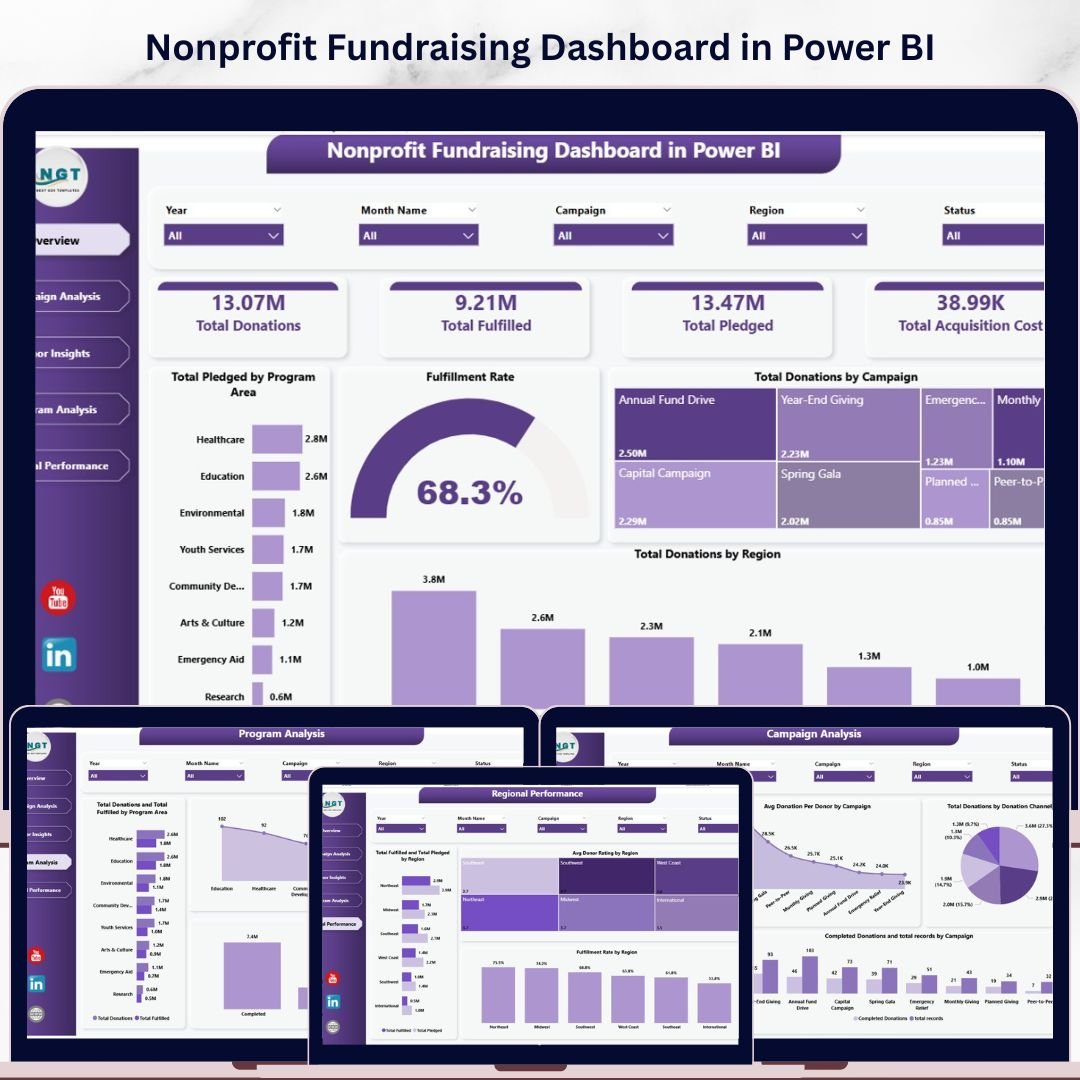
The Nonprofit Fundraising Dashboard in Power BI is a comprehensive analytics solution designed for nonprofit organizations, NGOs, and charitable foundations that need to track donations, monitor campaign performance, and analyze donor behavior across regions and programs. This Power BI dashboard template includes 5 interactive pages covering every aspect of fundraising operations — from high-level donation summaries to granular donor insights and regional performance breakdowns. It tracks key metrics including Total Donations, Total Fulfilled, Total Pledged, Total Records, Fulfillment Percentage, and Average Donor Rating, giving your team a 360-degree view of fundraising health.
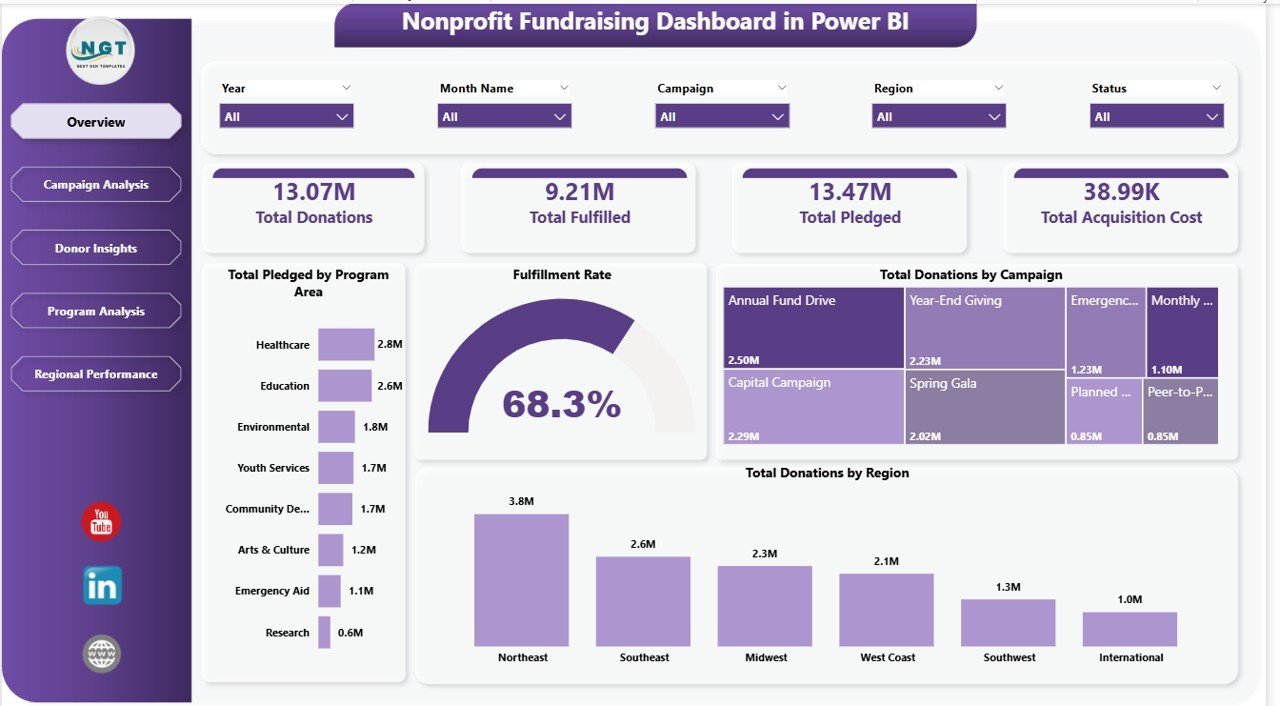
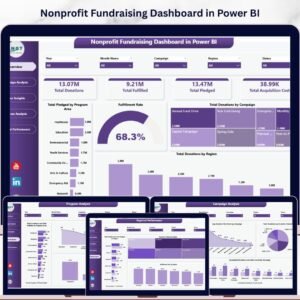
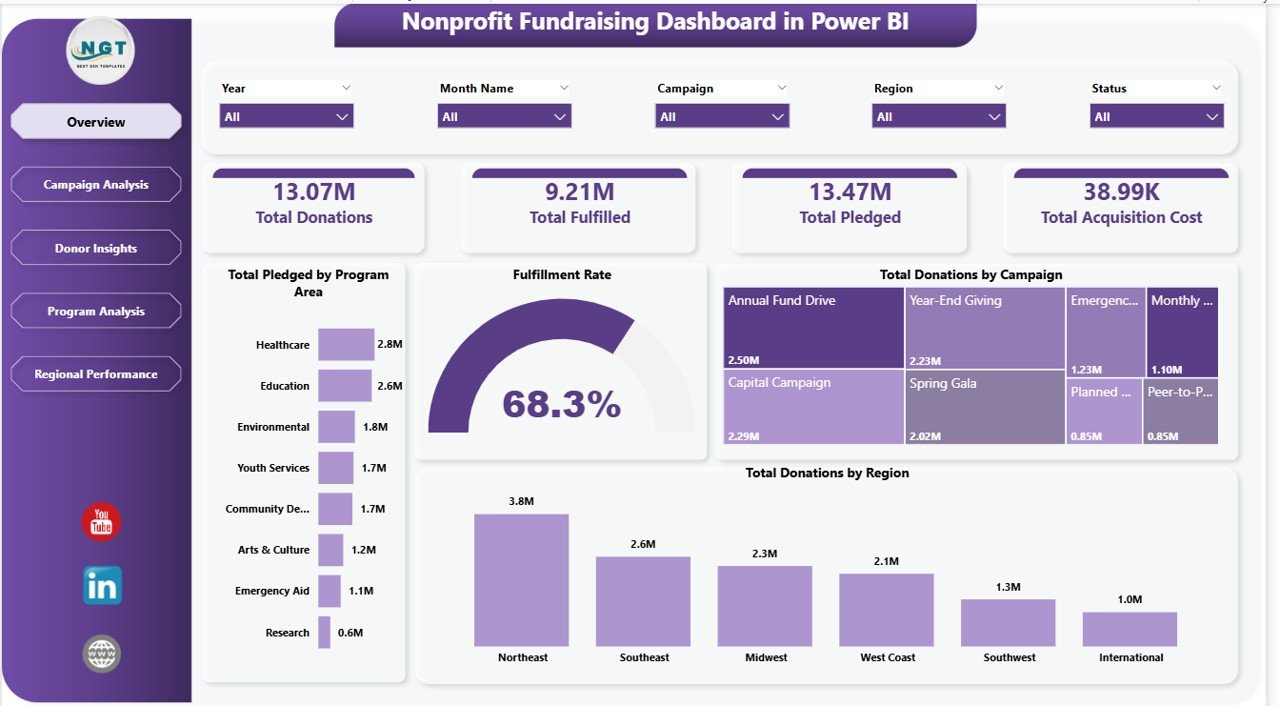 Nonprofit Fundraising Dashboard in Power BI
📦 What’s Inside the Nonprofit Fundraising Dashboard in Power BI
This template delivers 5 purpose-built dashboard pages, each packed with interactive visuals and slicers for quick filtering:
📍 Overview Page — Your fundraising command center displaying KPI cards for Total Donations, Total Fulfilled, Total Pledged, and Total Records. Interactive charts reveal Fulfillment Percentage, Total Donations by Region, and Total Donations by Campaign. Multiple slicers let you filter the entire dashboard instantly by campaign, region, date, or donor type.
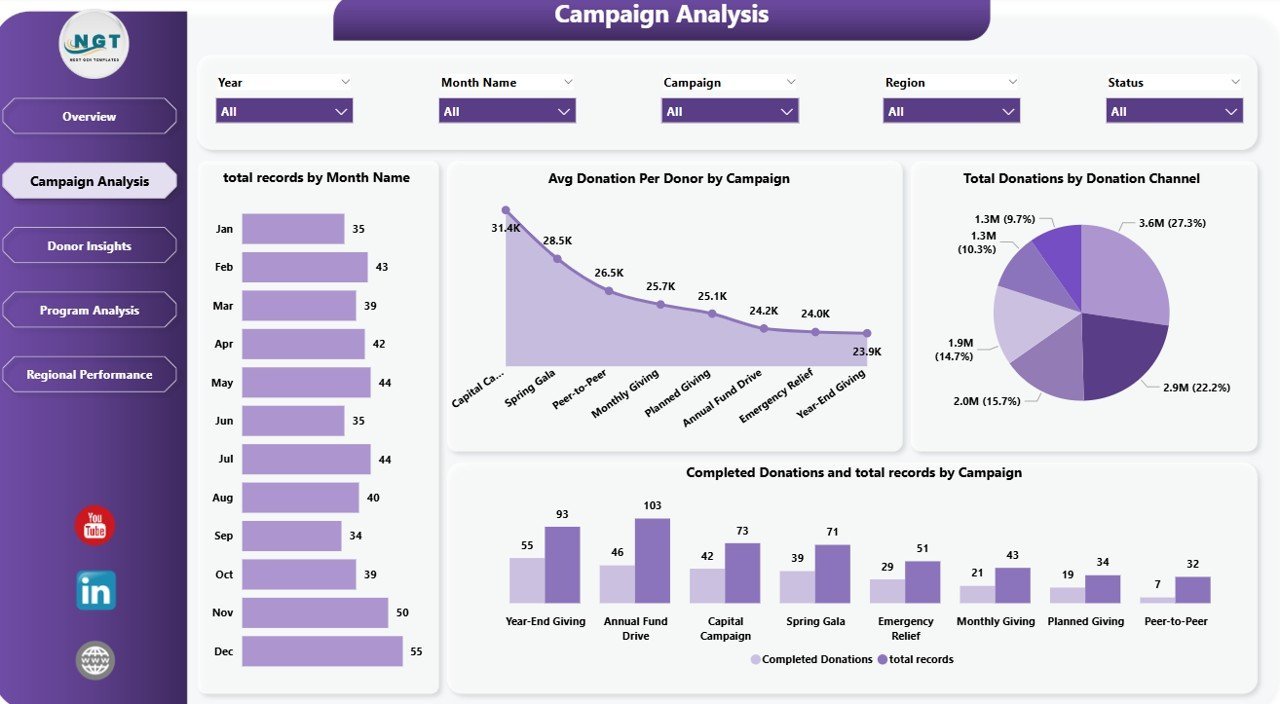
📍 Campaign Analysis — Deep-dive into campaign effectiveness with Total Records vs Completed Donations by Campaign, Average Donation Per Record by Campaign, Total Donations by Donation Channel, and Total Records by Month. Identify which campaigns drive the most donations and which channels perform best.
 Campaign Analysis
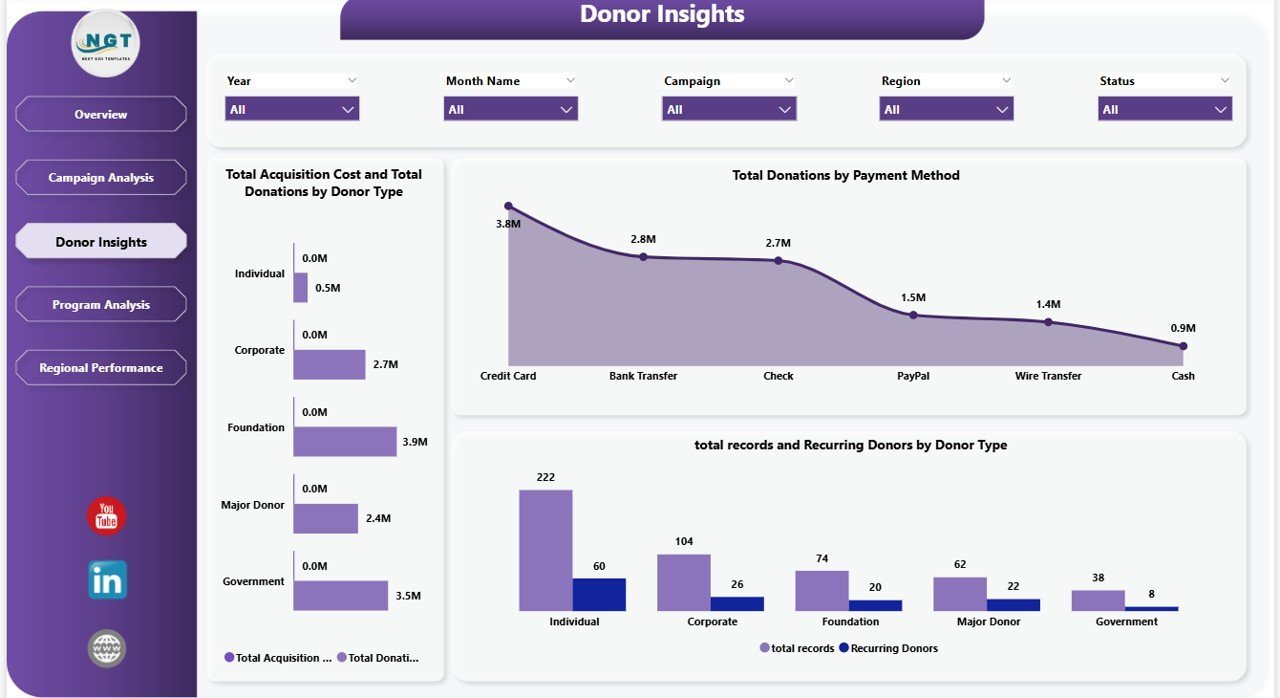
📍 Donor Insights — Understand your donor base with Total Donations vs Total Acquisition Cost by Donor Type, Total Records vs Recurring Donors by Donor Type, Total Donations by Payment Method, and Total Records by Region. See which donor segments are most valuable and cost-effective to acquire.
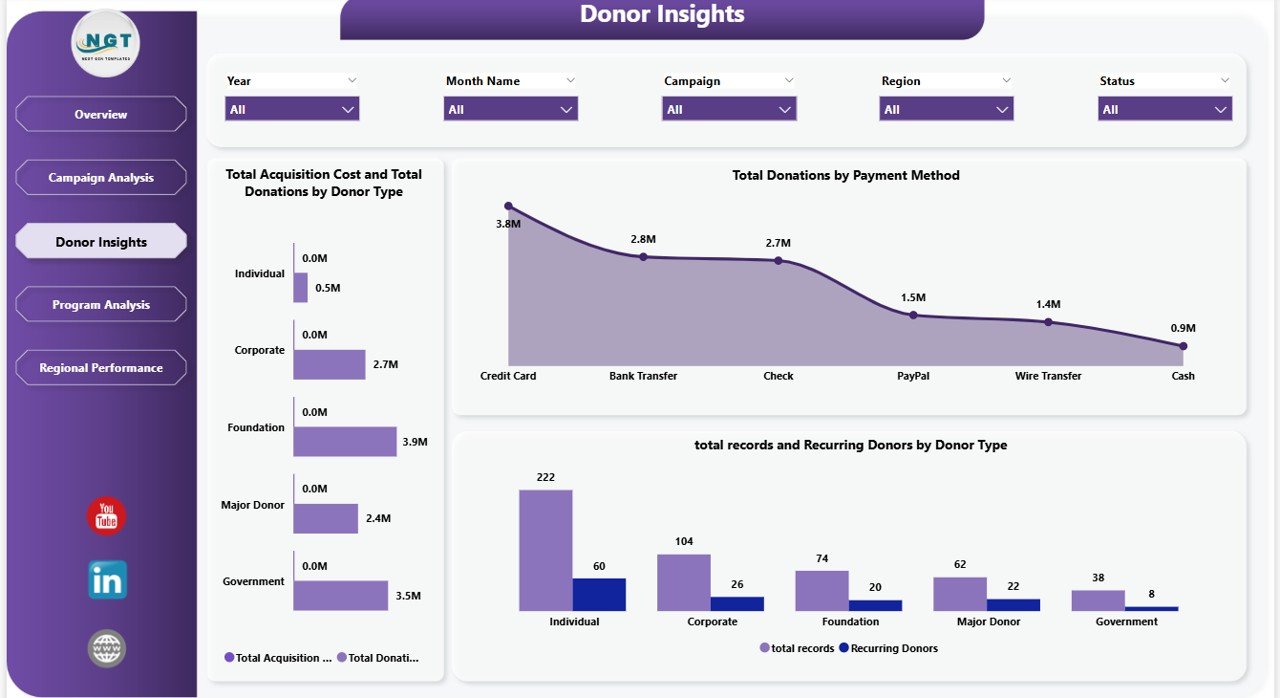 Donor Insights
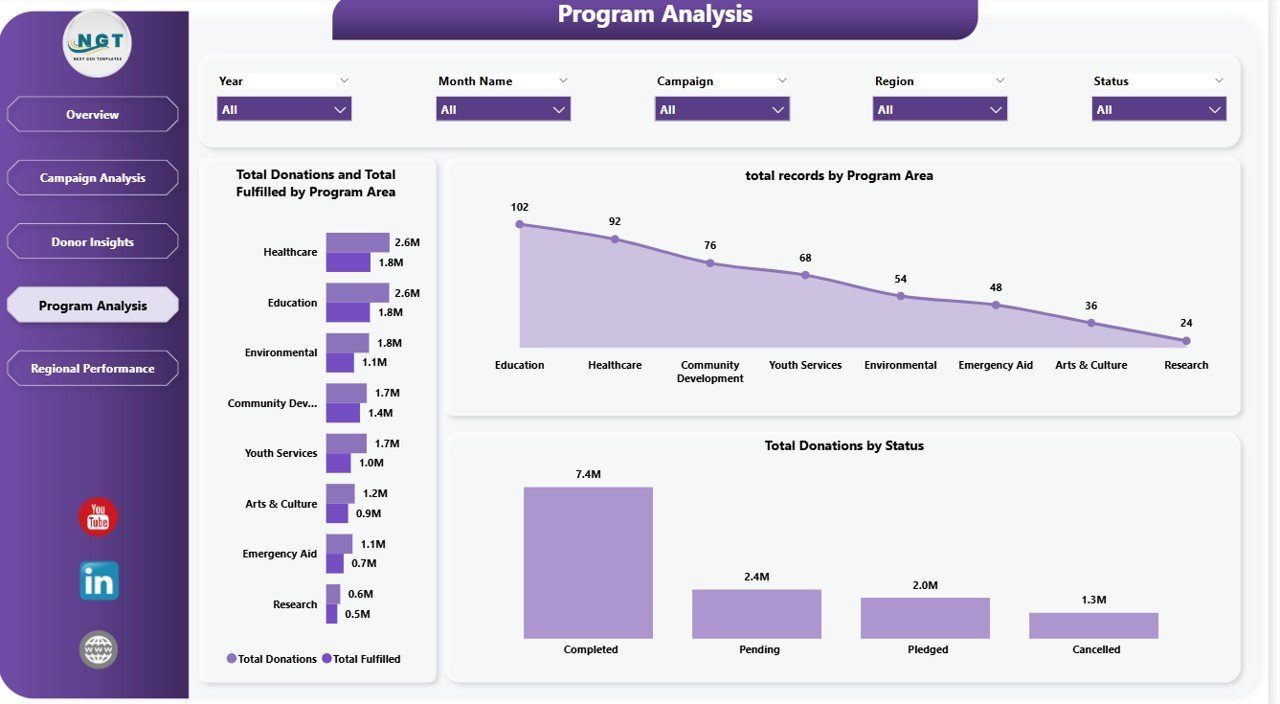
📍 Program Analysis — Evaluate program-level impact with Total Donations vs Total Fulfilled by Program Area, Total Records by Program Area, Total Donations by Status, and Total Donations vs Total Records by Recurring. Track which programs attract the most funding and have the highest fulfillment rates.
 Program Analysis
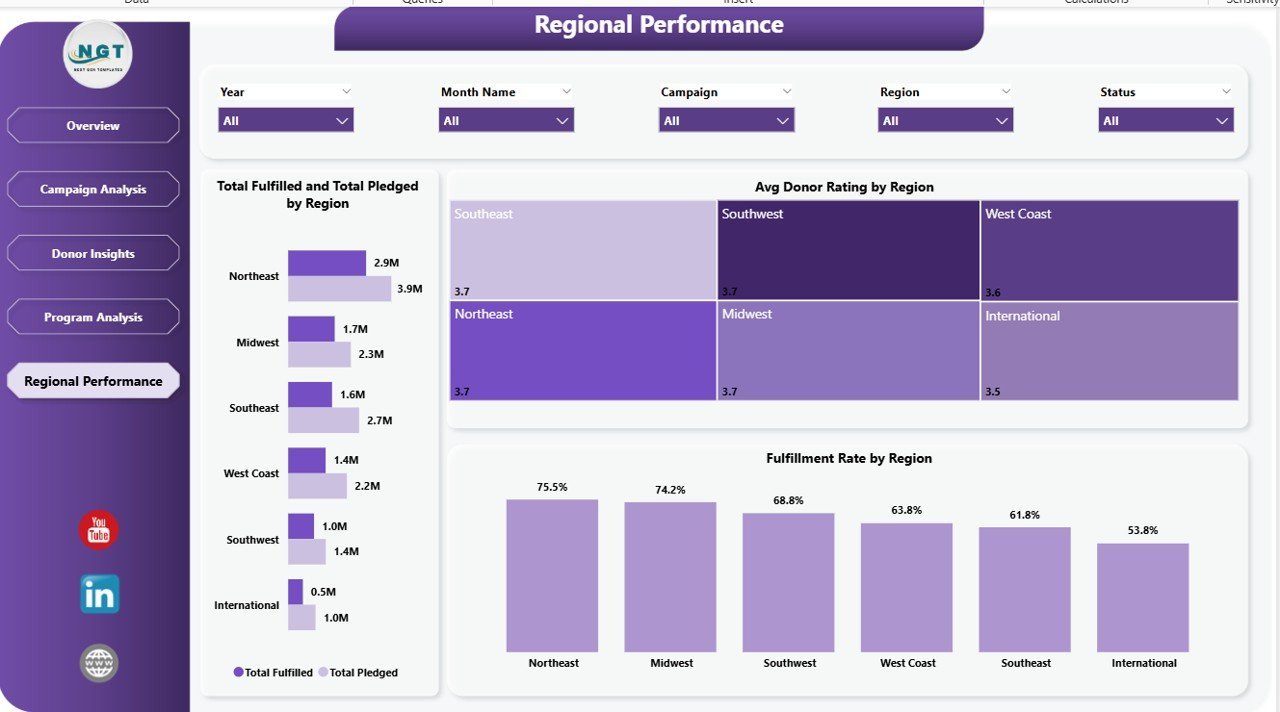
📍 Regional Performance — Compare geographic fundraising success with Total Fulfilled vs Total Pledged by Region, Average Donor Rating by Region, and Total Donations by Year. Discover which regions deliver the strongest fundraising results and donor satisfaction.
 Regional Performance
⚙️ How to Use the Nonprofit Fundraising Dashboard in Power BI
1️⃣ Download and unzip the file after purchase
2️⃣ Open the .pbix file in Power BI Desktop (free download from Microsoft)
3️⃣ Replace sample data with your organization’s fundraising data using your preferred data source
4️⃣ All charts, KPIs, and slicers update automatically to reflect your actual donations and campaigns
5️⃣ Publish to Power BI Service to share interactive reports with your board and stakeholders
👥 Who Can Benefit from This Dashboard
🔹 Nonprofit executives and board members tracking organizational fundraising performance
🔹 Development directors and fundraising managers monitoring campaign ROI
🔹 Grant writers and program managers analyzing funding by program area
🔹 Data analysts at charitable foundations building donor intelligence reports
🔹 NGO operations teams evaluating regional fundraising effectiveness
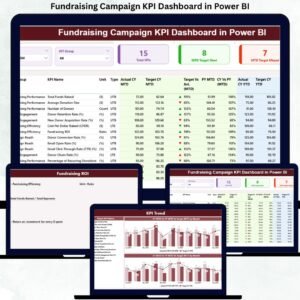
Looking for more nonprofit and fundraising templates? Browse our complete collection of Power BI Dashboard Templates or explore the Nonprofit Fundraising Dashboard in HTML and Nonprofit Fundraising Dashboard in Excel for alternative platforms. You may also find the Fundraising Campaign KPI Dashboard in Power BI and Nonprofit Organizations KPI Dashboard in Power BI useful for your organization.
❓ Frequently Asked Questions
What KPIs does the Nonprofit Fundraising Dashboard in Power BI track?
The dashboard tracks Total Donations, Total Fulfilled, Total Pledged, Total Records, Fulfillment Percentage, Average Donation Per Record, Average Donor Rating, and Acquisition Cost metrics across 5 interactive pages.
Do I need advanced Power BI skills to use this template?
No. The dashboard comes fully built with sample data. Simply connect your own data source and all visuals update automatically. Basic familiarity with Power BI Desktop is sufficient.
Can I customize the charts and filters in this fundraising dashboard?
Absolutely. Since this is a native .pbix file, you can modify any visual, add new charts, change colors, add calculated measures, or connect additional data sources using Power BI Desktop.
What is the best Power BI template for tracking nonprofit donations?
The Nonprofit Fundraising Dashboard in Power BI is specifically designed for donation tracking with dedicated pages for campaign analysis, donor insights, program-level funding, and regional performance comparison.
Can I share this dashboard with my board of directors?
Yes. Publish the dashboard to Power BI Service and share interactive reports with stakeholders through secure links or embed them in SharePoint or Teams.
🔗 Explore Related Templates
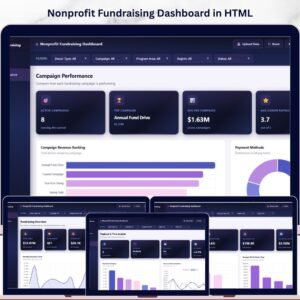
🔹 Nonprofit Fundraising Dashboard in HTML — Browser-based version with no software required
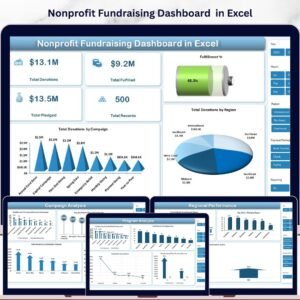
🔹 Nonprofit Fundraising Dashboard in Excel — Excel-powered alternative for teams without Power BI
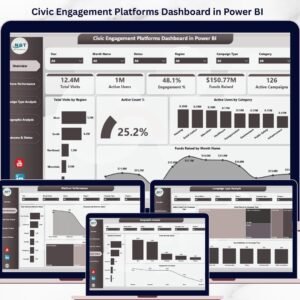
🔹 Civic Engagement Platforms Dashboard in Power BI — Track civic and community engagement metrics
📖 Click here to read the Detailed Blog Post about Nonprofit Fundraising Dashboard in Power BI
Watch the step-by-step video tutorial:
























Reviews
There are no reviews yet.