Take full control of your gas distribution operations today!
This powerful Power BI dashboard helps you track billing, revenue, costs, safety, and performance—all in one place. Stop relying on messy spreadsheets and start making smarter, faster decisions with real-time insights.
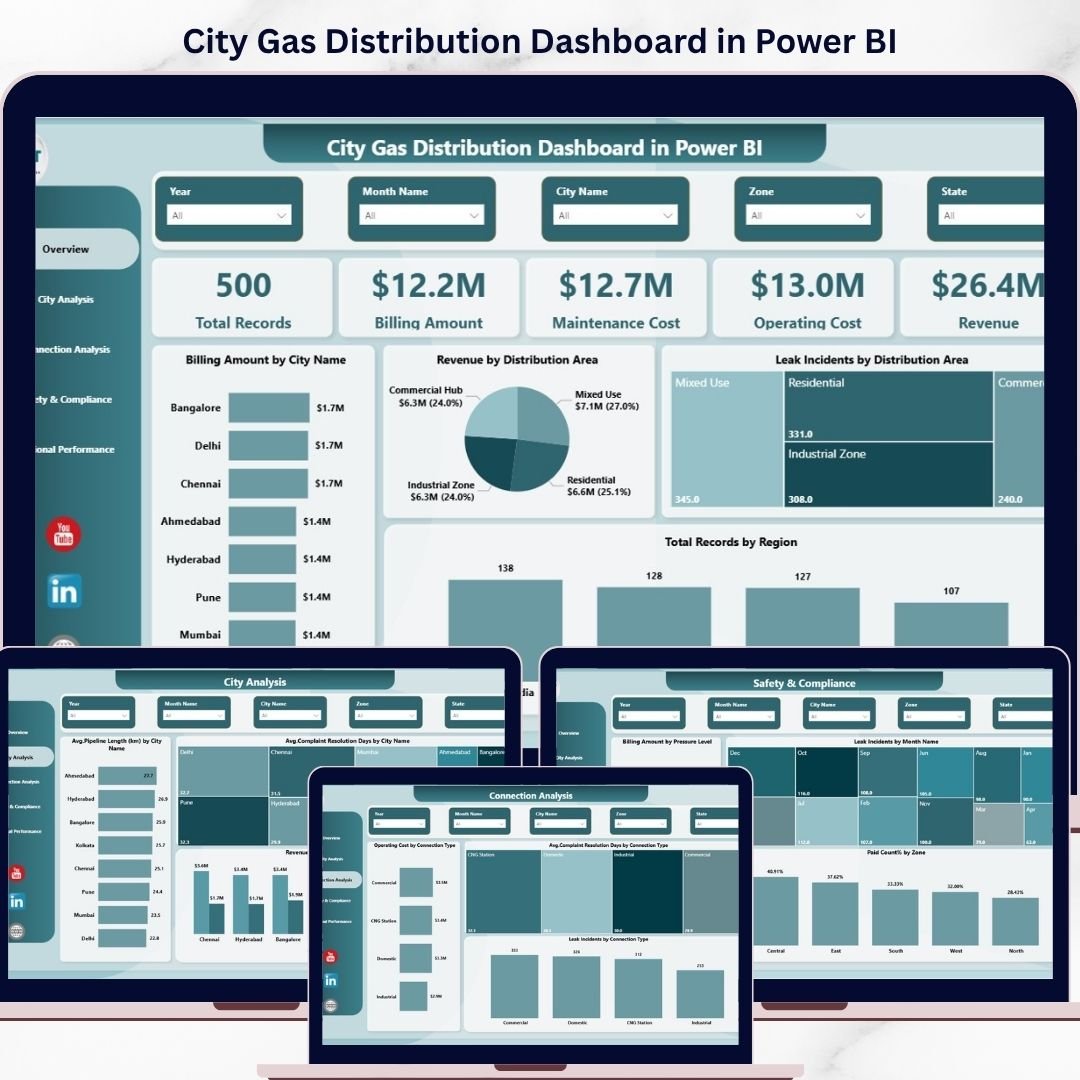
🔥 Key Features of City Gas Distribution Dashboard in Power BI
✨ Interactive 5-Page Dashboard
Analyze operations across multiple dimensions with well-structured and dynamic report pages.
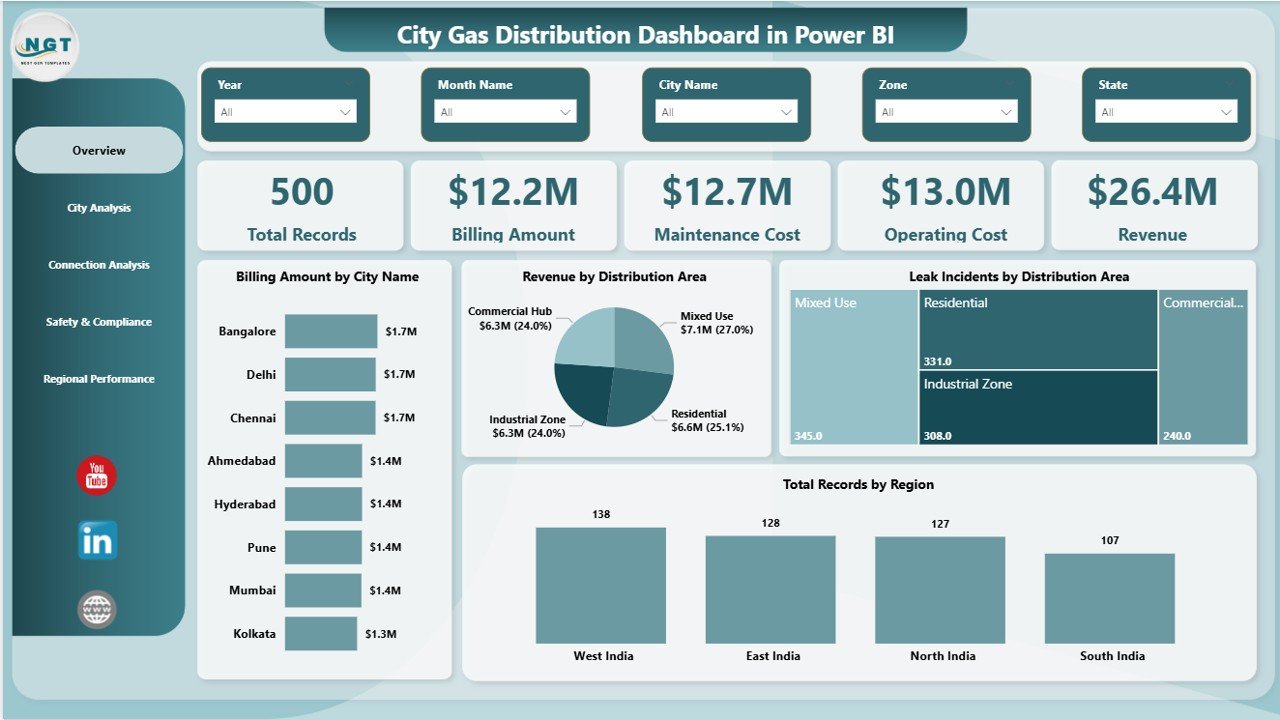
📊 Real-Time KPI Monitoring
Track billing amount, revenue, maintenance cost, operating cost, and total records instantly.
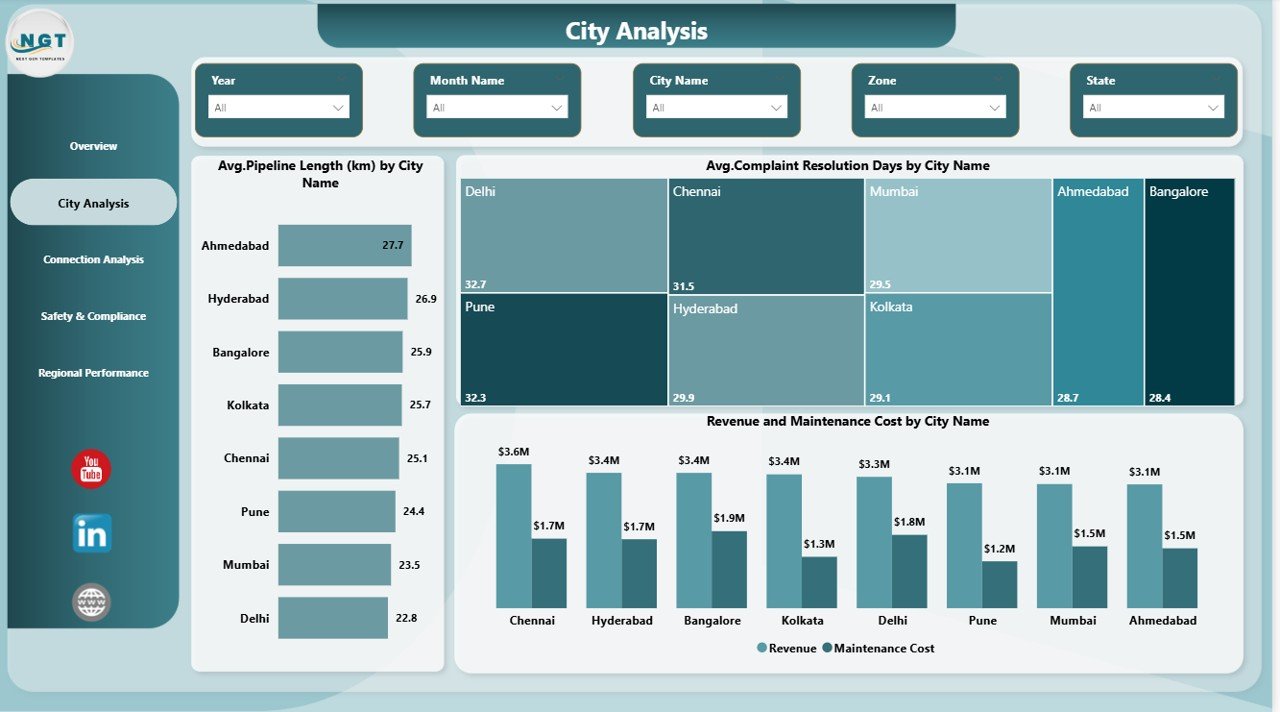
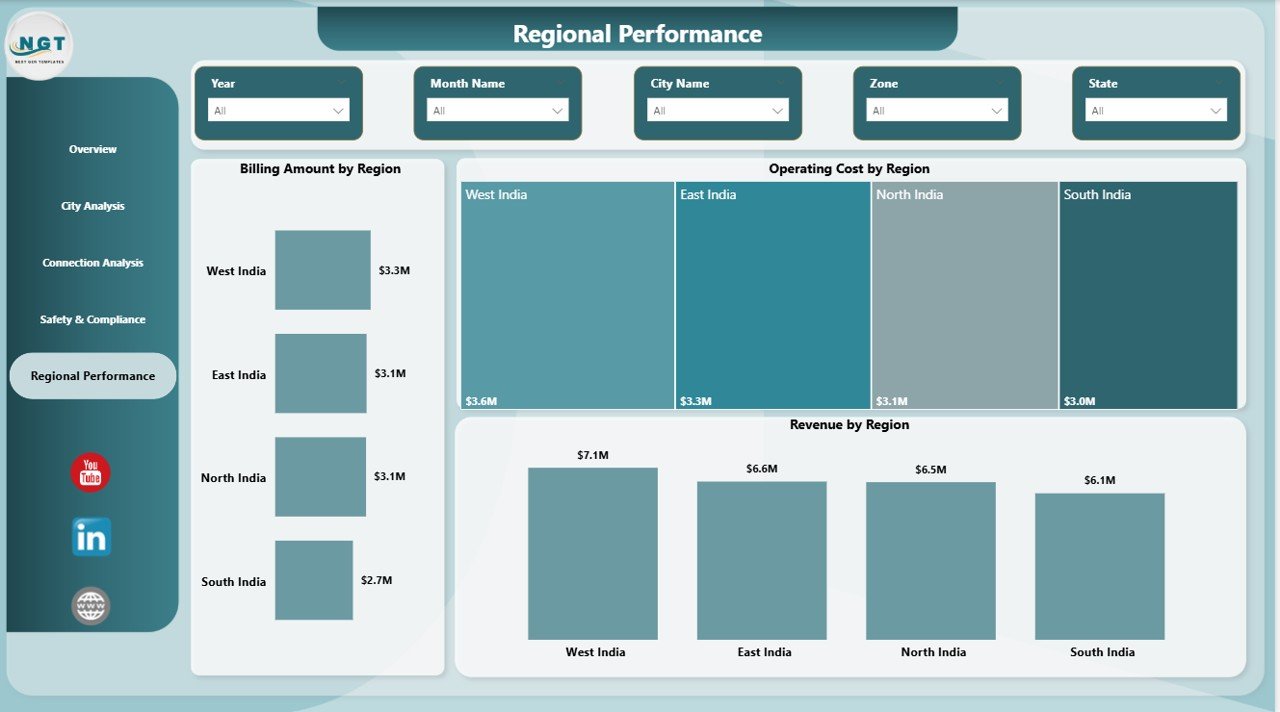
🌍 City & Regional Insights
Compare performance across cities and regions to identify top-performing and underperforming areas.
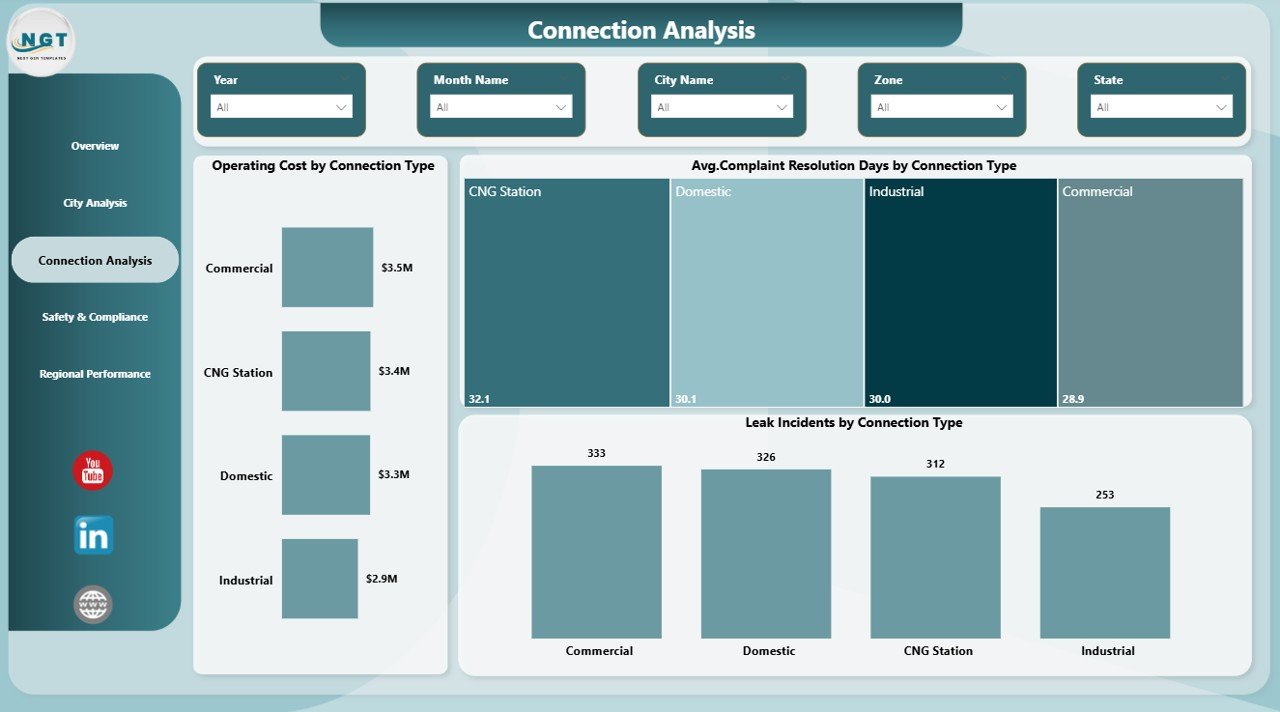
🔧 Operational Cost Analysis
Monitor maintenance and operating costs by connection type and region to optimize expenses.
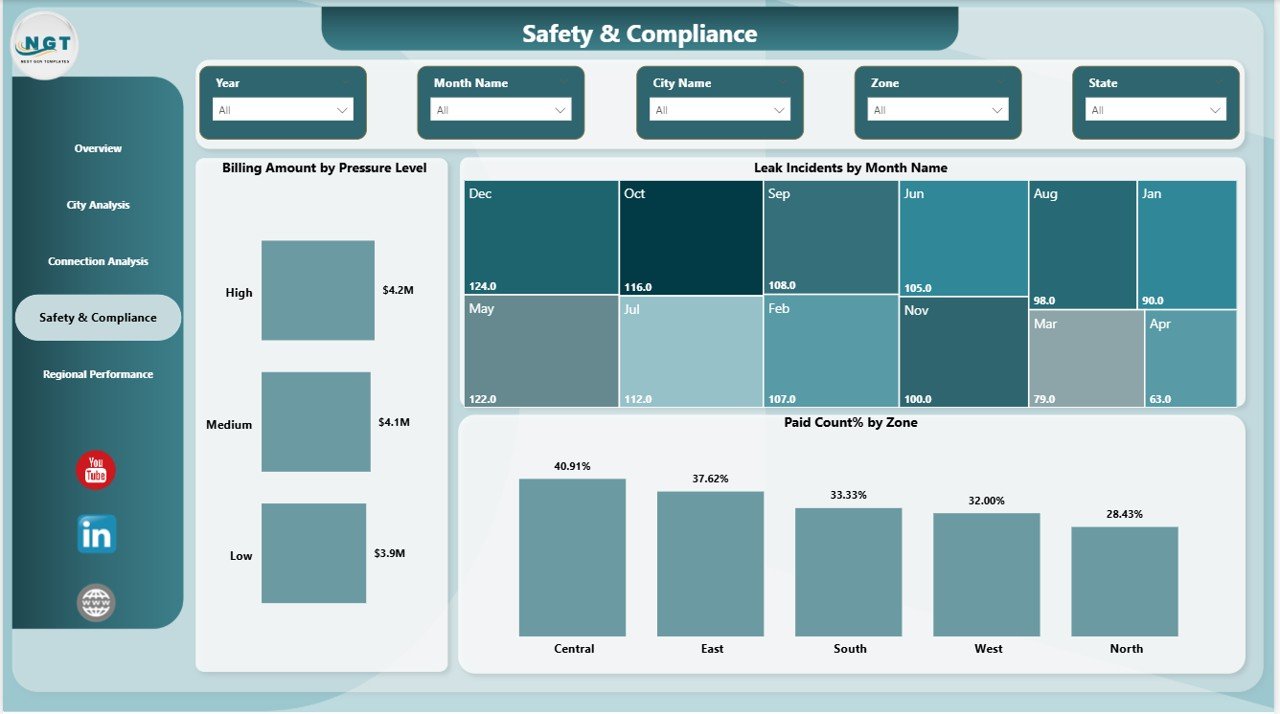
🚨 Safety & Compliance Tracking
Analyze leak incidents, pressure levels, and compliance metrics to reduce operational risks.
📈 Trend & Performance Analysis
Identify patterns and trends over time for better forecasting and planning.
🎯 User-Friendly Slicers
Filter data by city, region, and time period for quick and focused analysis.
📦 What’s Inside the City Gas Distribution Dashboard in Power BI
📁 Power BI Dashboard File (.pbix)
Fully designed and ready-to-use interactive dashboard.
📊 5 Detailed Report Pages
✔️ Overview Page – KPI cards and performance snapshot
✔️ City Analysis – City-wise efficiency and service insights
✔️ Connection Analysis – Performance by connection type
✔️ Safety & Compliance – Risk and safety monitoring
✔️ Regional Performance – Region-wise comparison
📂 Structured Data Model
Clean and organized data format for easy updates.
🧩 Interactive Visuals & Charts
Professionally designed visuals for better understanding and decision-making.
⚙️ How to Use the City Gas Distribution Dashboard in Power BI
🟢 Step 1: Upload your data into Excel or your preferred data source
🟢 Step 2: Connect the dataset to Power BI
🟢 Step 3: Refresh the dashboard
🟢 Step 4: Use slicers to filter insights
🟢 Step 5: Analyze KPIs, trends, and charts
👉 No advanced technical skills required—this dashboard is beginner-friendly and easy to use.
👥 Who Can Benefit from This City Gas Distribution Dashboard?
🏢 Gas Distribution Companies
📊 Utility & Operations Managers
🛠️ Maintenance & Engineering Teams
🚨 Safety & Compliance Officers
💰 Financial Analysts
👉 Whether you manage a single city or multiple regions, this dashboard helps you stay in control.
💡 Why This Dashboard is a Game-Changer
Managing gas distribution data manually can lead to delays, errors, and missed opportunities. However, this dashboard transforms your data into actionable insights.
✔️ Make faster, data-driven decisions
✔️ Reduce leak risks and improve safety
✔️ Optimize operational and maintenance costs
✔️ Improve billing efficiency and revenue tracking
✔️ Enhance customer service and response time
👉 As a result, you improve efficiency, profitability, and overall performance.
📝 Conclusion
The City Gas Distribution Dashboard in Power BI is your all-in-one solution for managing complex gas distribution operations. It simplifies data, improves visibility, and empowers you to take control of your business.
If you want to modernize your operations and stay ahead in the energy sector, this dashboard is a must-have tool.
Click here to read the Detailed blog post
Watch the step-by-step video tutorial:


