Are you struggling to track revenue, user engagement, and content performance for your streaming platform? Managing scattered data can slow down your growth and decision-making.
👉 Introducing the Video-on-Demand (VoD) Dashboard in Power BI – a powerful, all-in-one solution designed to transform your streaming data into actionable insights instantly.
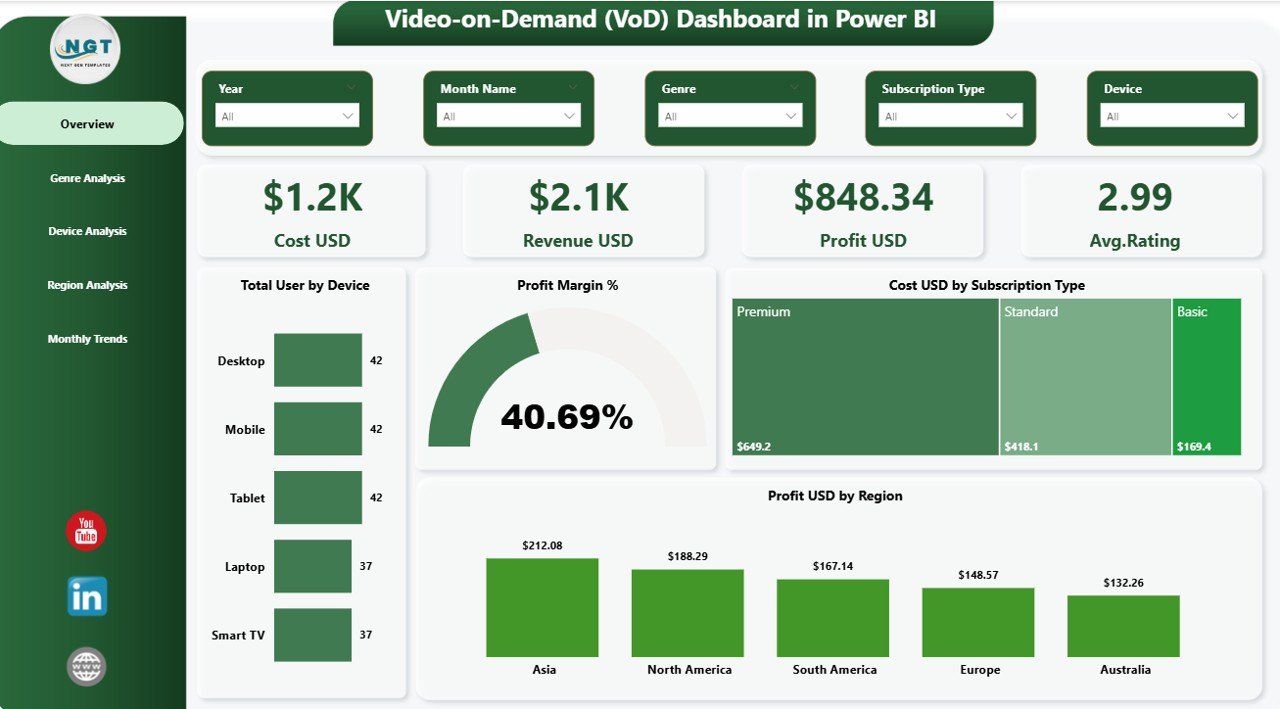
This interactive dashboard helps you monitor key metrics like revenue, cost, profit, user behavior, and content performance in one centralized place. Moreover, it converts complex datasets into simple, visually appealing reports so you can make smarter business decisions faster.
Whether you are managing a small streaming platform or a large VoD business, this dashboard gives you complete visibility into your operations.
🚀 Key Features of Video-on-Demand (VoD) Dashboard in Power BI
✨ Interactive 5-Page Dashboard – Analyze your data across Overview, Genre, Device, Region, and Monthly Trends
📊 Powerful KPI Cards – Track Cost, Revenue, Profit, and Average Rating instantly
📱 User Behavior Insights – Understand how users engage across different devices
🎬 Content Performance Analysis – Identify top-performing genres and optimize your content strategy
🌍 Regional Insights – Discover high-performing markets and improve targeting
📅 Monthly Trend Analysis – Monitor growth patterns and seasonal performance
🎯 Dynamic Filters (Slicers) – Drill down into data for deeper insights
⚡ Real-Time Data Visualization – Make quick, data-driven decisions
📦 What’s Inside the Video-on-Demand (VoD) Dashboard in Power BI
This ready-to-use Power BI template includes everything you need to analyze your VoD business effectively:
📊 Overview Page – Get a complete snapshot with KPIs and performance charts
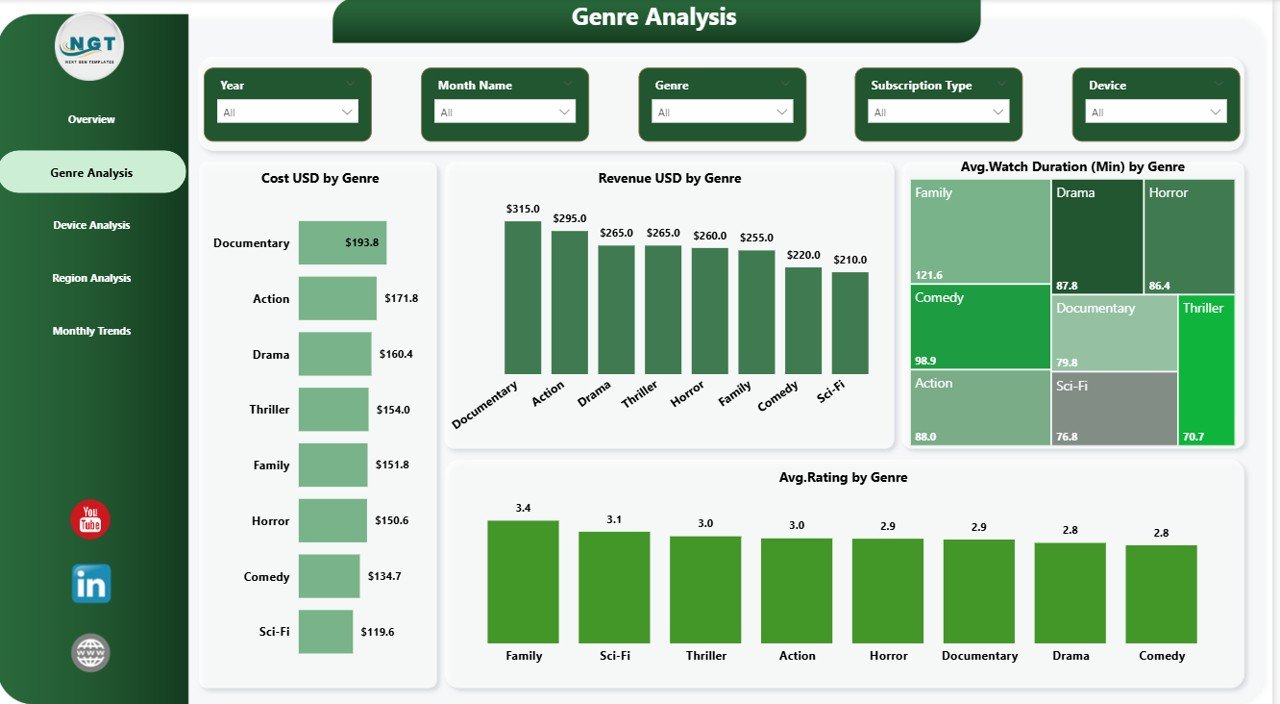
🎬 Genre Analysis Page – Evaluate content performance by genre
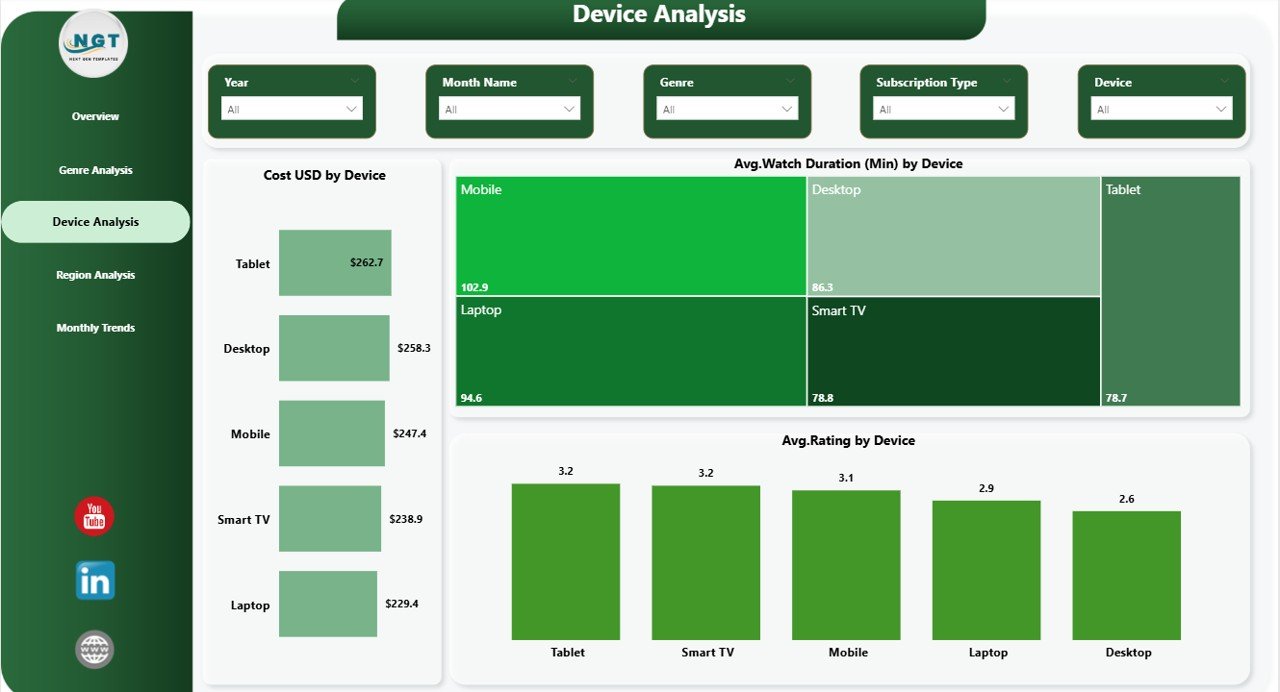
📱 Device Analysis Page – Analyze viewing behavior across devices
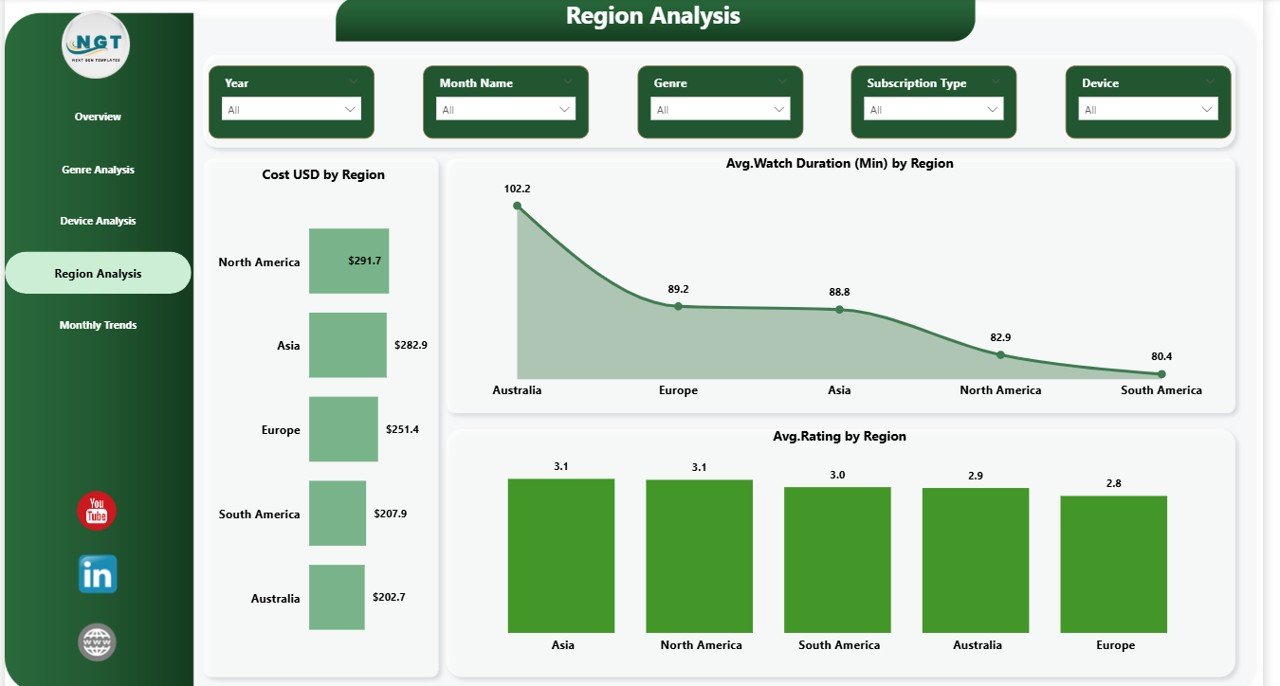
🌍 Region Analysis Page – Track audience engagement by location
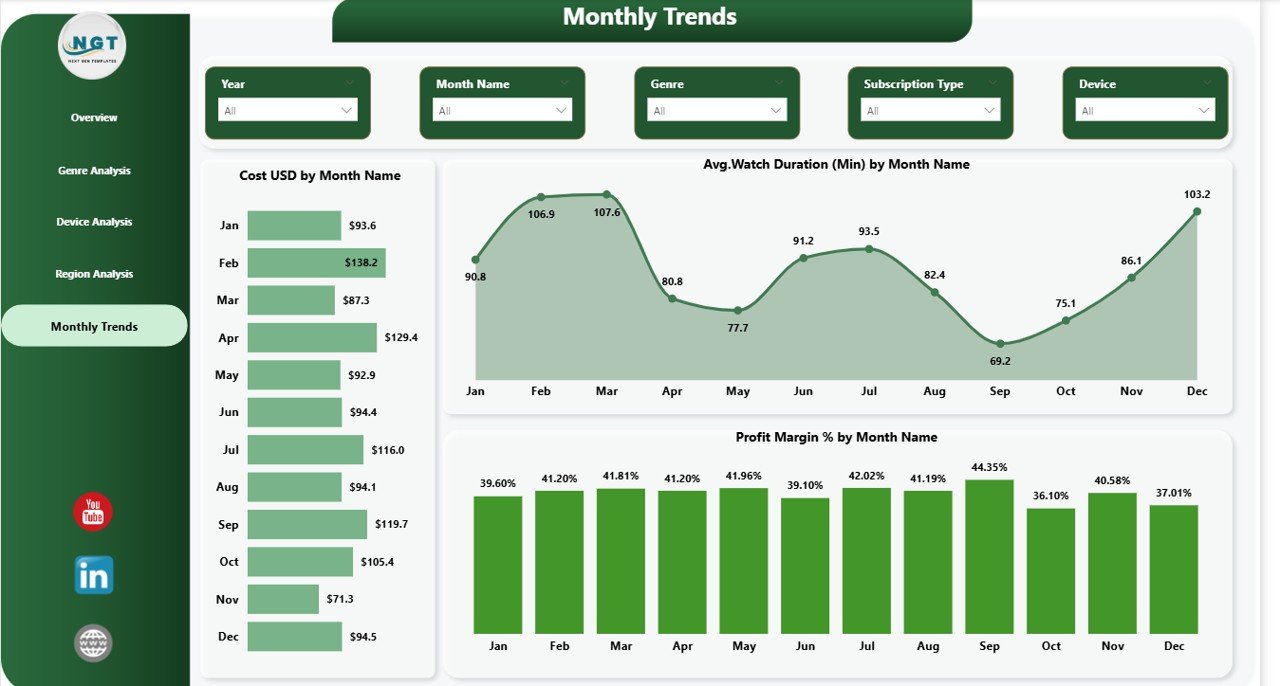
📅 Monthly Trend Page – Understand performance trends over time
Additionally, the dashboard comes with fully interactive visuals, slicers, and structured data models to ensure smooth performance and easy customization.
⚙️ How to Use the Video-on-Demand (VoD) Dashboard in Power BI
Using this dashboard is simple and efficient:
1️⃣ Import Your Data – Load your VoD data into Power BI
2️⃣ Clean & Transform Data – Structure your dataset for analysis
3️⃣ Refresh the Dashboard – Instantly update all visuals
4️⃣ Use Filters & Slicers – Drill down into specific insights
5️⃣ Analyze & Decide – Take data-driven actions to improve performance
👉 Within minutes, you can turn raw data into meaningful insights.
👥 Who Can Benefit from This Video-on-Demand (VoD) Dashboard in Power BI
This dashboard is designed for multiple professionals:
👨💼 Business Owners – Monitor revenue, profit, and overall performance
🎬 Content Teams – Identify popular genres and plan better content
📢 Marketing Teams – Target the right audience and regions
📊 Data Analysts – Perform deep analysis with interactive visuals
💻 Tech Teams – Optimize platform performance across devices
👉 In short, anyone involved in streaming analytics can benefit from this powerful tool.
With its intuitive design and advanced analytics capabilities, this dashboard helps you improve decision-making, enhance user experience, and boost profitability.
So, if you want to scale your Video-on-Demand business and stay ahead of the competition, this dashboard is your ultimate solution.
Click here to read the Detailed blog post
Watch the step-by-step video tutorial: