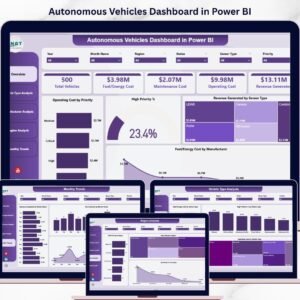
Are you struggling to manage autonomous vehicle data, track operational costs, and monitor fleet performance in real time? Feeling overwhelmed with scattered reports and complex datasets?
👉 It’s time to take control of your fleet with powerful data insights!
Introducing the Autonomous Vehicles Dashboard in Power BI — a dynamic, interactive, and ready-to-use solution designed to help you monitor vehicle performance, optimize costs, and improve decision-making—all in one centralized dashboard.
This advanced dashboard transforms complex fleet data into clear, actionable insights. Whether you want to track fuel/energy costs, analyze maintenance expenses, or monitor revenue trends, everything becomes simple and visually engaging. As a result, you can make faster, smarter, and data-driven decisions that boost efficiency and profitability.
🚀 Key Features of Autonomous Vehicles Dashboard in Power BI
✨ 🚗 Real-Time Fleet Monitoring – Track vehicles, costs, and performance instantly.
✨ 💰 Cost Analysis Dashboard – Monitor fuel/energy, maintenance, and operating expenses.
✨ 📊 Interactive Visuals – Use slicers and filters to drill down into data.
✨ 🏭 Manufacturer Performance Insights – Compare efficiency across vehicle manufacturers.
✨ 🌍 Region-Based Analytics – Analyze fleet performance across different locations.
✨ 🚘 Vehicle Type Analysis – Identify high-performing and cost-efficient vehicles.
✨ 📅 Monthly Trend Analysis – Track performance patterns over time.
✨ ⚡ User-Friendly Interface – Clean, intuitive, and easy to navigate.
✨ 🔄 Real-Time Data Capability – Stay updated with the latest business metrics.
📦 What’s Inside the Autonomous Vehicles Dashboard in Power BI
This dashboard includes 5 powerful and fully interactive analysis pages designed for complete fleet analytics:

📊 Overview Page – Get a high-level snapshot with KPIs like Total Vehicles, Fuel/Energy Cost, Maintenance Cost, Operating Cost, and Revenue Generated.
🚘 Vehicle Type Analysis – Compare performance across different vehicle categories to identify efficiency.
🏭 Manufacturer Analysis – Evaluate performance and cost metrics across manufacturers.
🌍 Region Analysis – Understand geographical performance and identify improvement areas.
📅 Monthly Trends Page – Monitor cost, revenue, and fleet growth trends over time.
Additionally, you get:
✔️ Fully interactive Power BI visuals
✔️ Easy-to-use slicers for filtering
✔️ Clean and structured data model
✔️ Ready-to-use professional layout
⚙️ How to Use the Autonomous Vehicles Dashboard in Power BI
Using this dashboard is simple—even if you are not a technical expert.
1️⃣ Import your dataset into Power BI
2️⃣ Refresh the data regularly
3️⃣ Use slicers to filter by region, vehicle type, or manufacturer
4️⃣ Explore each dashboard page for insights
5️⃣ Take data-driven actions to optimize performance
👉 Within minutes, you can convert complex data into meaningful insights.
🎯 Who Can Benefit from This Autonomous Vehicles Dashboard in Power BI
This dashboard is designed for professionals across the automotive and mobility sector:
🚗 Fleet Managers – Monitor performance and reduce operational costs
📊 Data Analysts – Generate insights and analyze trends quickly
🏢 Automotive Companies – Improve operational efficiency
🚀 Autonomous Vehicle Startups – Track growth and performance
💼 Business Owners – Make smarter, data-driven decisions
👉 Whether you manage a small fleet or a large operation, this dashboard empowers you with actionable insights.
💡 This is not just a dashboard—it’s your fleet intelligence system.
Because with the right insights:
✔️ You reduce costs
✔️ You improve fleet utilization
✔️ You optimize maintenance strategies
✔️ You increase profitability
🔗 Click here to read the Detailed blog post
🎥 Visit our YouTube channel to learn step-by-step video tutorials:
👉 https://www.youtube.com/@PKAnExcelExpert
Watch the step-by-step video tutorial:
Compatibility and Requirements
- Works in Power BI Desktop, which is free to download from Microsoft.
- You import your own fleet dataset and refresh it in Power BI. Microsoft explains the install in Get Power BI Desktop.
Frequently Asked Questions
How many pages does the dashboard have?
Five pages: Overview, Vehicle Type Analysis, Manufacturer Analysis, Region Analysis and Monthly Trends.
Which KPIs show on the Overview page?
Total Vehicles, Fuel/Energy Cost, Maintenance Cost, Operating Cost and Revenue Generated.
Can I filter the data?
Yes. Slicers let you filter by region, vehicle type or manufacturer, and every page updates with your selection.
How do I load my own data?
Import your dataset into Power BI and refresh it regularly. The dashboard pages then update from your data.
Is there an Excel or Google Sheets version?
Yes. See the Autonomous Vehicles Dashboard in Excel and the Autonomous Vehicle KPI Dashboard in Google Sheets.
Related Fleet and Vehicle Templates
- Autonomous Vehicles KPI Dashboard in Power BI: a KPI-focused Power BI edition
- Autonomous Vehicles Dashboard in Excel: the same topic in Excel
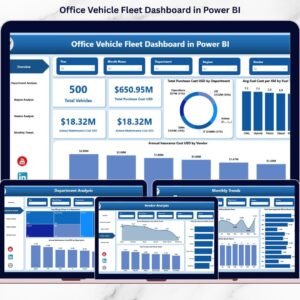
- Office Vehicle Fleet Dashboard in Power BI: a fleet view for office vehicles
- Electric Vehicle Charging Dashboard in Power BI: charging analytics in Power BI
- Power BI Dashboard Mega Collection: 15 Power BI templates in one download
Browse all Power BI dashboards.