Modern organizations rely heavily on equipment, facilities, and technical assets to maintain smooth daily operations. From manufacturing plants and corporate facilities to service organizations and infrastructure teams, maintenance efficiency directly impacts productivity and operational costs. However, many businesses still manage maintenance activities using manual logs, disconnected spreadsheets, or reactive reporting methods. As a result, work orders become difficult to track, maintenance costs increase, and operational visibility decreases.
The Service and Maintenance Performance Dashboard in Google Sheets provides a powerful, ready-to-use analytics solution designed to centralize maintenance operations into one intelligent reporting system. This interactive dashboard converts maintenance data into clear visual insights, enabling organizations to monitor performance, control costs, and improve asset reliability in real time.
Instead of reviewing multiple maintenance reports separately, managers analyze work orders, technician productivity, departmental performance, and cost trends from a single dashboard interface. Built entirely in Google Sheets, the solution enables real-time collaboration, cloud accessibility, and automated reporting without expensive software investments.
With dynamic filters and automated calculations, users can instantly explore maintenance performance by department, asset category, priority level, technician, or work order type. Consequently, decision-makers gain full operational visibility and respond proactively to maintenance challenges.
The dashboard transforms maintenance management from a reactive process into a structured, data-driven strategy that improves efficiency, reduces downtime, and strengthens operational control.
🚀 Key Feature of Service and Maintenance Performance Dashboard in Google Sheets
🔧 Work Order Monitoring – Track open and completed maintenance jobs instantly.
📊 Cost Performance Analysis – Compare estimated vs actual maintenance expenses.
🏢 Department Performance Tracking – Evaluate maintenance workload across departments.
⚙️ Asset Reliability Insights – Identify assets requiring frequent maintenance.
👨🔧 Technician Productivity Analysis – Measure technician performance effectively.
📅 Monthly Maintenance Trends – Monitor operational patterns over time.
🎯 Dynamic Filters & Slicers – Analyze data instantly using interactive controls.
☁️ Cloud Collaboration – Teams collaborate in real time using Google Sheets.
📦 What’s Inside the Service and Maintenance Dashboard
The dashboard includes multiple analytical pages designed to answer critical maintenance questions.
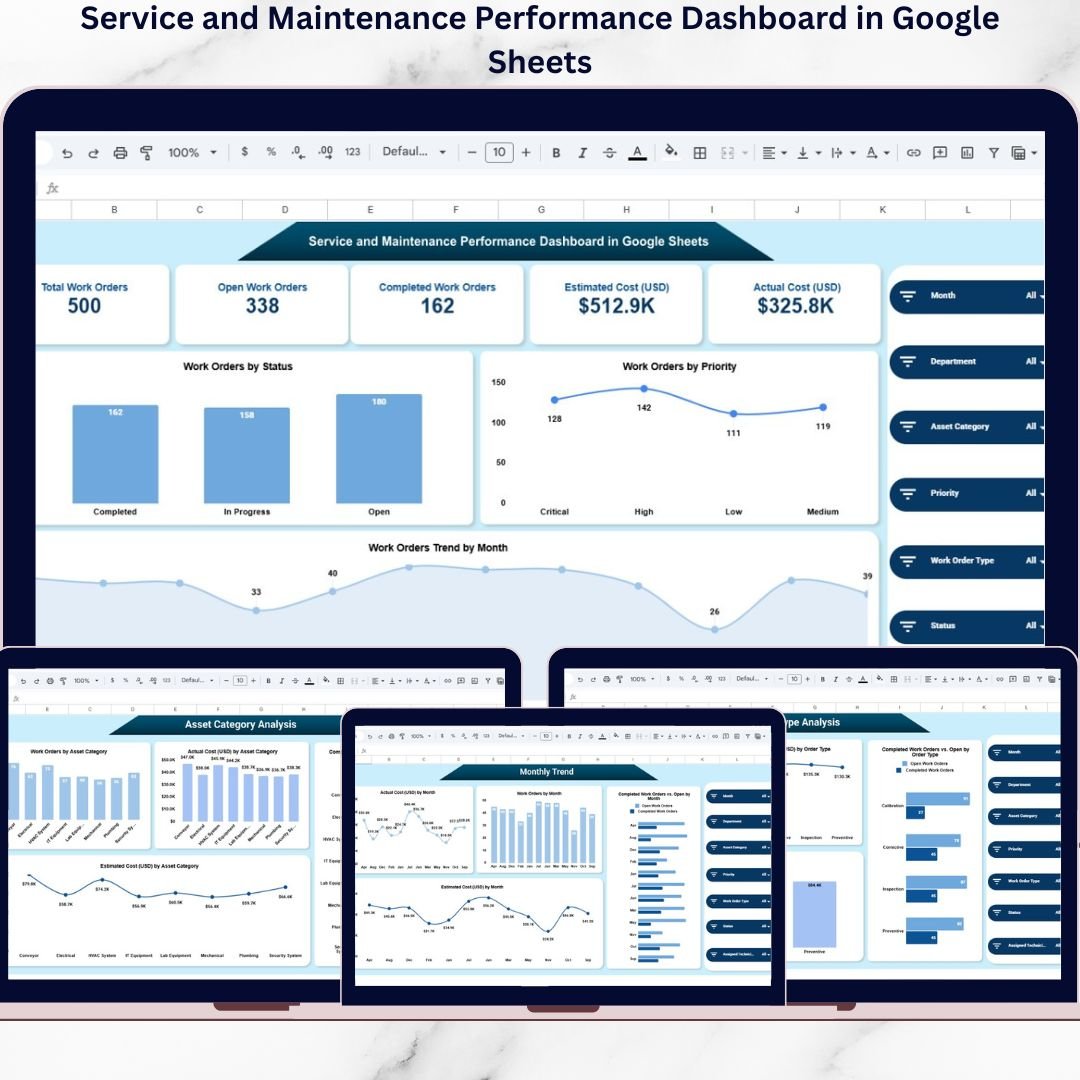
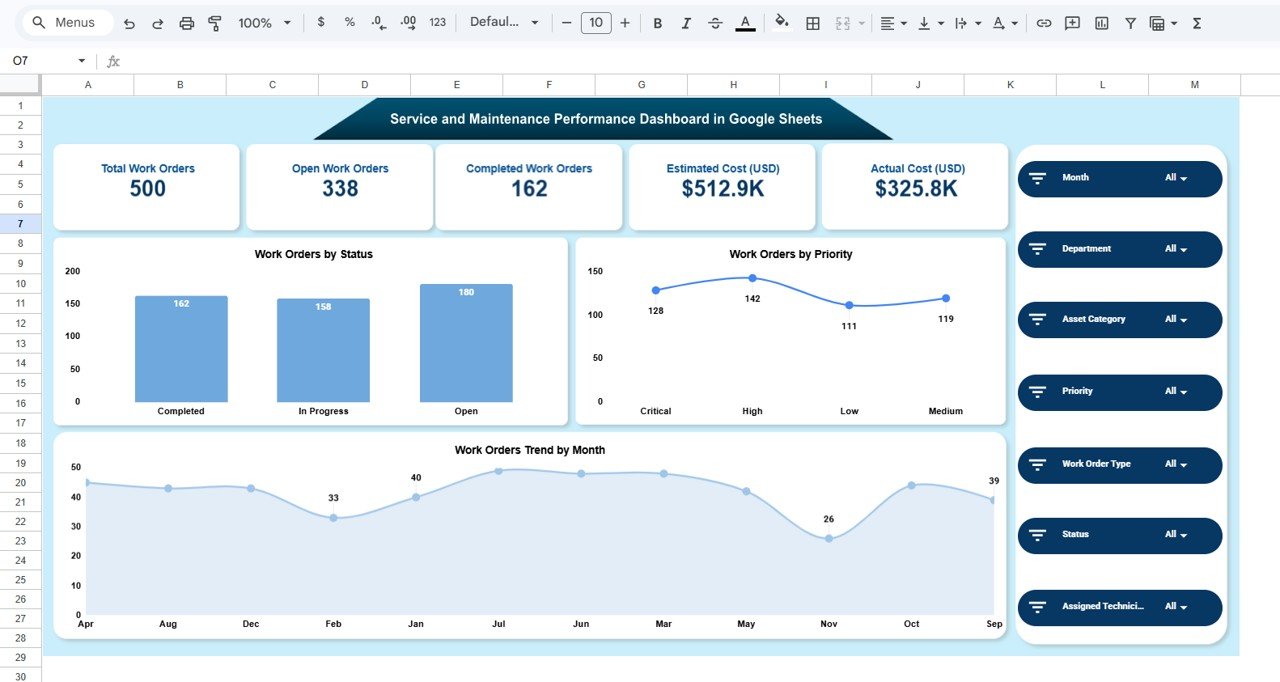
🔎 Service & Maintenance Overview — Operational Snapshot
The Overview page provides a complete maintenance summary through KPI cards and visual analytics.
Key KPI Cards
-
Total Work Orders
-
Open Work Orders
-
Completed Work Orders
-
Estimated Cost
-
Actual Cost
Interactive Filters
Month • Department • Asset Category • Priority • Work Order Type • Status • Technician
Visualizations
-
Work Orders by Status
-
Work Orders by Priority
-
Monthly Work Order Trends
Managers instantly understand workload distribution and operational progress.
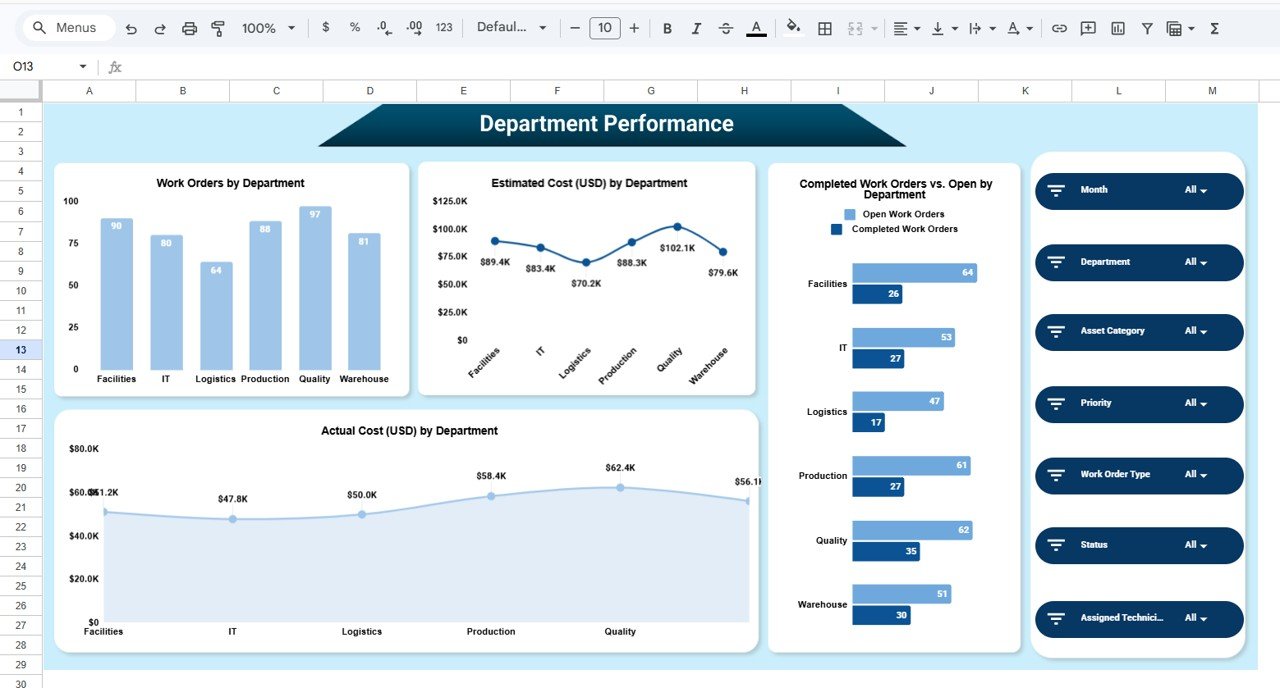
🏢 Department Performance Analysis
This page evaluates maintenance efficiency across departments.
Charts Included
-
Work Orders by Department
-
Estimated Cost by Department
-
Actual Cost by Department
-
Completed vs Open Orders Comparison
Helps identify high-maintenance departments and resource allocation needs.
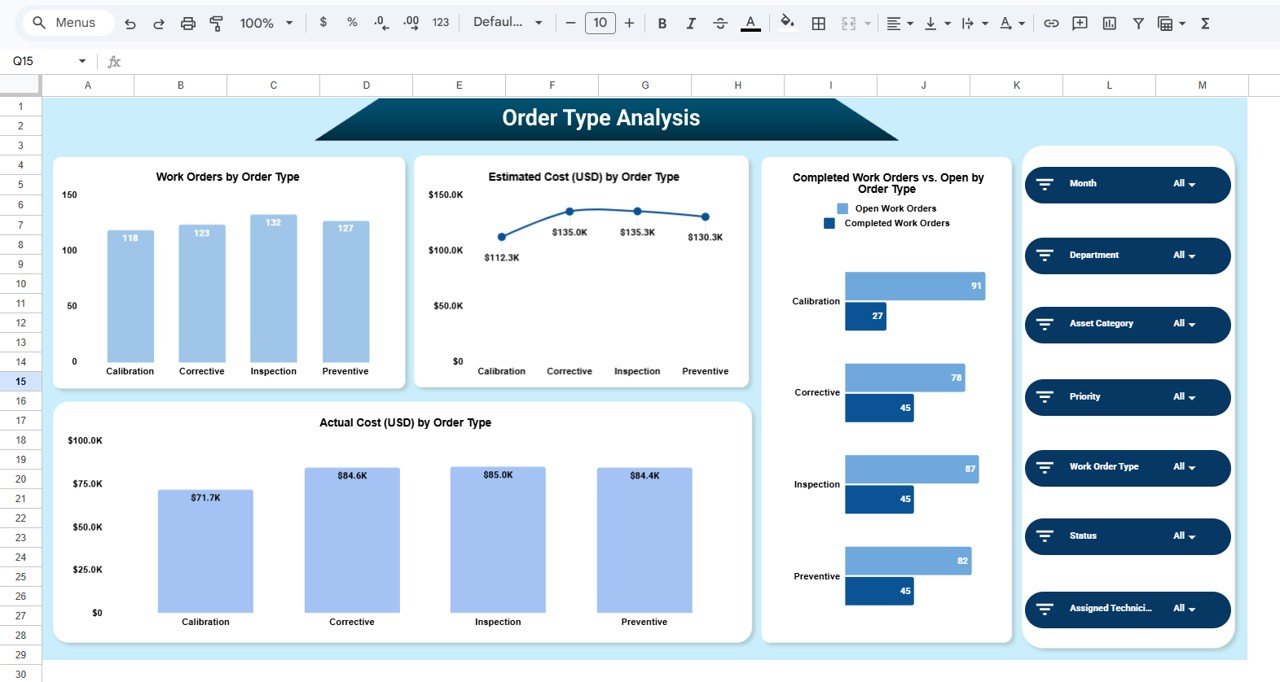
📋 Order Type Analysis — Maintenance Activity Insights
Analyzes maintenance categories such as preventive, corrective, inspection, and calibration tasks.
Visual Reports
-
Work Orders by Type
-
Cost by Order Type
-
Completed vs Open Orders by Type
Supports better maintenance planning strategies.
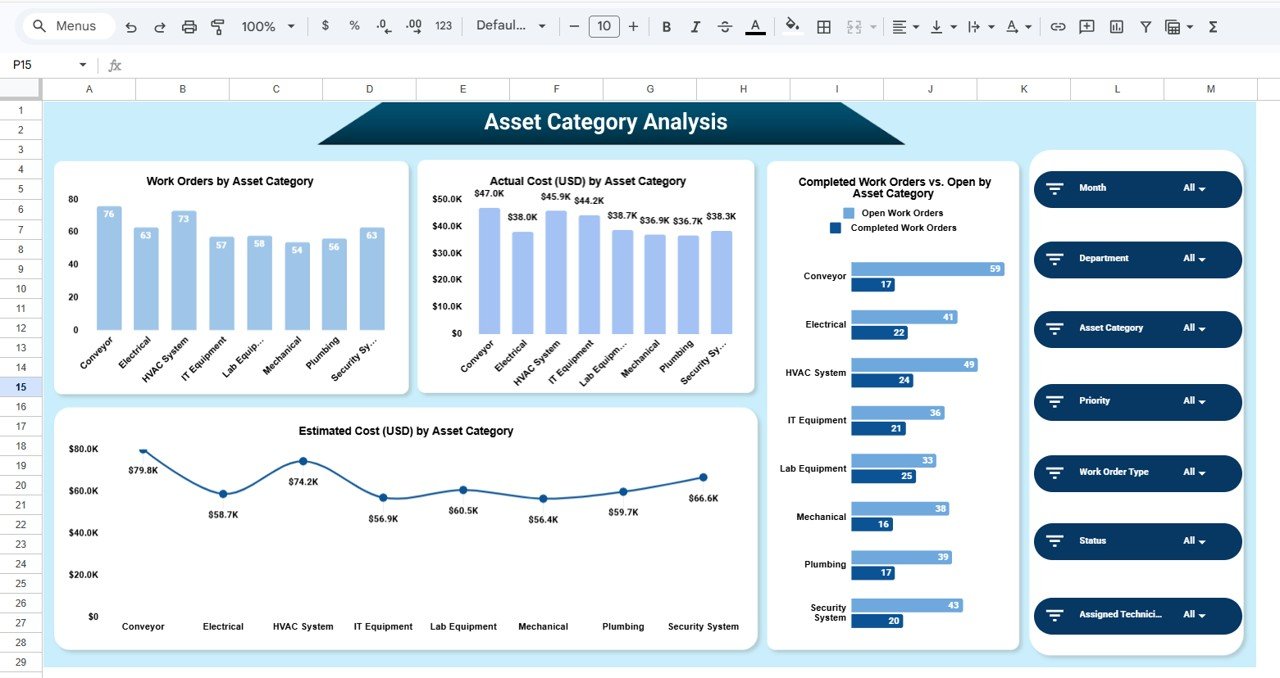
⚙️ Asset Category Analysis — Reliability Monitoring
Provides asset-level maintenance insights.
Key Visualizations
-
Work Orders by Asset Category
-
Estimated vs Actual Cost by Asset
-
Completed vs Open Orders by Asset
Allows organizations to detect reliability issues early.
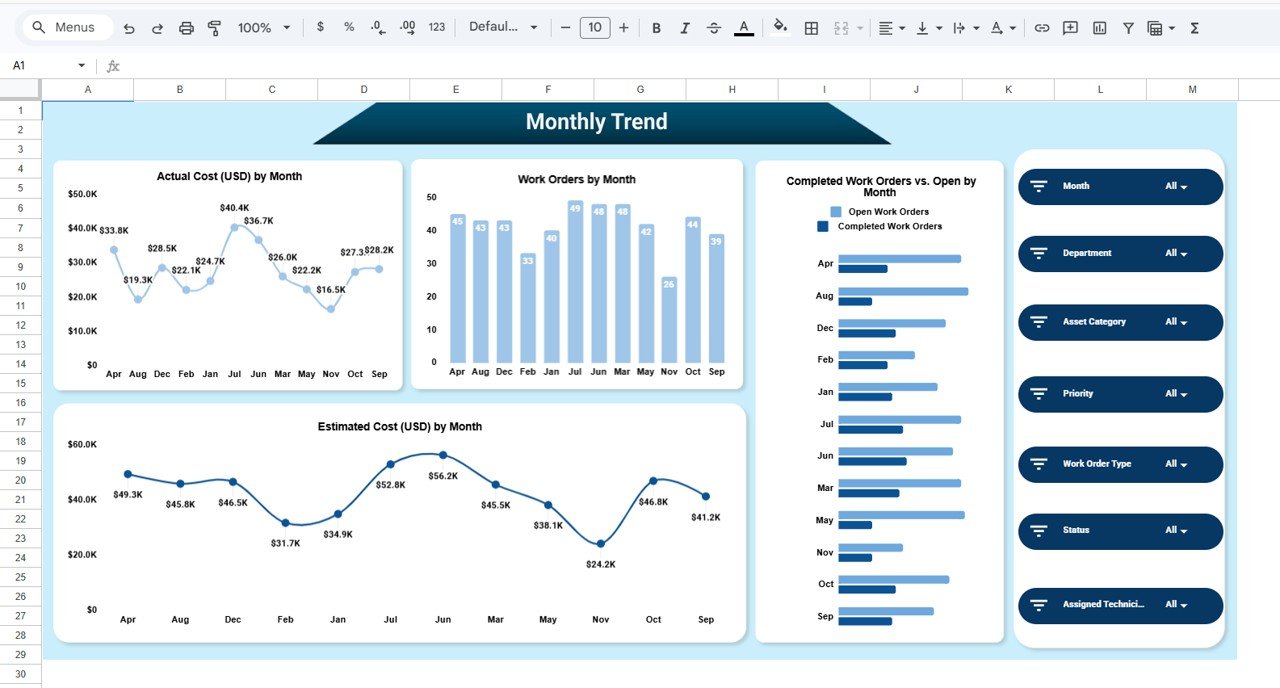
📅 Monthly Trend Analysis — Performance Over Time
Tracks maintenance performance evolution.
Trend Charts
-
Monthly Work Orders
-
Estimated vs Actual Cost Trends
-
Completed vs Open Orders Trend
Helps teams identify recurring operational patterns.
⚙️ How to Use the Dashboard
1️⃣ Update maintenance work order data regularly.
2️⃣ Apply filters to analyze departments or assets.
3️⃣ Monitor KPI cards for operational overview.
4️⃣ Compare estimated vs actual costs.
5️⃣ Review monthly trends to optimize maintenance planning.
Within minutes, teams gain actionable maintenance insights.
👥 Who Can Benefit from This Dashboard?
Ideal for:
🏭 Manufacturing Companies
🏢 Facility Management Teams
🔧 Maintenance Departments
📊 Operations Managers
👨🔧 Service Organizations
📈 Business Analysts
🏗 Infrastructure Management Teams
Any organization managing assets and maintenance operations can improve efficiency using this dashboard.
### Click here to read the Detailed blog post
Watch the step-by-step video tutorial:
Visit our YouTube channel to learn step-by-step video tutorials:
👉 https://youtube.com/@NeotechNavigators