Manufacturing organizations manage complex production environments every day. Multiple plants, hundreds of production orders, planners, product categories, and strict delivery deadlines must operate together seamlessly. However, many companies still rely on disconnected spreadsheets and manual reporting methods. As a result, operational delays increase, productivity declines, and management decisions become reactive instead of strategic.
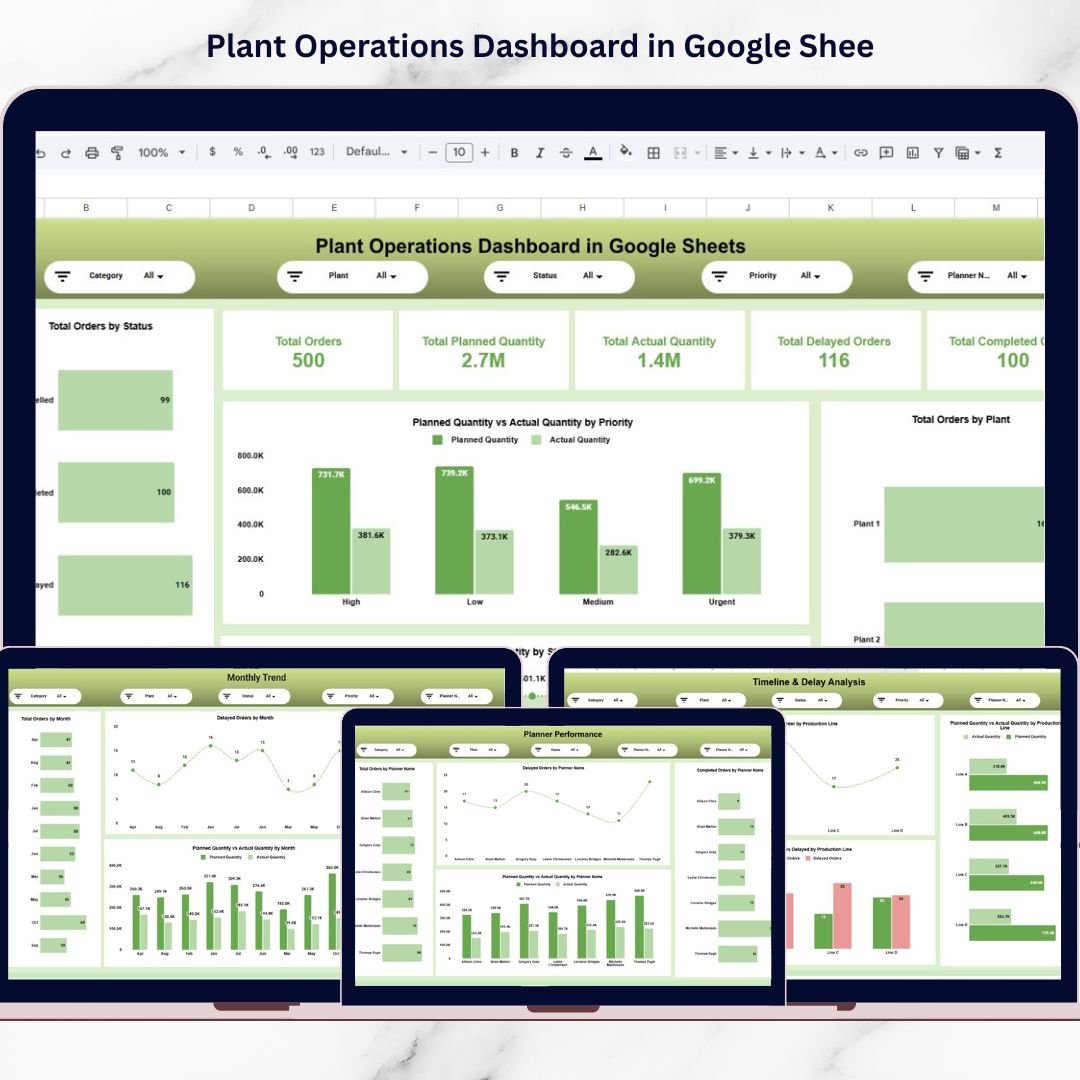
The Plant Operations Dashboard in Google Sheets provides a modern and practical solution to these challenges. This ready-to-use dashboard transforms raw production data into clear, actionable insights through automated calculations, dynamic filters, and interactive visual reports.
Instead of analyzing multiple reports separately, managers can monitor complete plant operations from a single centralized dashboard. With real-time analytics and cloud collaboration capabilities, organizations gain instant visibility into production performance, delays, planner efficiency, and operational trends.
Built entirely in Google Sheets, this dashboard allows teams to collaborate from anywhere while maintaining accurate and up-to-date operational reporting. Whether monitoring production progress or identifying bottlenecks, this dashboard helps organizations improve efficiency and make faster, data-driven decisions.
The Plant Operations Dashboard converts complex manufacturing data into a structured analytical system that supports operational excellence and continuous improvement.
🚀 Key Feature of Plant Operations Dashboard in Google Sheets
📊 Real-Time Operational Monitoring – Track production orders and plant performance instantly.
🏭 Multi-Plant Analysis – Compare performance across different manufacturing plants.
📈 Planned vs Actual Tracking – Identify production gaps quickly.
⏱ Delay Detection System – Monitor delayed and completed orders automatically.
👨💼 Planner Performance Analysis – Evaluate planner productivity and execution efficiency.
📅 Monthly Trend Monitoring – Analyze operational performance over time.
🔎 Advanced Search & Data Explorer – Locate production records instantly.
☁️ Cloud Collaboration – Teams work simultaneously using Google Sheets.
📦 What’s Inside the Plant Operations Dashboard in Google Sheets
This dashboard contains multiple analytical pages designed to answer critical operational questions.
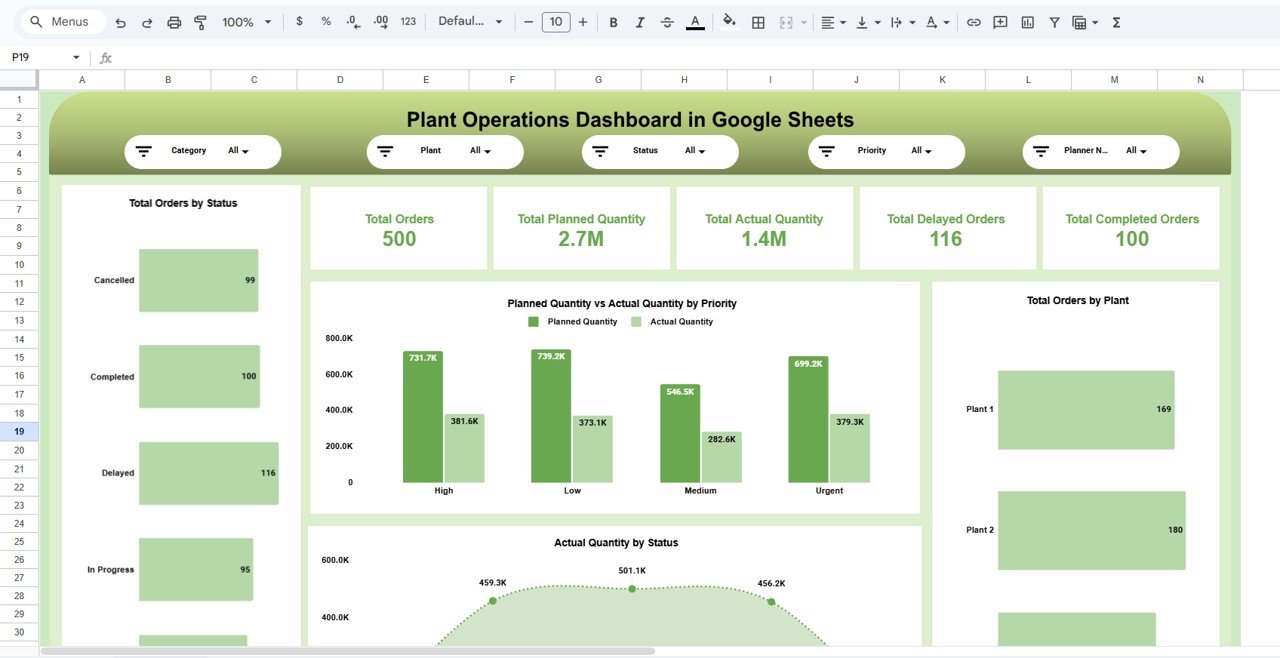
📊 Plant Operations Overview – Production Snapshot
The main control center displaying key operational KPIs:
-
Total Orders
-
Planned Quantity
-
Actual Quantity
-
Delayed Orders
-
Completed Orders
Interactive slicers allow filtering by:
Category • Plant • Status • Priority • Planner Name
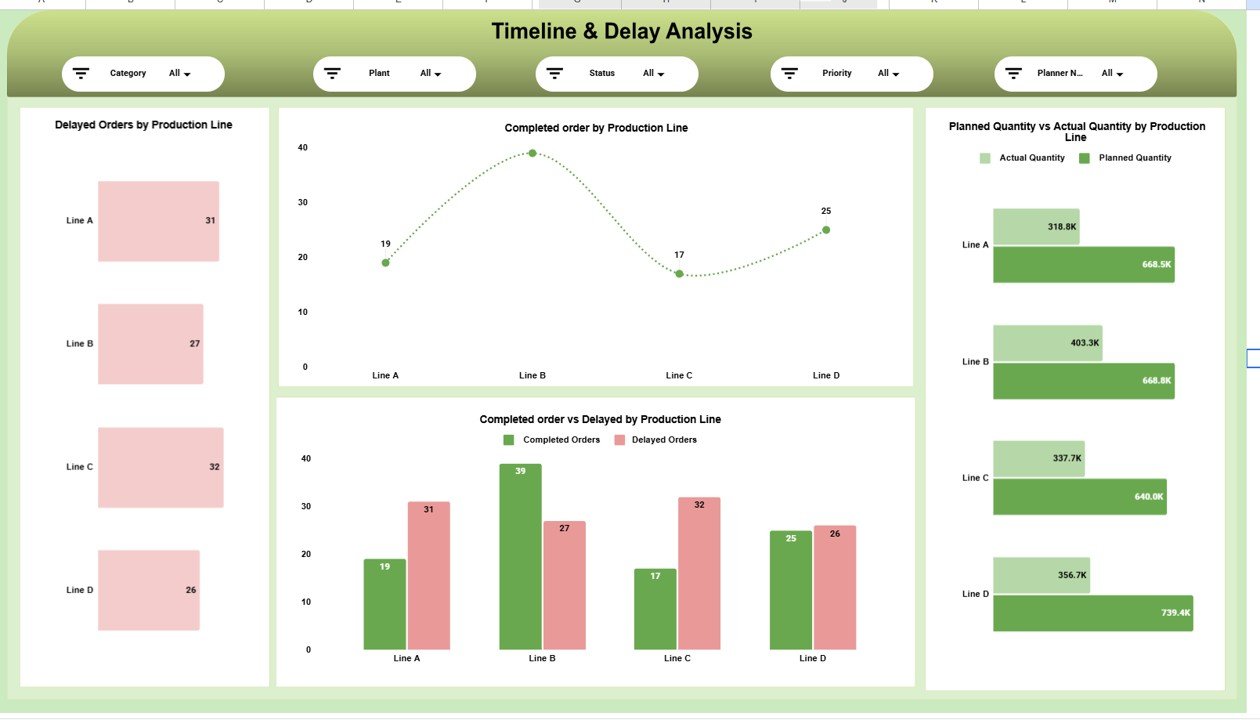
⏱ Timeline & Delay Analysis – Bottleneck Identification
Helps teams detect production delays quickly using charts such as:
-
Delayed Orders by Production Line
-
Completed Orders by Line
-
Completed vs Delayed Comparison
-
Planned vs Actual Quantity Analysis
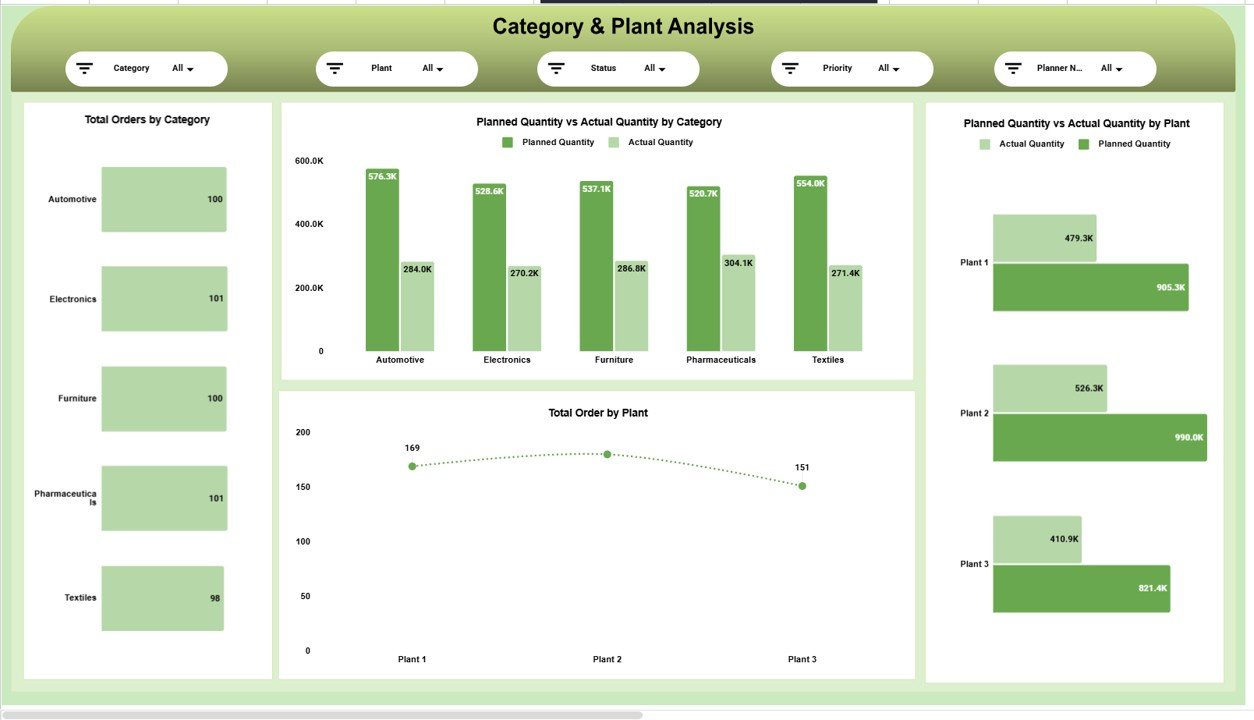
🏭 Category & Plant Analysis – Performance Comparison
Provides insights into operational efficiency across plants and product categories.
Key visuals include:
-
Orders by Category
-
Planned vs Actual by Category
-
Plant-wise Production Comparison
-
Orders by Plant
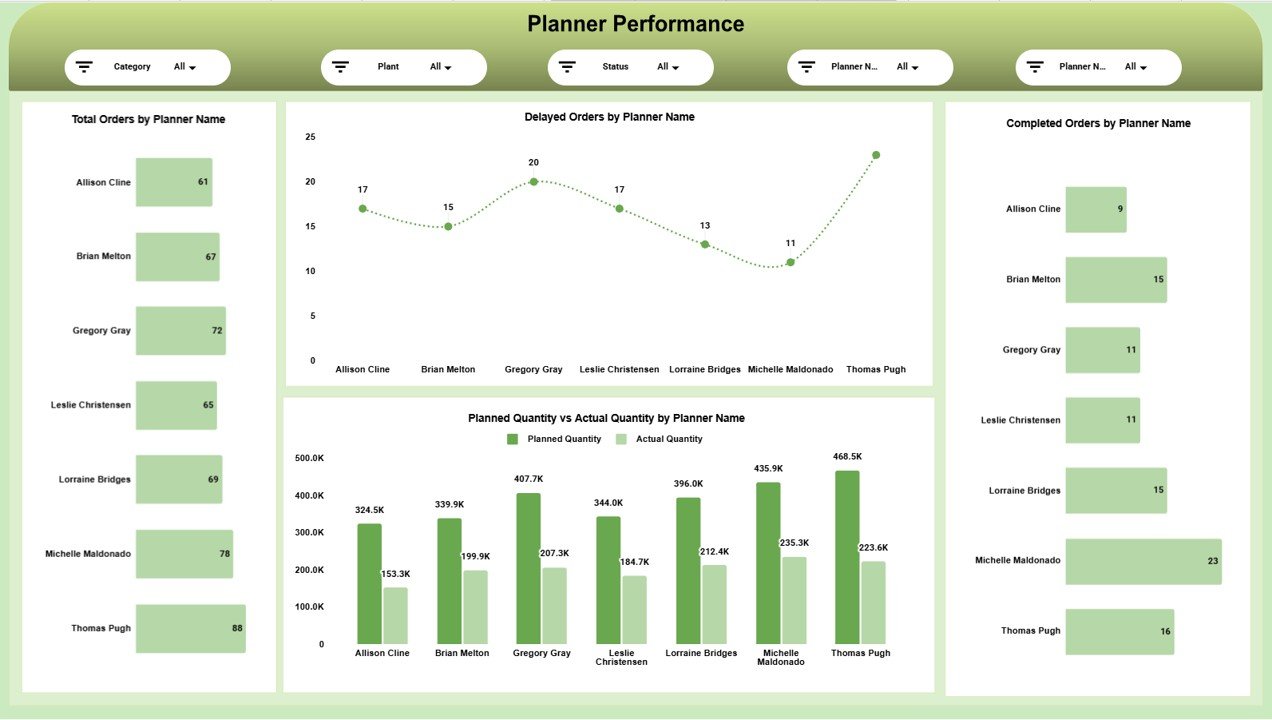
👨💼 Planner Performance Page – Productivity Measurement
Evaluates planning effectiveness through:
-
Orders by Planner
-
Delayed Orders by Planner
-
Completed Orders by Planner
-
Planned vs Actual by Planner
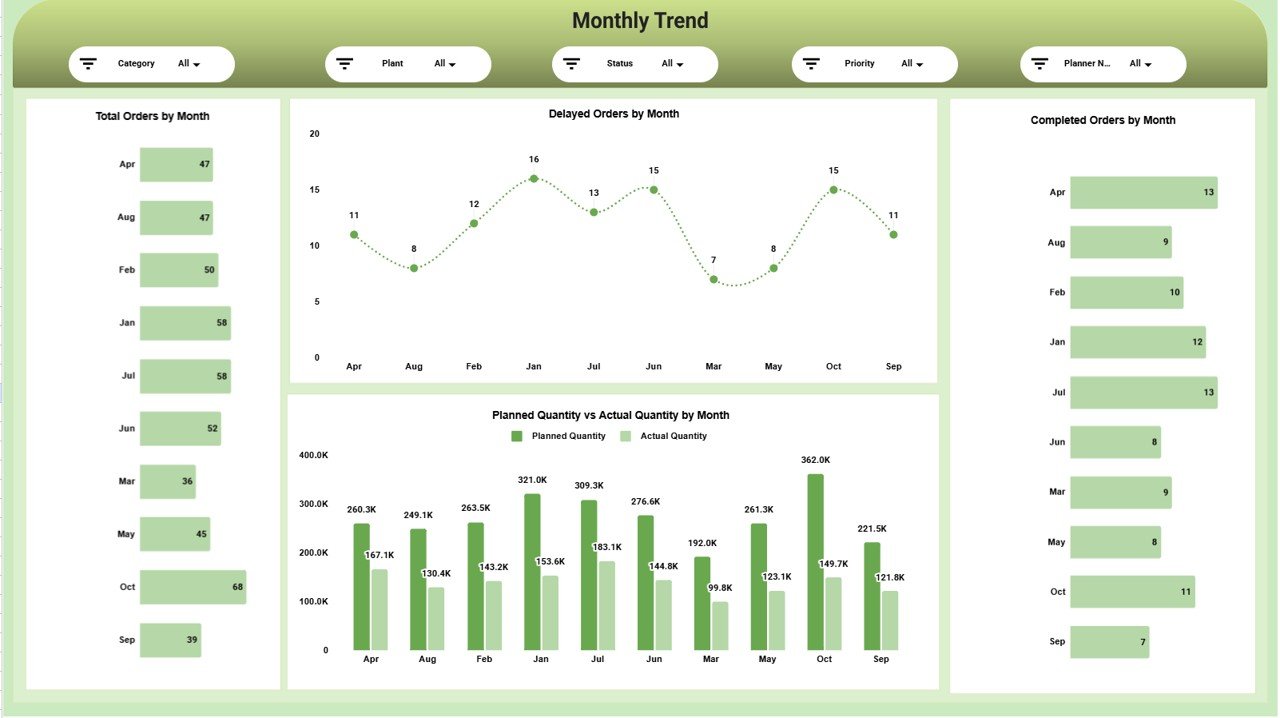
📅 Monthly Trend Analysis – Performance Over Time
Tracks operational evolution using:
-
Monthly Orders Trend
-
Delay Trends
-
Completed Orders by Month
-
Quantity Comparison by Month
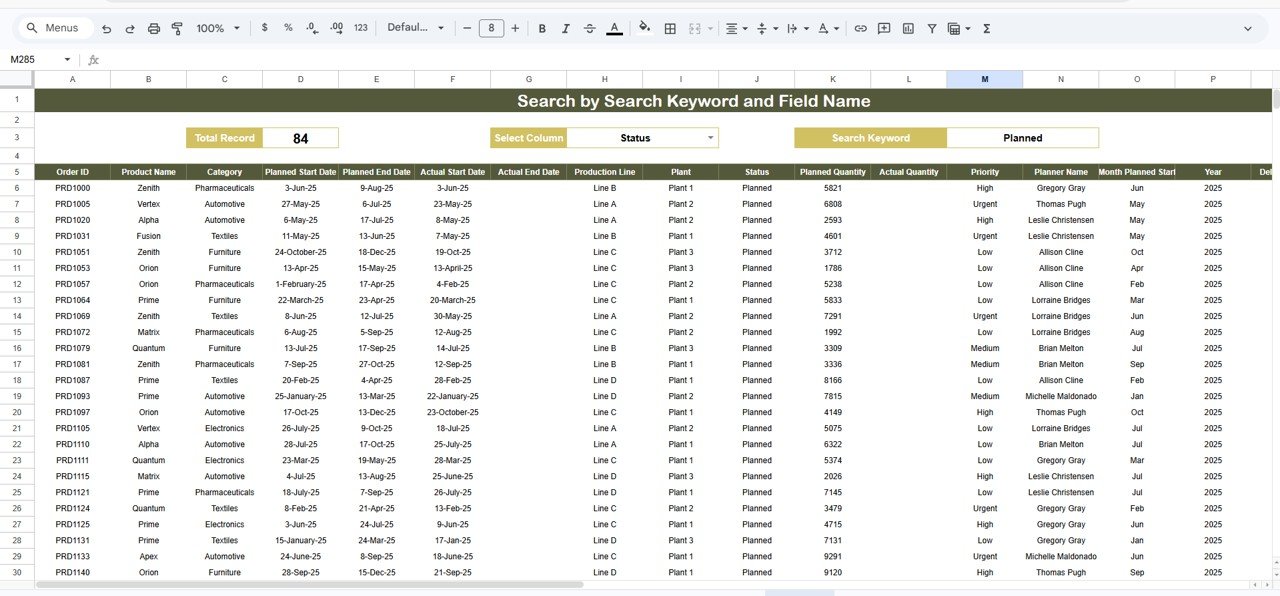
🔎 Search & Data Explorer – Fast Data Lookup
Powerful search functionality allows:
-
Keyword-based filtering
-
Column search
-
Instant order retrieval
-
Detailed production record viewing
⚙️ How to Use the Plant Operations Dashboard in Google Sheets
1️⃣ Import or update production data regularly.
2️⃣ Use filters to analyze specific plants or planners.
3️⃣ Monitor KPI cards for operational summary.
4️⃣ Identify delays using timeline analysis.
5️⃣ Review monthly trends to improve planning decisions.
Within minutes, managers gain complete operational visibility.
👥 Who Can Benefit from This Plant Operations Dashboard
This dashboard is ideal for:
🏭 Manufacturing Companies
📊 Production Managers
👨💼 Operations Leaders
📈 Supply Chain Teams
📋 Production Planners
📊 Business Analysts
🏢 Factory Executives
Any organization managing production orders and operational workflows can benefit significantly.
By improving transparency and automation, the Plant Operations Dashboard in Google Sheets enables faster decisions, reduced delays, and improved production performance.
### Click here to read the Detailed blog post
Watch the step-by-step video tutorial:
Visit our YouTube channel to learn step-by-step video tutorials:
👉 https://youtube.com/@NeotechNavigators


