Skill Development Missions Dashboard are essential for improving employment opportunities, strengthening economies, and building a future-ready workforce. Governments, NGOs, and training institutions run multiple programs simultaneously to train candidates across industries and regions. However, managing large volumes of training data — including enrollments, completions, training centers, courses, and satisfaction metrics — becomes extremely challenging when organizations rely on scattered spreadsheets and manual reporting systems.
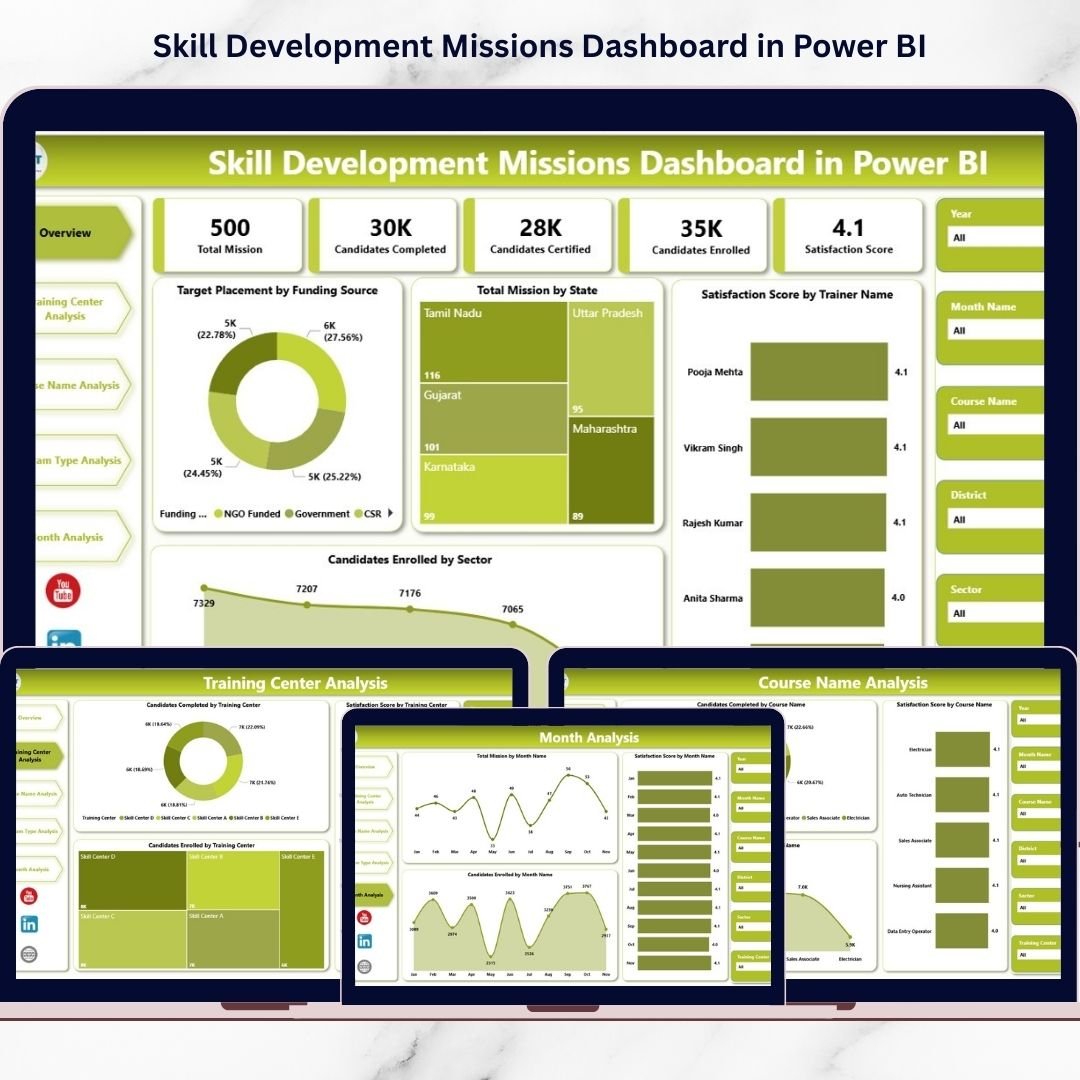
The Skill Development Missions Dashboard in Power BI is a ready-to-use, interactive analytics solution designed to transform complex training data into meaningful visual insights. Instead of spending hours compiling reports, administrators and decision-makers can monitor mission performance through a centralized dashboard powered by dynamic visualizations and automated analytics.
Built using Power BI’s advanced reporting capabilities, this dashboard enables organizations to track candidate enrollment, analyze completion rates, evaluate training center performance, compare program effectiveness, and monitor monthly mission progress — all in one professional interface. As a result, teams move from reactive reporting to proactive decision-making supported by real-time insights.
Whether managing nationwide skill initiatives or institutional training programs, this dashboard helps organizations improve monitoring efficiency, optimize resource allocation, and enhance training outcomes.
🚀 Key Feature of Skill Development Missions Dashboard in Power BI
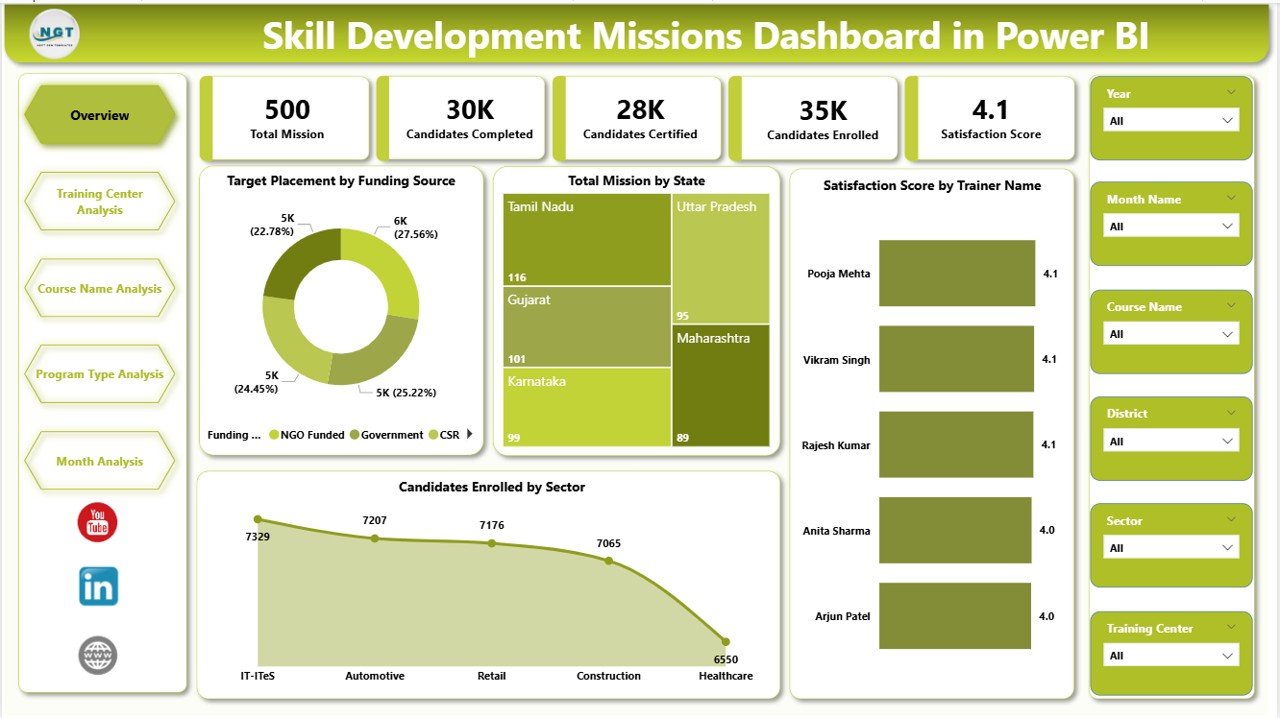
📊 Centralized Mission Performance Dashboard
Monitor all training KPIs from one unified analytics platform.
🎯 Interactive KPI Cards & Visual Reports
Understand enrollment, placements, and satisfaction performance instantly.
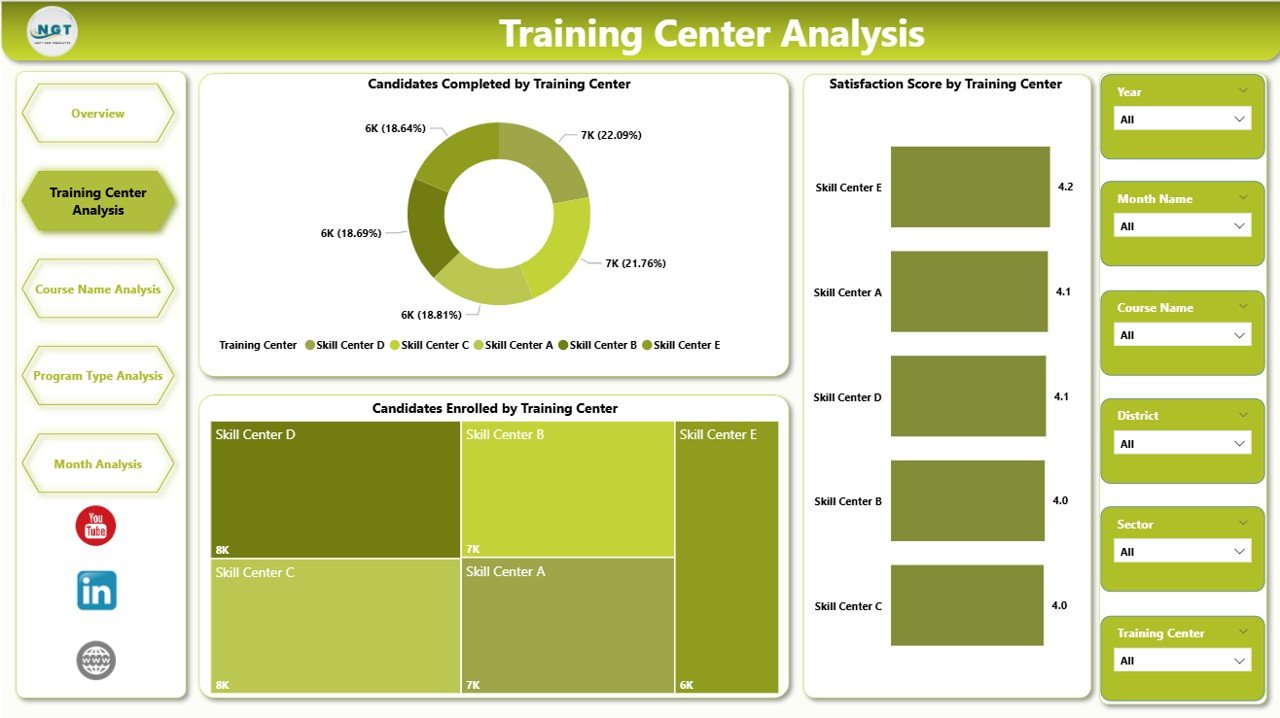
🏫 Training Center Performance Analysis
Compare completion rates and satisfaction scores across training locations.
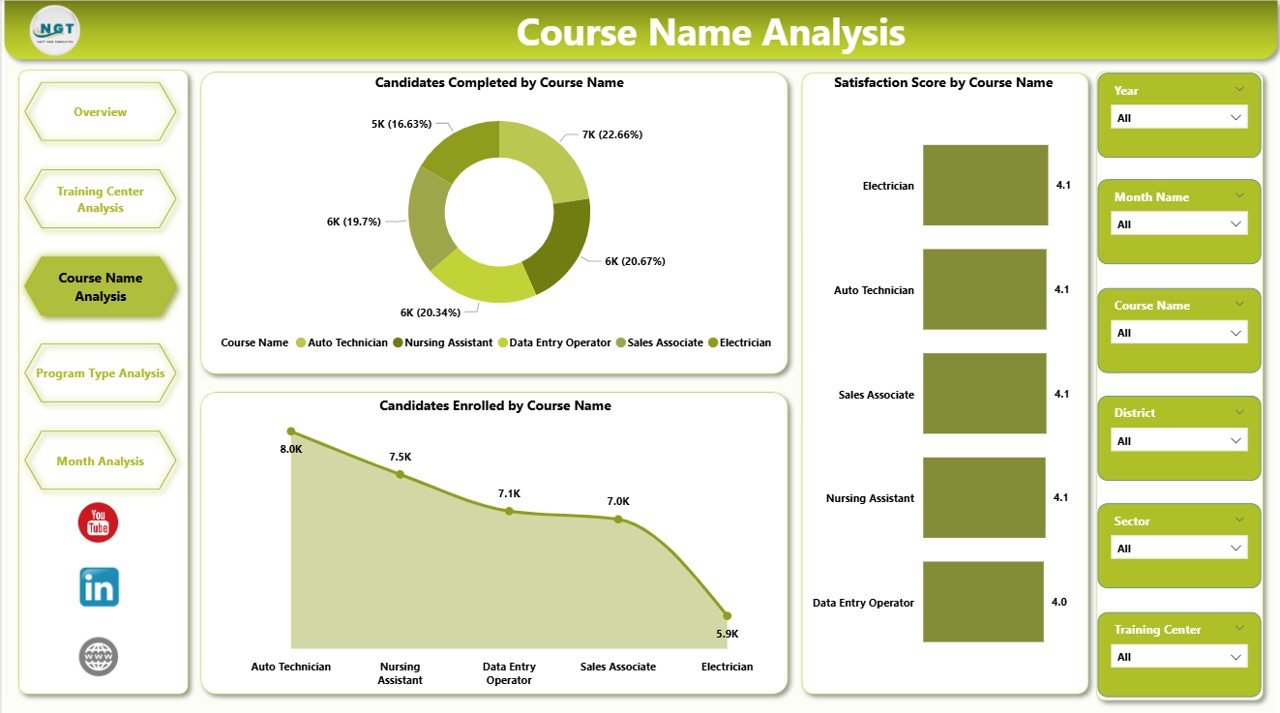
📚 Course-Level Performance Insights
Identify high-performing courses and optimize training strategies.
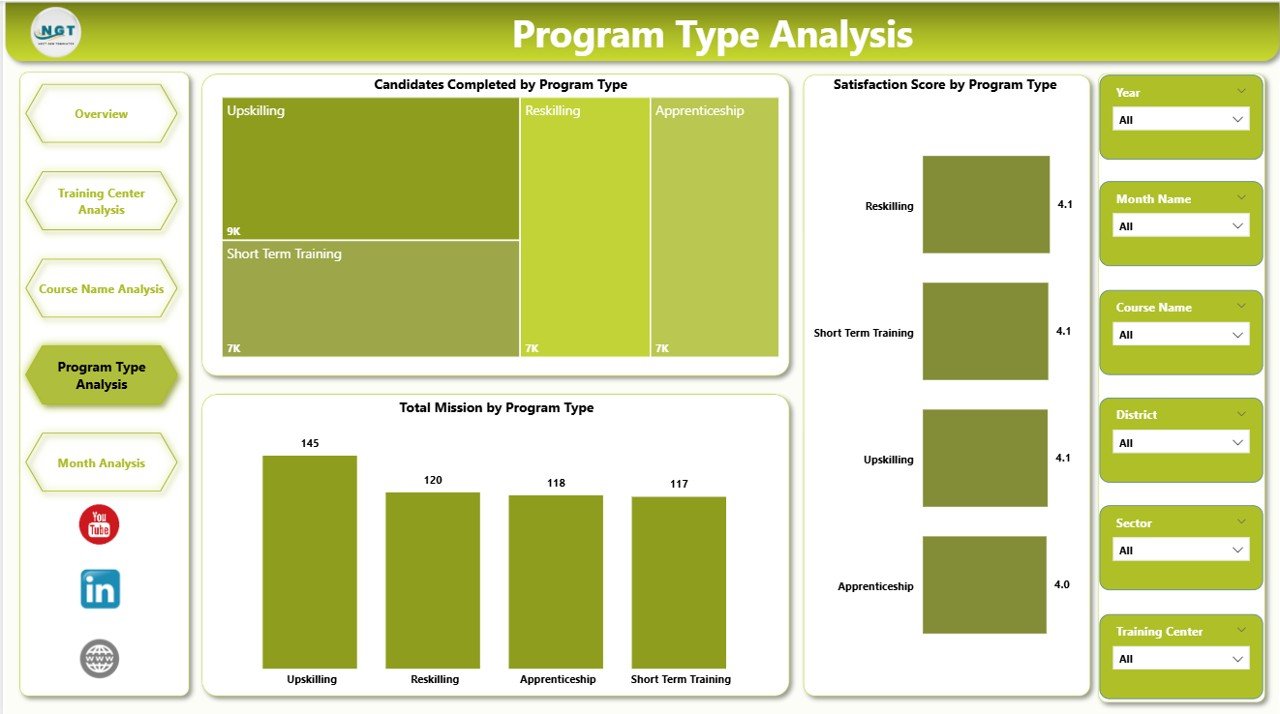
📈 Program Type Effectiveness Analysis
Evaluate which training programs deliver better outcomes.
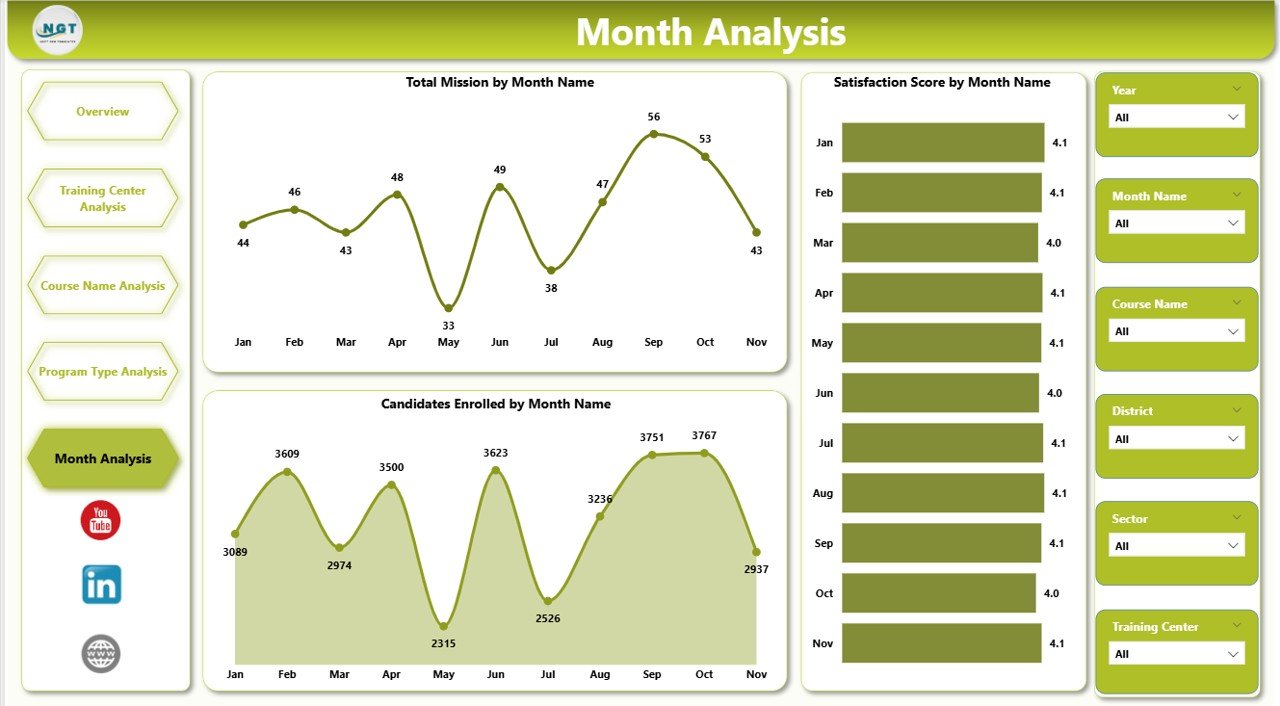
📅 Monthly Progress Tracking
Analyze enrollment and mission growth trends over time.
🔎 Dynamic Slicers & Filters
Explore insights instantly using interactive filtering options.
⚡ Automated Data Visualization
Refresh datasets and visuals update automatically.
📦 What’s Inside the Skill Development Missions Dashboard in Power BI
This ready-to-use dashboard includes a complete analytics framework:
✅ Five Interactive Dashboard Pages
-
Overview Dashboard
-
Training Center Analysis
-
Course Name Analysis
-
Program Type Analysis
-
Month Analysis
✅ Prebuilt KPI Cards & Interactive Charts
✅ Dynamic Slicers for Flexible Analysis
✅ Professional Workforce Analytics Layout
✅ Ready-to-Use Power BI Report File
✅ Structured Data Model for Easy Updates
Simply connect your data source and begin analyzing immediately.
🛠️ How to Use the Skill Development Missions Dashboard in Power BI
The dashboard is designed for easy adoption:
1️⃣ Import training program data into Power BI.
2️⃣ Refresh datasets to update visuals automatically.
3️⃣ Use slicers to filter by training center, course, or program type.
4️⃣ Navigate across analytical pages for deeper insights.
5️⃣ Monitor KPI cards and charts for performance evaluation.
6️⃣ Share dashboards securely with stakeholders.
No advanced technical expertise is required — Power BI handles calculations and visualization automatically.
👥 Who Can Benefit from This Skill Development Missions Dashboard in Power BI
This dashboard is ideal for organizations managing workforce and training programs:
🏛 Government Skill Development Departments
🎓 Training Institutes & Academies
🌍 NGOs & Development Organizations
📊 Program Managers & Coordinators
💼 Workforce Development Agencies
👨💼 Policy Makers & Leadership Teams
From local training initiatives to national skill missions, this dashboard provides complete operational visibility.
By implementing this dashboard, organizations centralize data, improve transparency, reduce reporting time, and enable data-driven planning. Instead of focusing on manual reporting, teams concentrate on improving training quality and achieving mission goals effectively.
### Click here to read the Detailed blog post
Visit our YouTube channel to learn step-by-step video tutorials:
👉 https://youtube.com/@PKAnExcelExpert