Customer opinions are everywhere—surveys, reviews, emails, support tickets, and social media. However, raw feedback alone does not improve customer experience. What truly drives growth is how fast and how accurately you analyze customer feedback. That is exactly where the Customer Feedback Analysis Dashboard in Power BI becomes a game-changing solution.
This ready-to-use Power BI dashboard helps businesses transform scattered customer feedback into clear insights, measurable KPIs, and actionable decisions. Instead of manually reading thousands of responses, you can instantly track sentiment, satisfaction, response time, resolution efficiency, and loyalty metrics—all in one interactive dashboard.
Built using Power BI’s powerful analytics engine, this dashboard delivers real-time visibility, dynamic filtering, and executive-level reporting, making customer experience management faster and smarter than ever.
## 🚀 Key Features of Customer Feedback Analysis Dashboard in Power BI
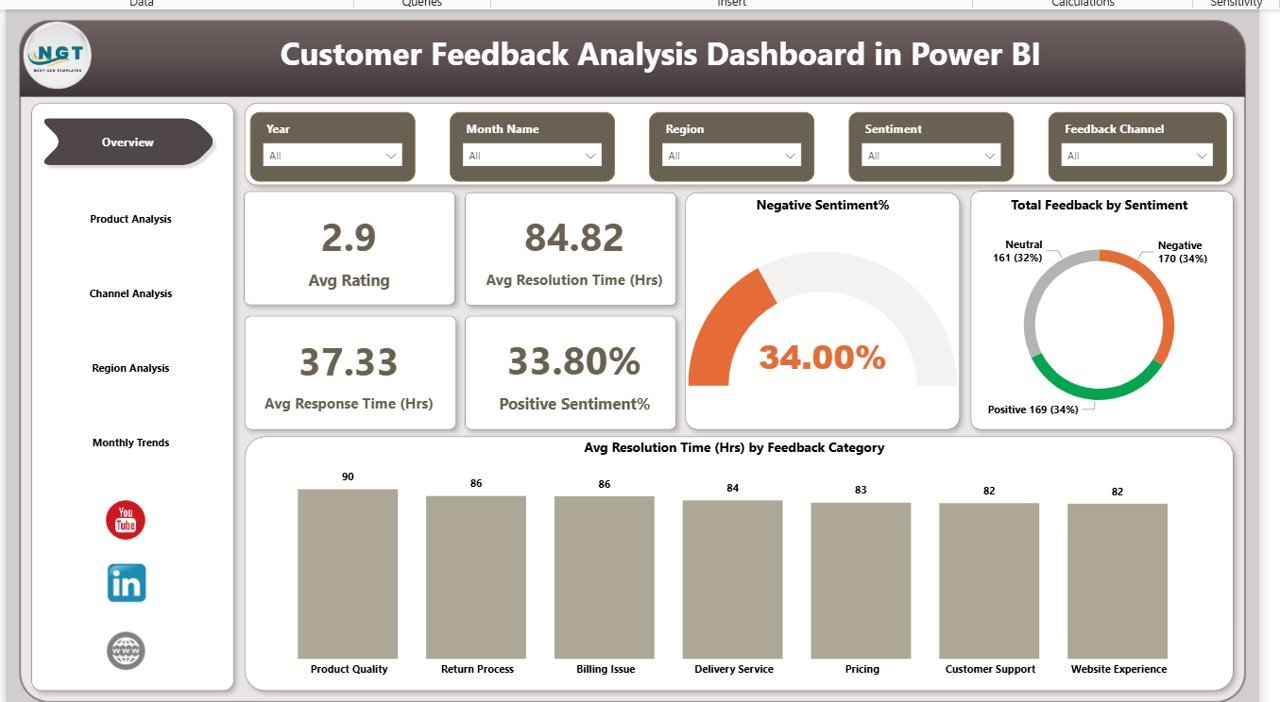
✅ Interactive KPI Cards to monitor average rating, NPS score, response time, resolution time, and sentiment percentages
📊 Sentiment Analysis Visuals to clearly separate positive, neutral, and negative feedback
⏱️ Response & Resolution Time Tracking to identify service delays and bottlenecks
🎯 Product-Level Feedback Analysis to spot high-performing and underperforming products
📞 Channel Performance Analysis for email, chat, phone, and social media feedback
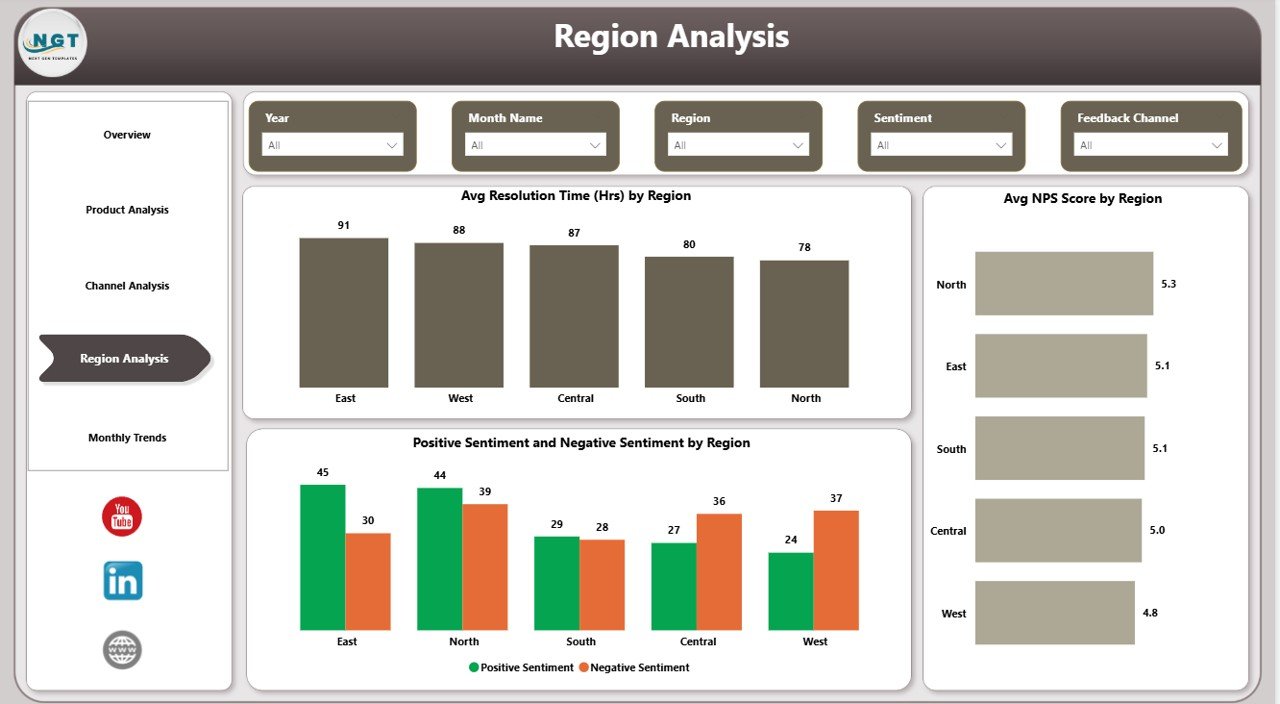
🌍 Region-Wise Insights to compare customer experience across locations
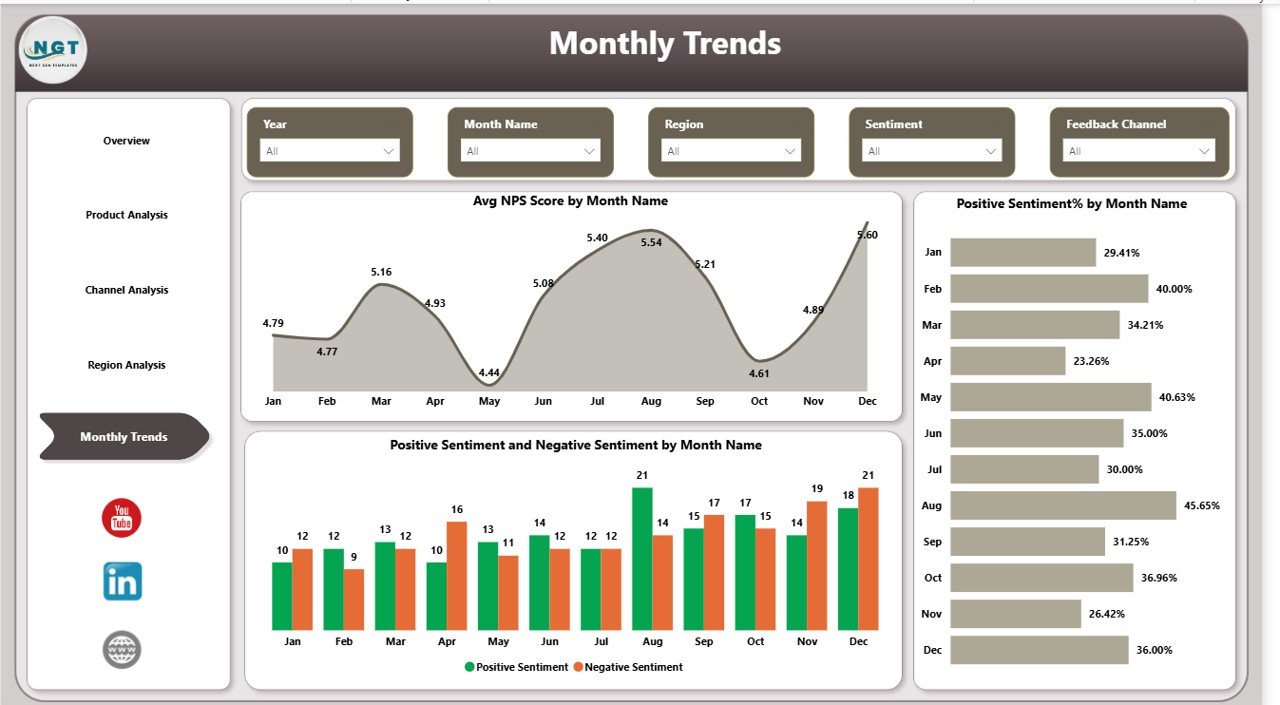
📈 Monthly Trend Analysis to track changes in customer satisfaction over time
🔎 Dynamic Slicers for filtering by product, channel, region, and time period
## 📦 What’s Inside the Customer Feedback Analysis Dashboard
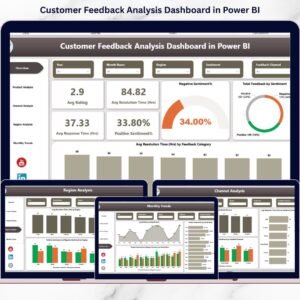
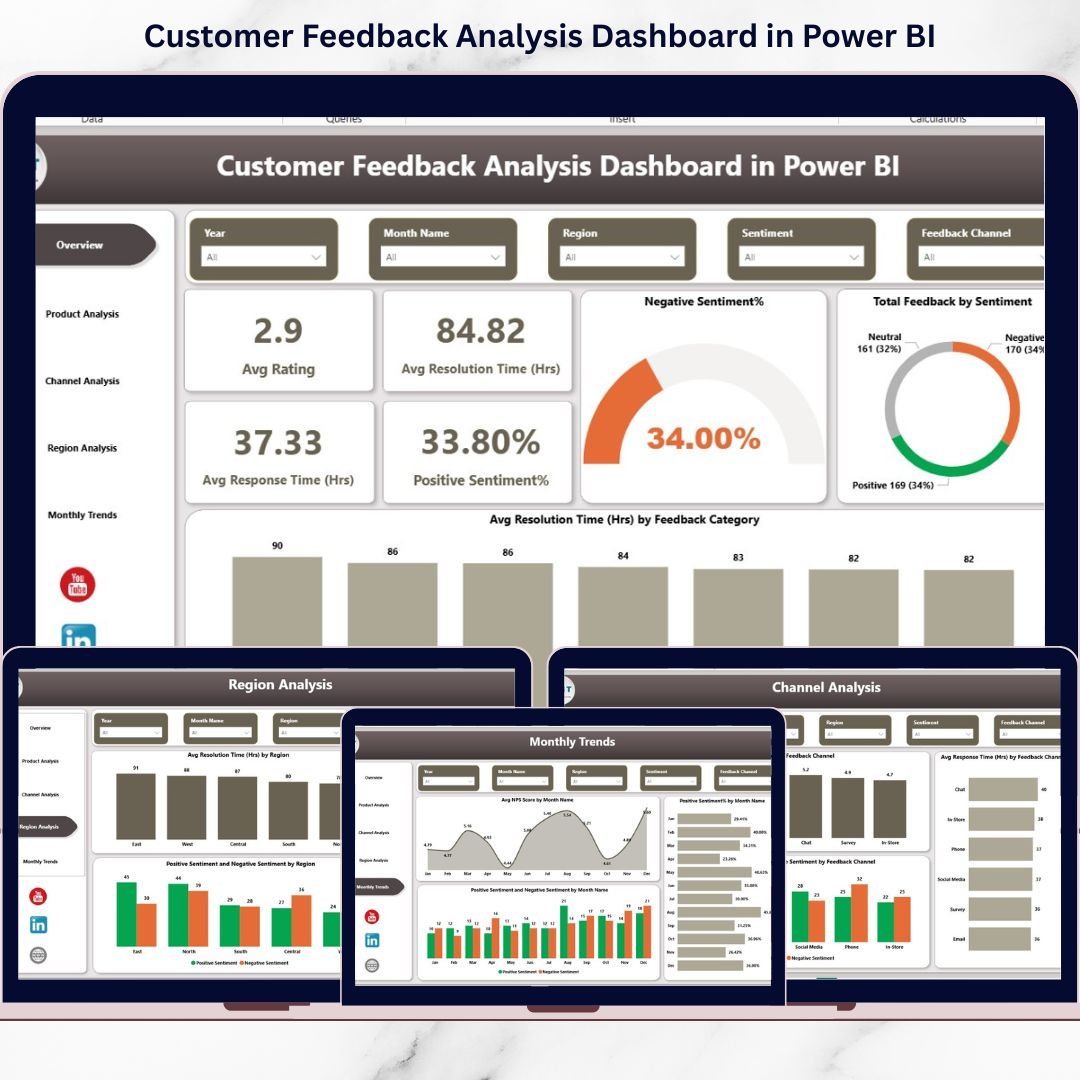
This Power BI dashboard comes with five professionally designed report pages, each answering a specific business question:
📌 Overview Page
Get a high-level snapshot of overall customer feedback performance with key KPIs and sentiment distribution.
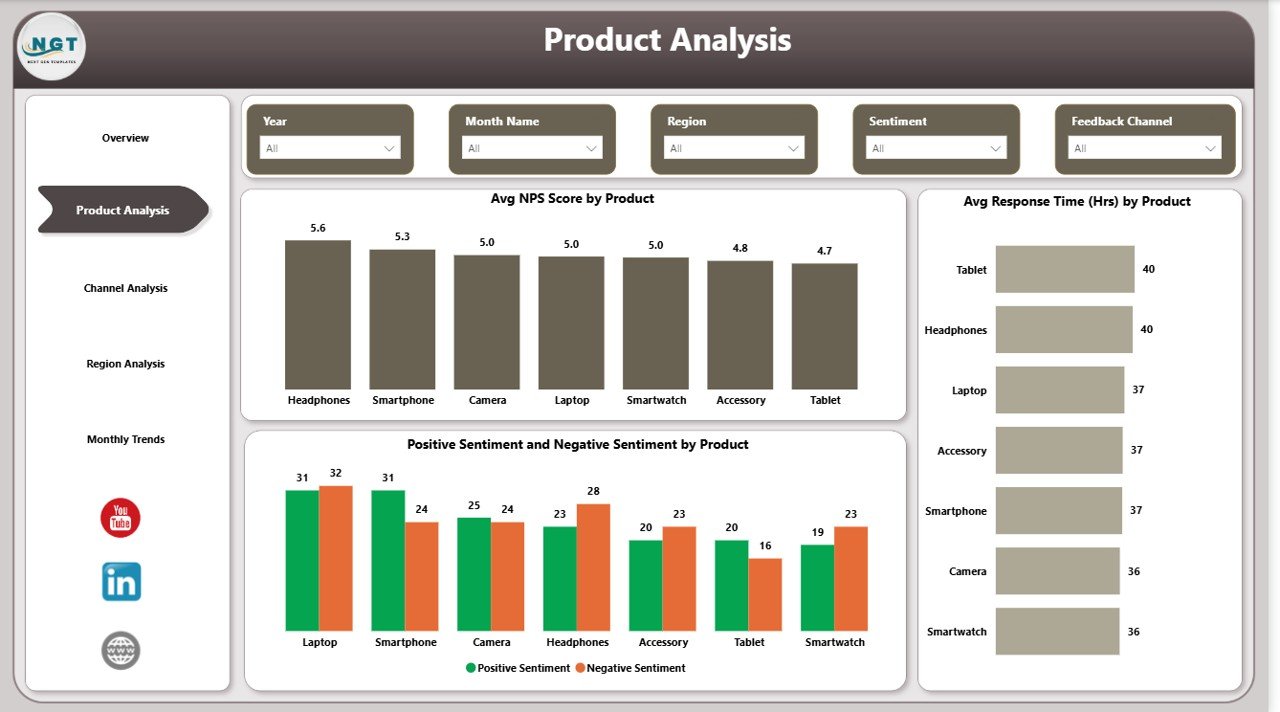
📌 Product Analysis Page
Analyze feedback, NPS scores, response time, and sentiment for each product to prioritize improvements.
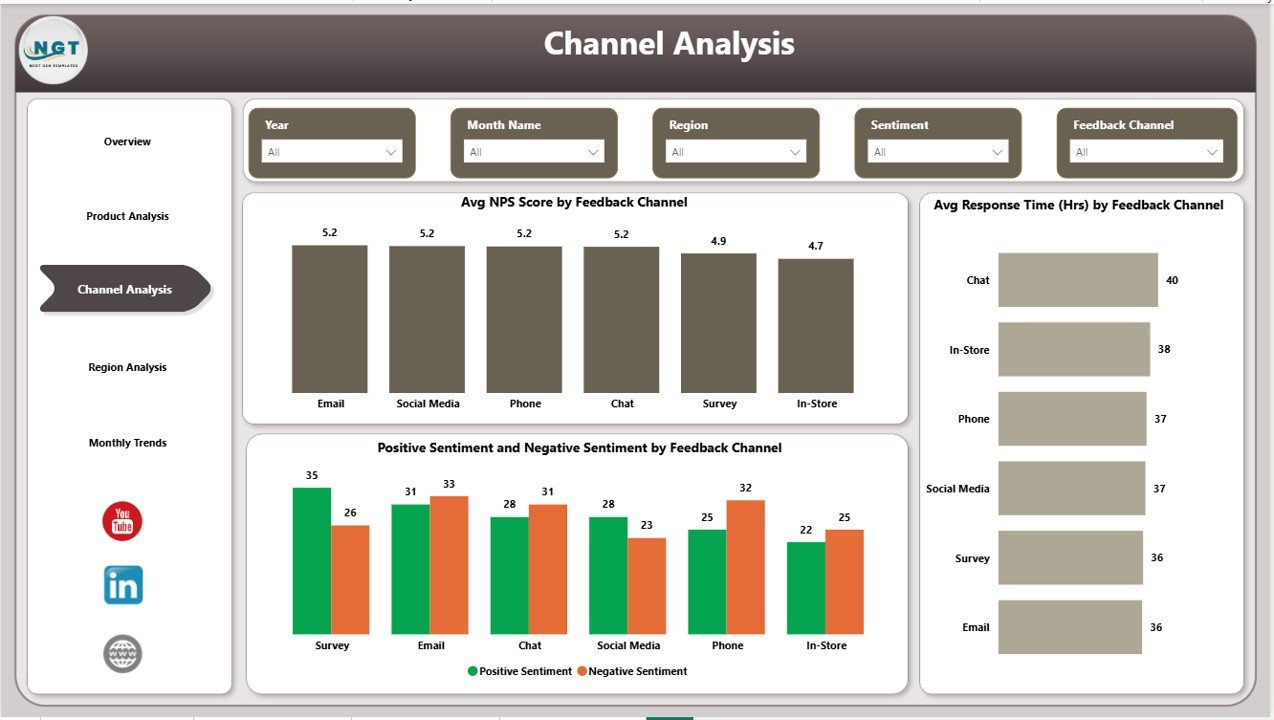
📌 Channel Analysis Page
Understand which feedback channels perform best and which need optimization.
📌 Region Analysis Page
Compare customer satisfaction, resolution time, and loyalty across different geographic regions.
📌 Monthly Trends Page
Track how customer sentiment and NPS scores change month over month to measure improvement impact.
Together, these pages provide complete 360° visibility into customer experience.
## 🧭 How to Use the Customer Feedback Analysis Dashboard
Using this dashboard is simple and business-friendly:
1️⃣ Connect your structured customer feedback data to Power BI
2️⃣ Refresh the dataset to load the latest feedback
3️⃣ Use slicers to filter insights by product, channel, region, or time
4️⃣ Monitor KPIs, trends, and sentiment patterns
5️⃣ Take data-driven actions to improve products and services
No advanced Power BI knowledge is required. The dashboard is designed for instant usability.
## 🎯 Who Can Benefit from This Customer Feedback Analysis Dashboard
This dashboard is ideal for:
👔 CX & Customer Support Teams tracking satisfaction and service efficiency
📊 Business Analysts analyzing feedback trends and KPIs
📦 Product Managers identifying product-level issues and opportunities
🏢 Operations & Service Managers improving response and resolution times
📈 Leadership Teams making strategic, data-driven customer experience decisions
If customer experience matters to your business, this dashboard is a must-have.
Click here to read the Detailed blog post
Watch the step-by-step video tutorial: