Managing employee diversity is no longer just an HR responsibility—it is a business priority. Organizations today must track representation, inclusion, equality, and workforce balance across departments, regions, job levels, and demographics. However, when diversity data sits in scattered Excel files or static HR reports, insights remain hidden and decisions slow down.
That is where the Employee Diversity Dashboard in Power BI becomes a powerful game-changer.
This ready-to-use Power BI dashboard helps HR teams and leadership visually track, analyze, and monitor employee diversity metrics from one centralized and interactive platform. Instead of spending hours compiling reports, users instantly explore workforce composition, compensation distribution, employee status, and diversity trends using dynamic visuals and smart filters.
Built for clarity, speed, and strategic decision-making, this dashboard transforms raw HR data into meaningful insights that support fairness, inclusion, and long-term workforce planning.
🔹 Key Features of Employee Diversity Dashboard in Power BI
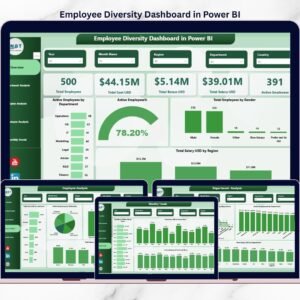
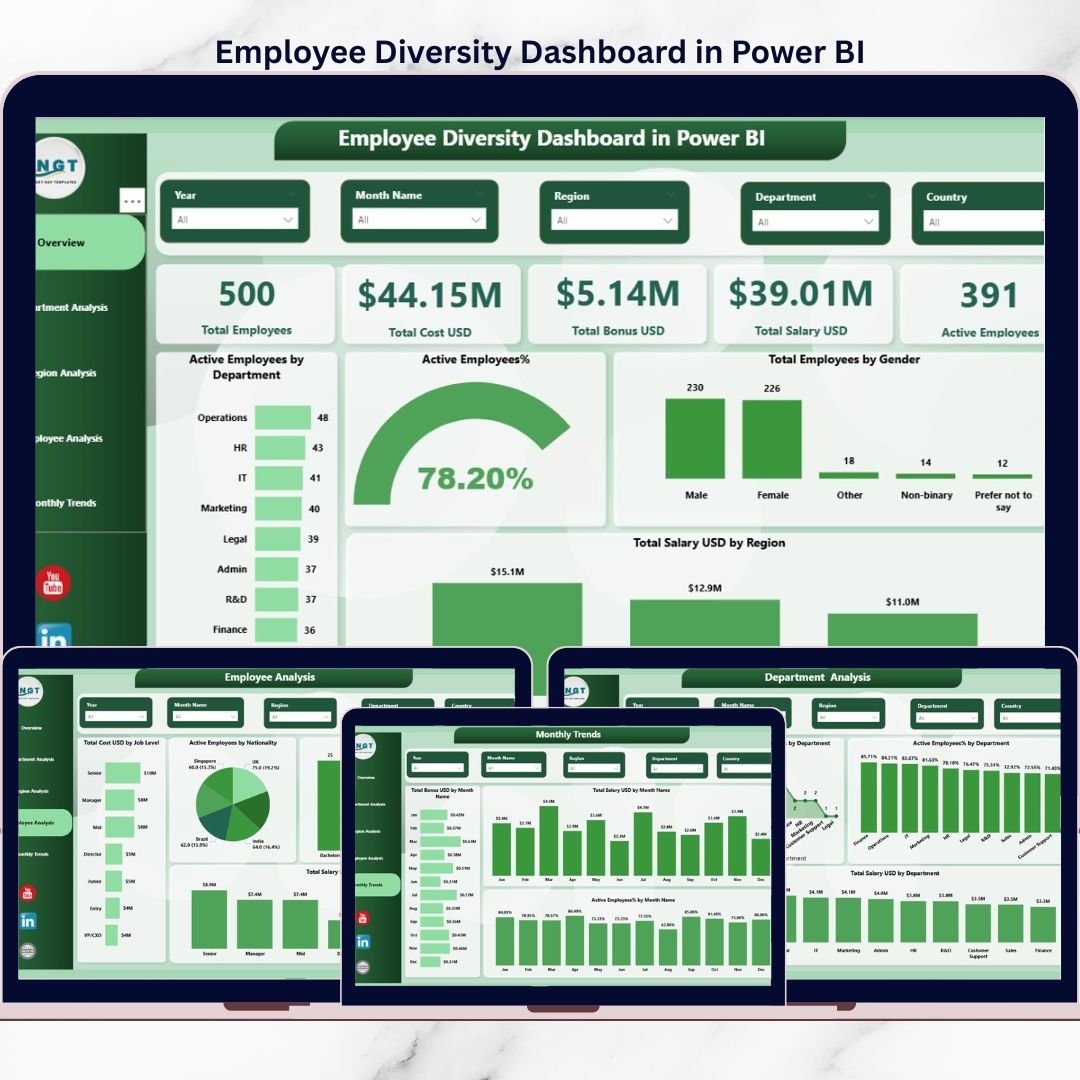
📊 Interactive Workforce KPIs
Get an instant snapshot of total employees, active employees, salary, bonus, and workforce cost through clean KPI cards.
🧩 Multi-Dimensional Diversity Analysis
Analyze employee diversity by gender, nationality, department, region, job level, and employment status—all in one dashboard.
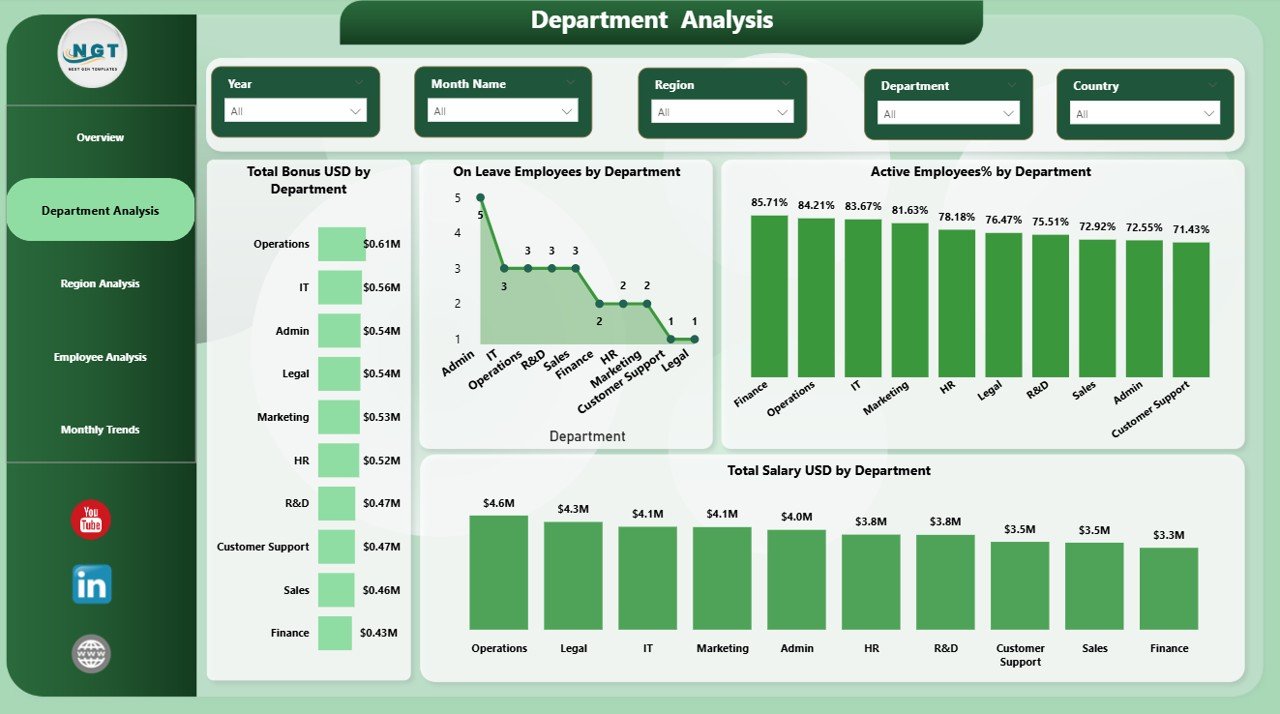
🎯 Department-Wise Insights
Compare salary distribution, bonuses, leave patterns, and active employee percentages across departments to identify imbalance early.
🌍 Region-Wise Workforce Visibility
Track employee engagement, resignations, and workforce strength across regions to support global HR strategies.
📈 Monthly Trend Analysis
Monitor workforce changes, compensation movement, and engagement trends over time to move from reactive to proactive HR planning.
🎛️ Smart Filters & Slicers
Use slicers to drill down by department, region, or time period and get focused insights instantly.
🔹 What’s Inside the Employee Diversity Dashboard in Power BI
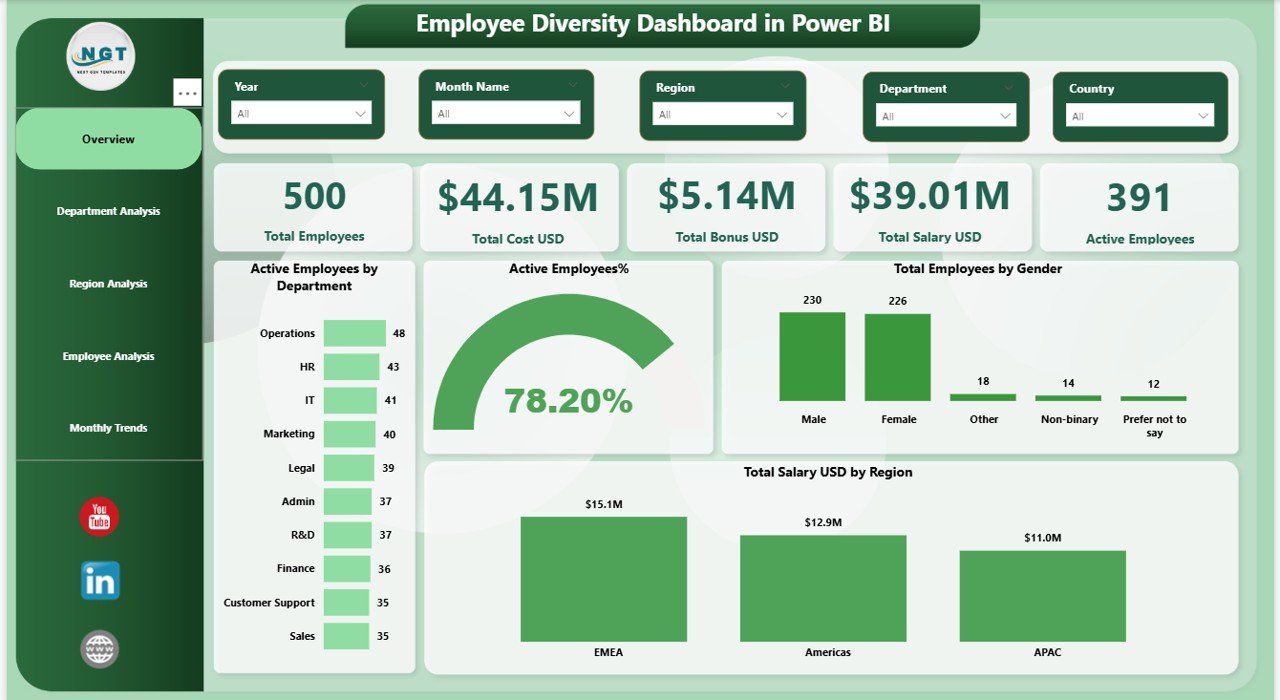
📄 Overview Page
High-level workforce snapshot with KPIs and visuals such as active employees by department, gender distribution, and salary by region.
📄 Department Analysis Page
Department-level insights including total bonus, on-leave employees, salary distribution, and active employee percentage.
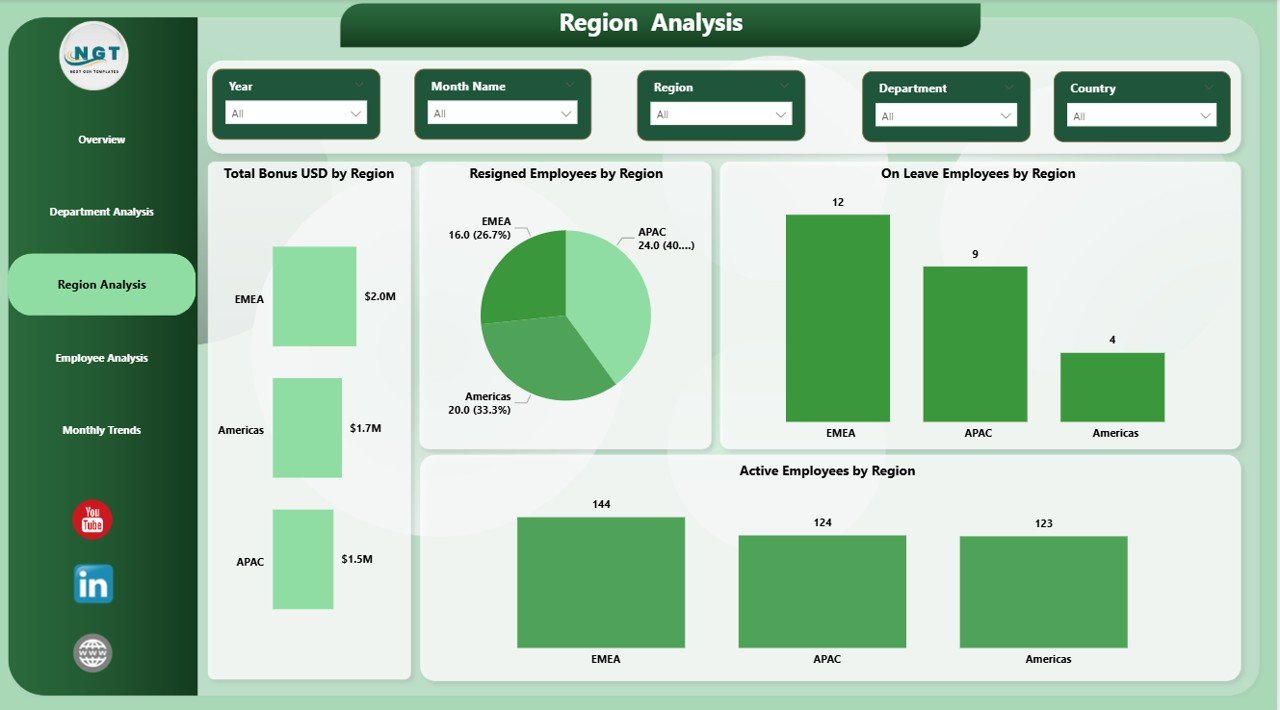
📄 Region Analysis Page
Geographical workforce insights covering resigned employees, active employees, and leave patterns by region.
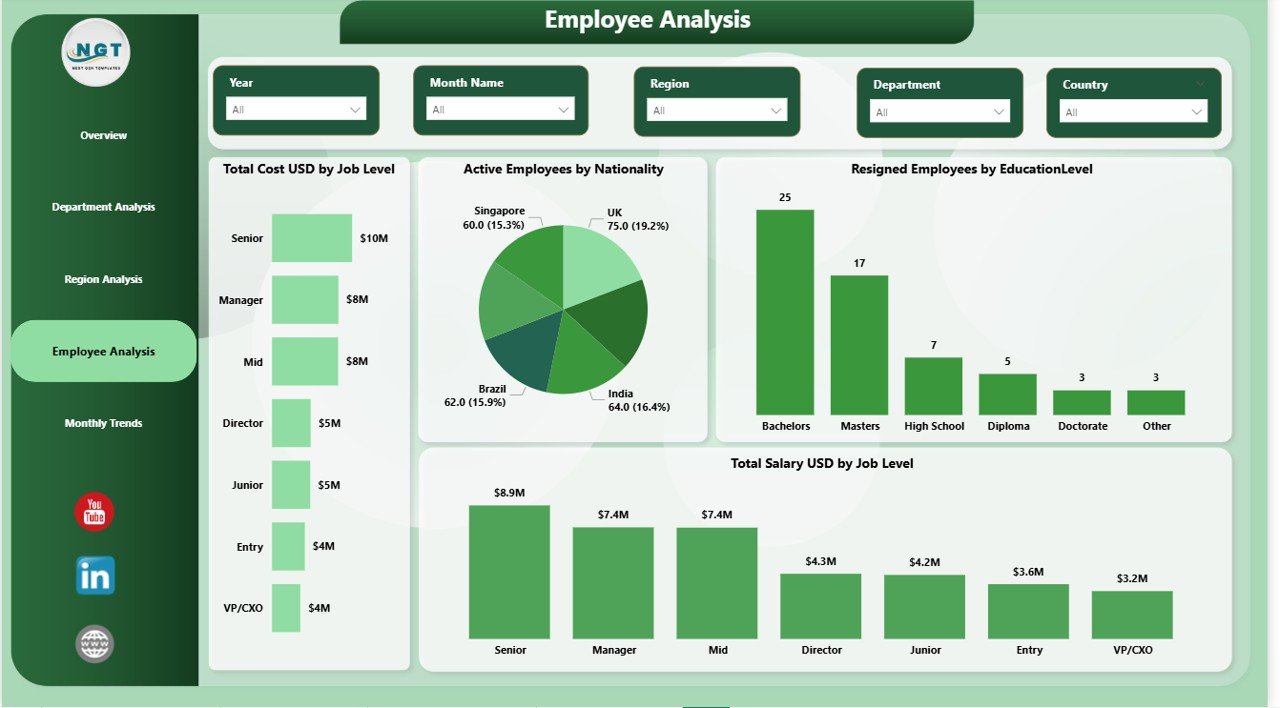
📄 Employee Analysis Page
Deep-dive analysis by job level, nationality, education level, and compensation structure.
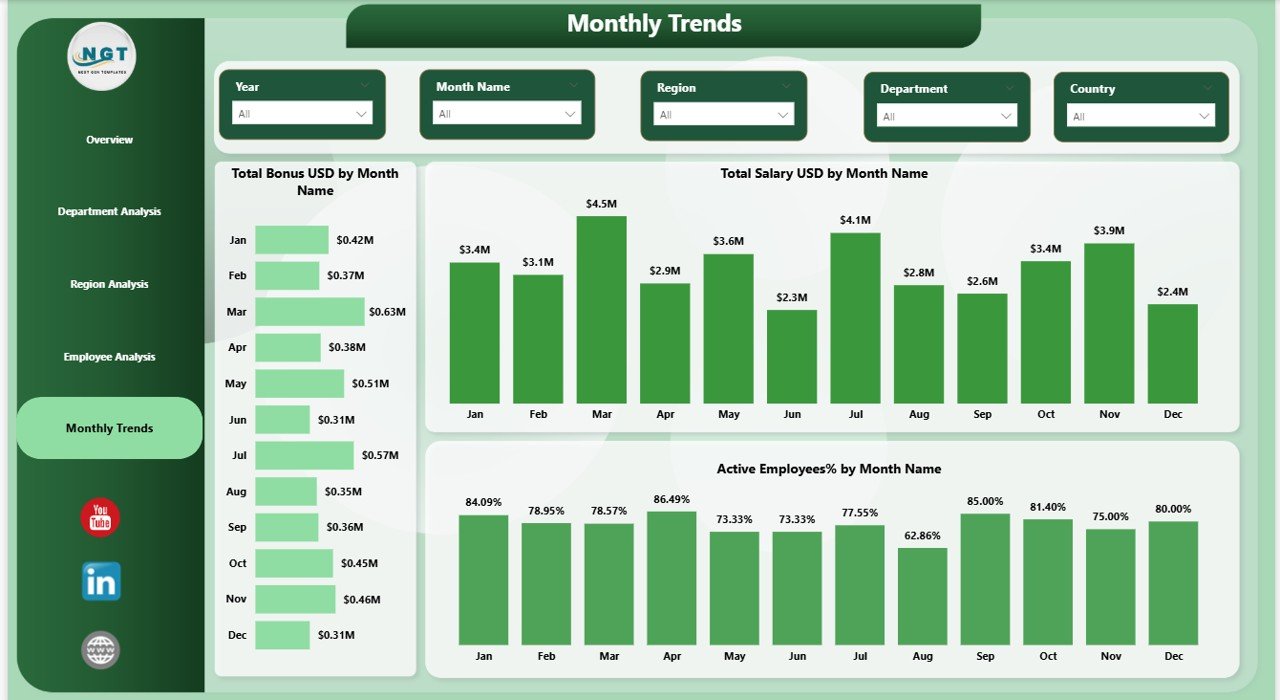
📄 Monthly Trends Page
Time-based analysis of salary, bonuses, and active employee percentage to identify patterns and seasonality.
📄 Clean & Professional Power BI Layout
Fully structured visuals designed for clarity, usability, and executive-level reporting.
🔹 How to Use the Employee Diversity Dashboard in Power BI
🧩 Step 1: Connect your HR or Excel-based employee data to Power BI
🧩 Step 2: Refresh the dataset to update all visuals automatically
🧩 Step 3: Use slicers to filter by department, region, or time
🧩 Step 4: Analyze diversity gaps, compensation patterns, and workforce trends
🧩 Step 5: Share insights with HR leaders and decision-makers
No advanced Power BI skills are required. The dashboard is designed to be user-friendly and intuitive.
🔹 Who Can Benefit from This Employee Diversity Dashboard
👩💼 HR Managers & HR Analysts
👔 CHROs & Leadership Teams
📊 Diversity & Inclusion Officers
🏢 Corporate HR Departments
📈 Business Analysts working with HR data
🏫 Small, Medium, and Large Organizations
If your organization wants better visibility, fairness, and inclusion in workforce management, this dashboard is built for you.
Click here to read the Detailed blog post
Watch the step-by-step video tutorial: