

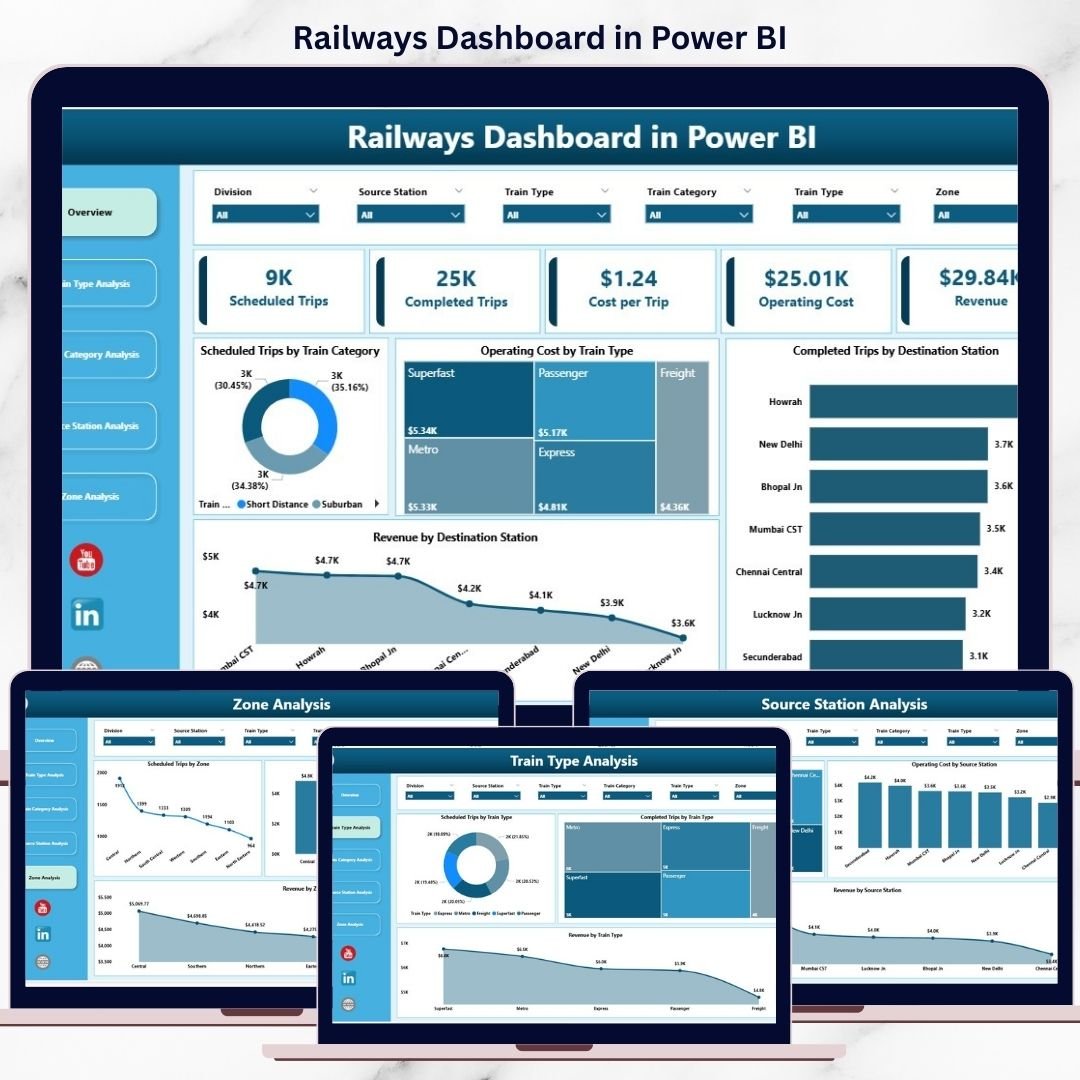

Managing railway operations without real-time visibility leads to delays, rising operating costs, and missed revenue opportunities. Railway networks handle thousands of trips, stations, zones, and train categories daily, making manual or static reporting ineffective.
That is exactly why the Railways Dashboard in Power BI becomes a powerful, scalable, and future-ready analytics solution.
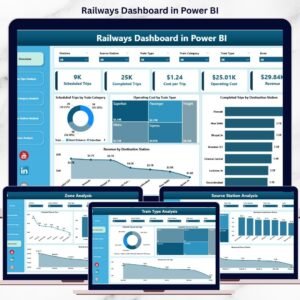
This ready-to-use Power BI dashboard converts complex railway data into interactive visuals, KPI cards, and slicer-driven insights. Instead of waiting for reports, decision-makers instantly track performance, compare costs, and analyze revenue across the entire railway network.
Whether you manage operations, planning, finance, or regional zones, this dashboard gives you clarity, control, and confidence—all in one Power BI report.
🚀 Key Features of Railways Dashboard in Power BI
📊 Centralized Railway Analytics – One dashboard, complete visibility
🚆 Train Type Performance Analysis – Compare efficiency and utilization
📦 Train Category Insights – Passenger vs Freight vs Express comparison
💰 Cost & Revenue Tracking – Identify high-cost and high-value areas
📍 Station-Level & Zone-Wise Analysis – Pinpoint performance gaps
🧭 Interactive Slicers – Filter instantly by train type, station, or zone
⚡ Real-Time Data Refresh – Always work with the latest numbers
📈 Scalable Power BI Model – Ready for future expansion
📦 What’s Inside the Railways Dashboard in Power BI
This dashboard includes 5 professionally designed analytical pages, each answering a specific business question.
🔹 Overview Page – Executive Control Center
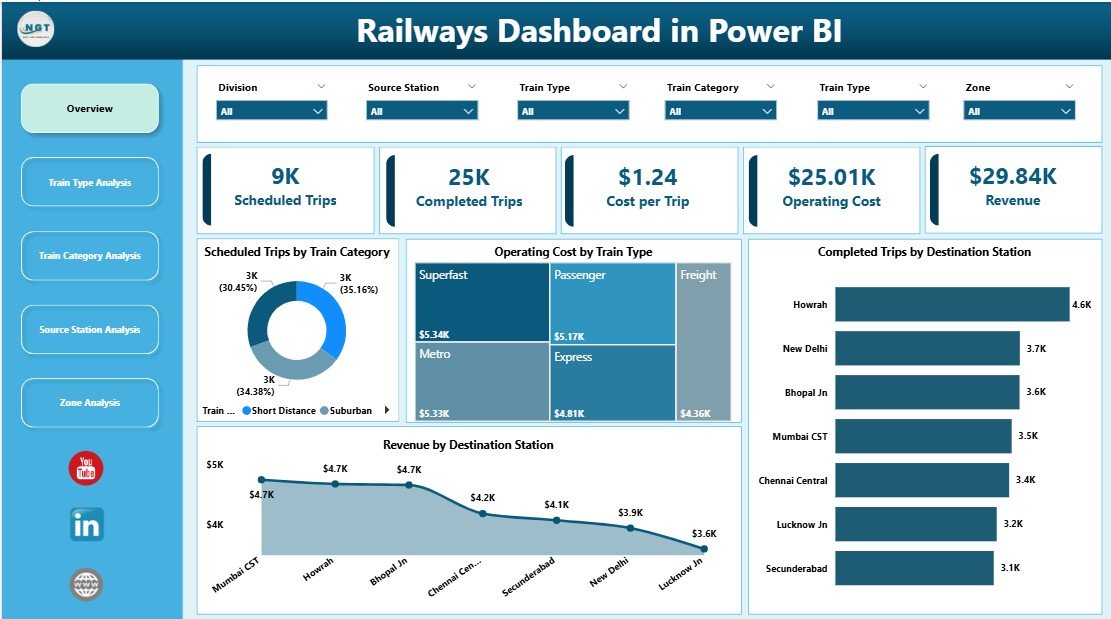
A high-level snapshot showing:
Scheduled Trips by Train Category
Operating Cost by Train Type
Completed Trips by Destination Station
Revenue by Destination Station
Perfect for leadership reviews and strategic discussions.
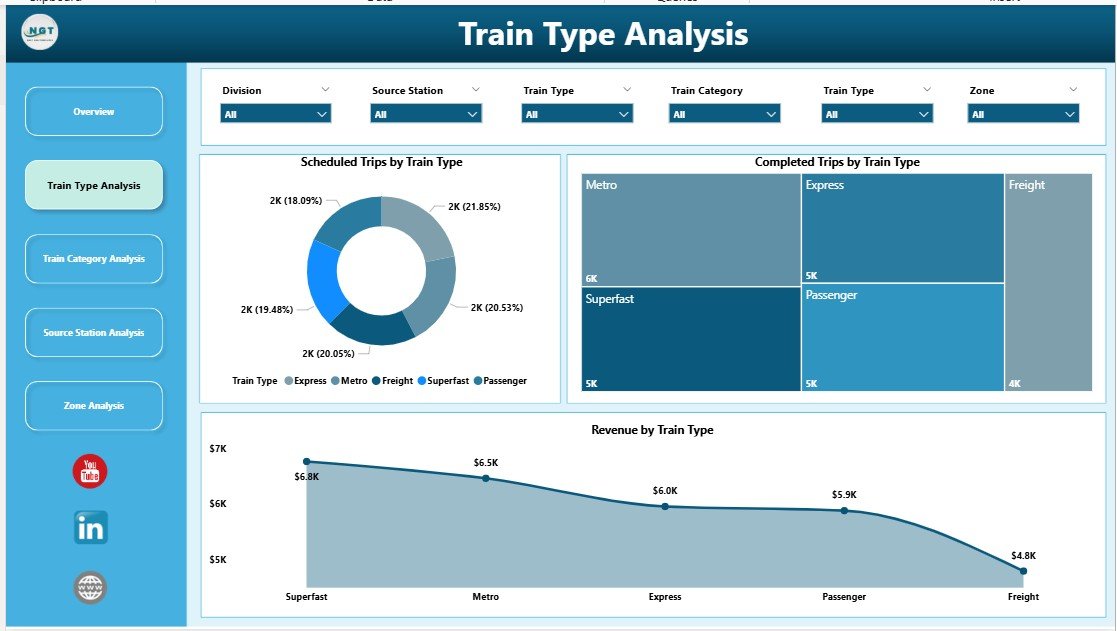
🔹 Train Type Analysis Page
Focuses on performance by train type:
Scheduled Trips by Train Type
Completed Trips by Train Type
Revenue by Train Type
Helps optimize deployment, scheduling, and resource planning.
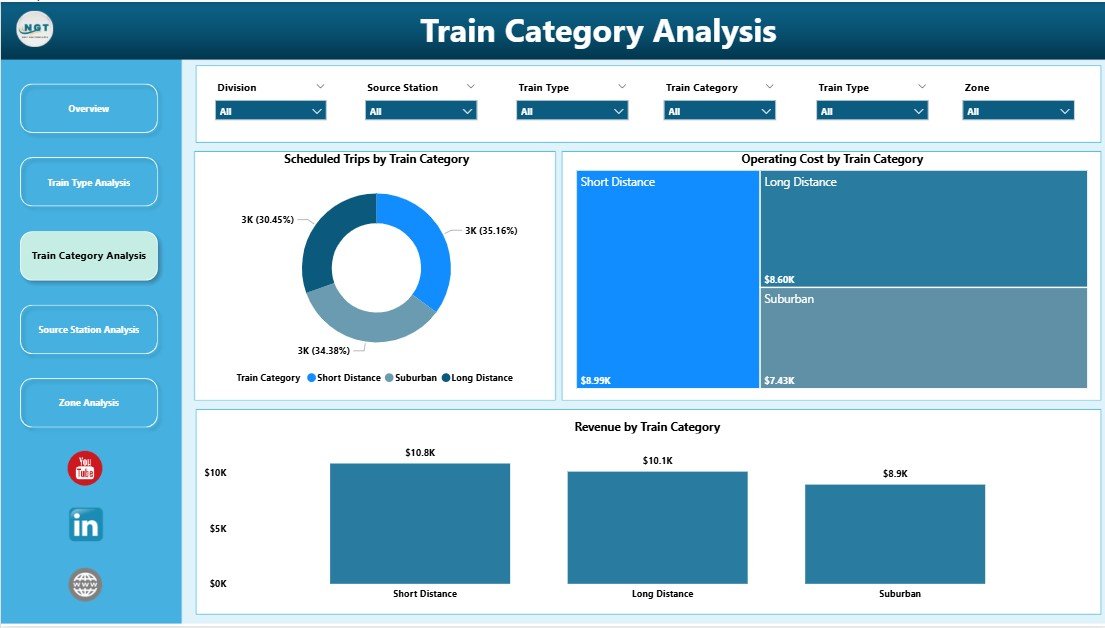
🔹 Train Category Analysis Page
Analyzes services by category:
Scheduled Trips by Train Category
Operating Cost by Train Category
Revenue by Train Category
Supports balanced decision-making between service quality and profitability.
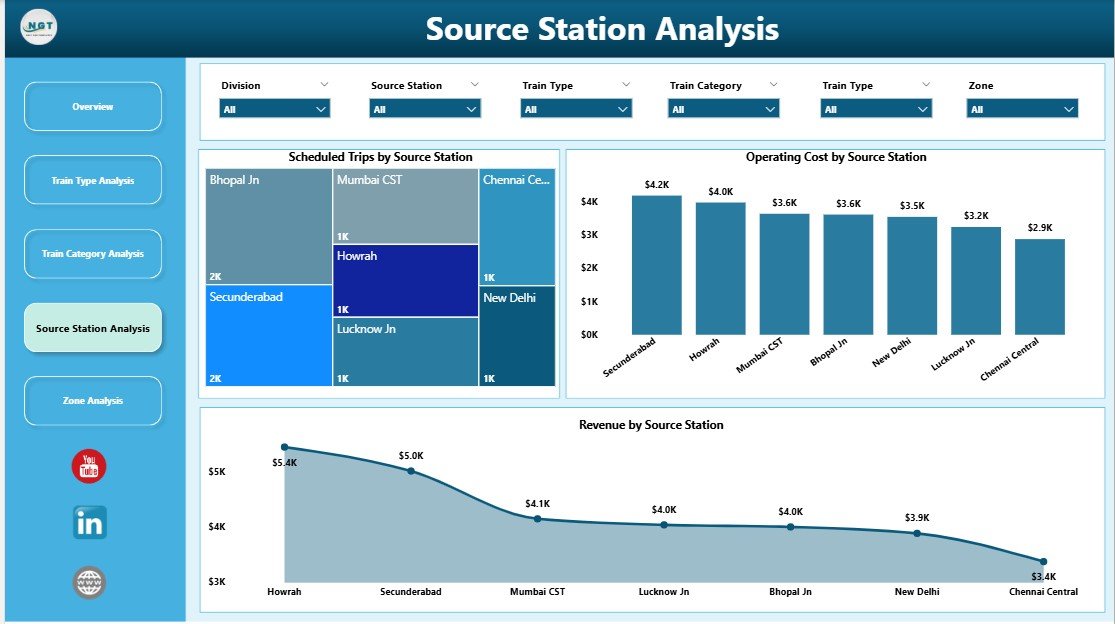
🔹 Source Station Analysis Page
Provides station-level insights:
Scheduled Trips by Source Station
Operating Cost by Source Station
Revenue by Source Station
Ideal for station planning and infrastructure investment decisions.
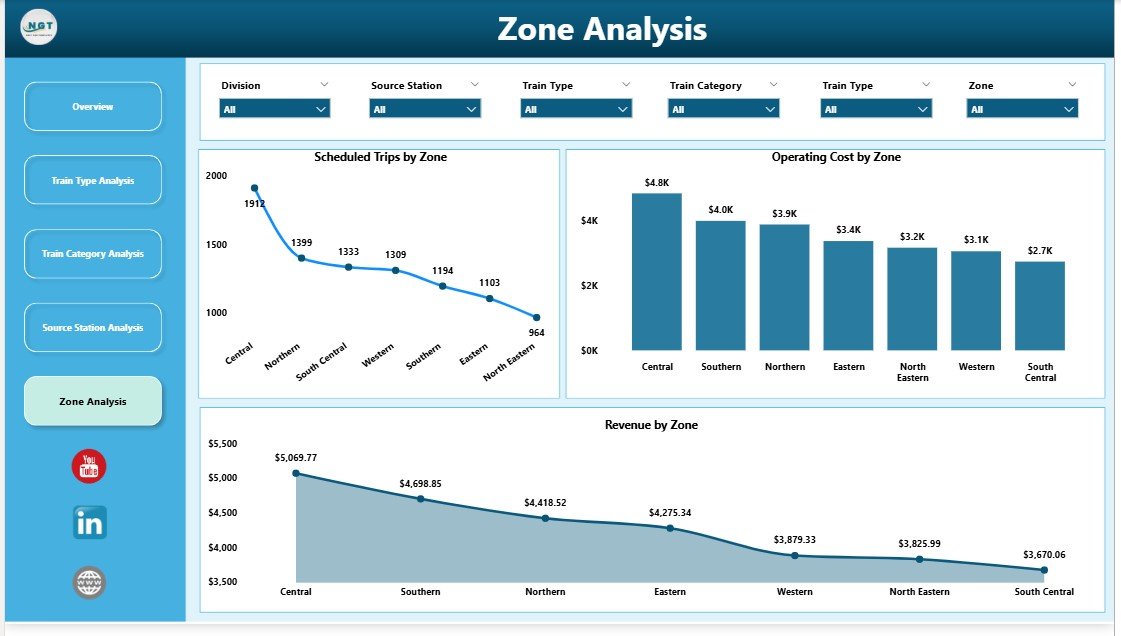
🔹 Zone Analysis Page
Evaluates regional performance:
Scheduled Trips by Zone
Operating Cost by Zone
Revenue by Zone
Enables zone-wise budgeting, benchmarking, and performance control.
🧠 How to Use the Railways Dashboard in Power BI
1️⃣ Connect railway data (Excel / database)
2️⃣ Refresh the Power BI dataset
3️⃣ Use slicers to filter by train type, station, or zone
4️⃣ Analyze KPIs and charts instantly
5️⃣ Share insights securely with stakeholders
No advanced Power BI skills required for end users.
👥 Who Can Benefit from This Dashboard?
🚆 Railway Operations Managers – Monitor trips and delays
📊 Planning & Scheduling Teams – Optimize routes and utilization
💰 Finance & Cost Controllers – Control operating expenses
📍 Zone & Regional Heads – Compare regional performance
🏛️ Government & Transport Authorities – Support policy decisions
📈 Business Analysts – Perform deep operational analysis
### 👉 Click here to read the Detailed Blog Post
🎥 Visit our YouTube channel to learn step-by-step video tutorials
https://www.youtube.com/@PKAnExcelExpert
Watch the step-by-step video tutorial:
Compatibility and Requirements
- Works in Power BI Desktop, which is free to download from Microsoft. Microsoft explains the install in Get Power BI Desktop.
- Connect your own railway data from Excel or a database, then refresh the dataset.
Frequently Asked Questions
How many pages does the dashboard have?
Five pages: Overview, Train Type Analysis, Train Category Analysis, Source Station Analysis and Zone Analysis.
What can I filter with the slicers?
You can filter by train type, station or zone, and every chart updates at once.
Which measures does it show?
Scheduled trips, completed trips, operating cost and revenue, split by train type, train category, source station, destination station and zone, depending on the page.
Where does the data come from?
You connect your own railway data, from Excel or a database, and refresh the Power BI dataset.
Is there an Excel or Google Sheets version?
Yes. See the Railways Dashboard in Excel and the Railways Dashboard in Google Sheets.
Related Railway Templates
- Railways Dashboard in Excel: the same dashboard for Excel
- Railways Dashboard in Google Sheets: the Google Sheets edition
- Railways KPI Dashboard in Power BI: a KPI view of railway performance
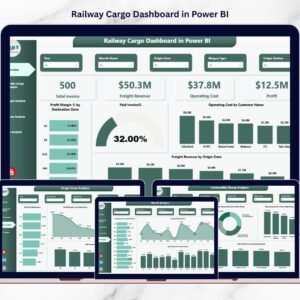
- Railway Cargo Dashboard in Power BI: for freight and cargo operations
- Power BI Dashboard Mega Collection: 15 Power BI dashboards in one download
Browse all Power BI dashboards.
































Reviews
There are no reviews yet.