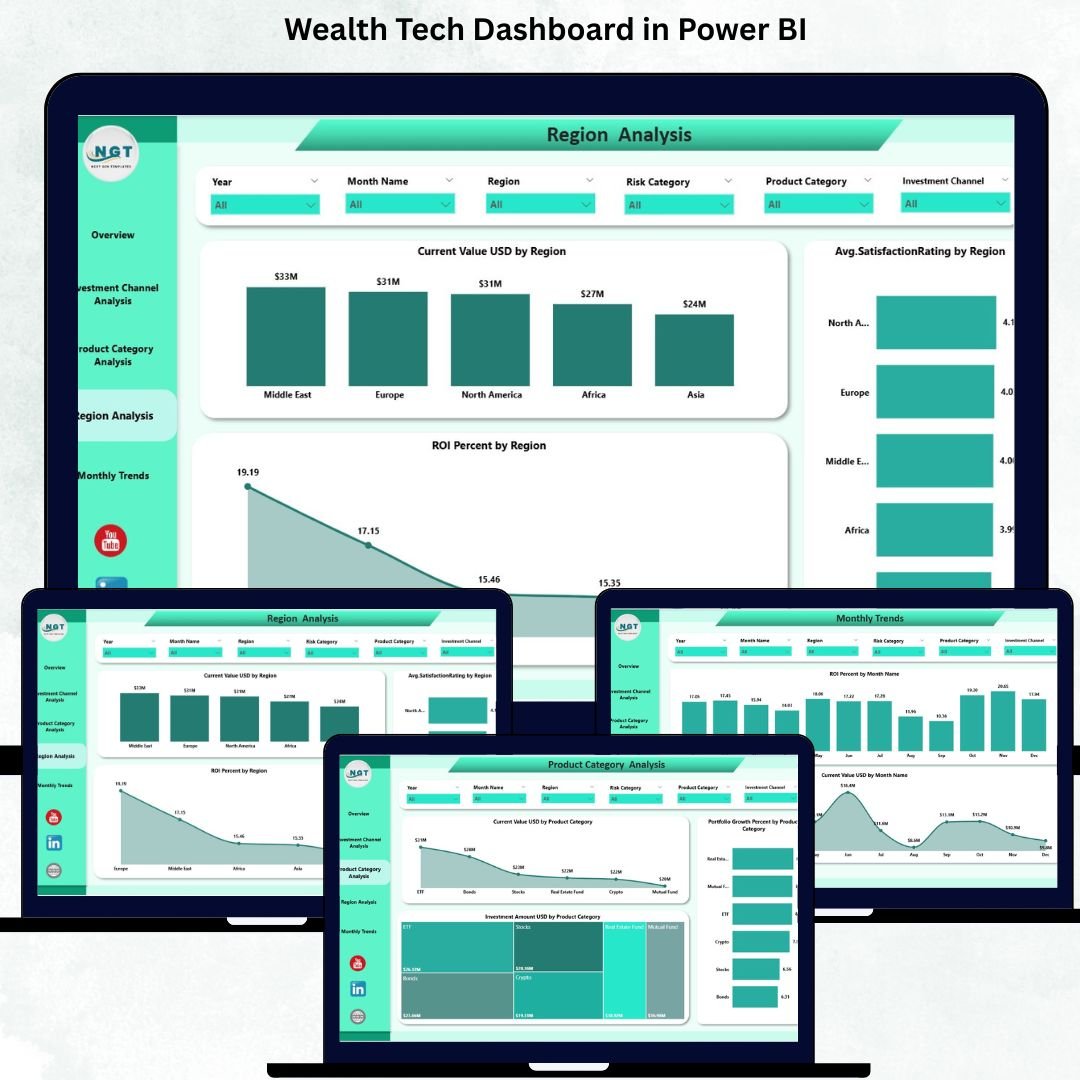
Managing wealth becomes easier, smarter, and more profitable when you have real-time visibility into your investments. Investors today deal with multiple products, channels, regions, and financial tools. Tracking ROI, monitoring risk exposure, reviewing growth, and evaluating satisfaction scores can quickly become overwhelming—especially when data sits in different spreadsheets or apps.
This is exactly where the Wealth Tech Dashboard in Power BI becomes a complete game-changer. Wealth Tech Dashboard in Power BI It centralizes all investment KPIs into one clean and interactive dashboard, helping investors and wealth managers make confident decisions. With dynamic filters, smart visuals, drill-down capabilities, and multi-page analytics, you can explore your financial performance from every angle within seconds.
Whether you manage your personal portfolio or handle investments for clients, this dashboard gives you the clarity, speed, and accuracy needed for smarter investment management.
✨ Key Features of the Wealth Tech Dashboard in Power BI
💰 Complete Investment Portfolio Monitoring
Track investment amount, current value, growth, ROI, satisfaction score, and risk levels—all in a single dashboard.
🎯 Smart KPI Cards for Instant Insights
Key performance cards show:
-
Current Value
-
Investment Amount
-
Portfolio Growth %
-
ROI %
-
Average Satisfaction Rating
These cards give you a quick snapshot of your overall financial health.
🧭 Dynamic Slicers for Fast Filtering
Filter the data by investment channel, region, month, or category to get deeper insights during review meetings.
📊 Powerful Multi-Page Visual Analytics
The dashboard includes dedicated pages for channels, categories, regions, and trends—making it easy to find hidden opportunities.
🔍 Drill-Down Insights
Go deeper into any metric to understand what drives ROI, growth, or customer satisfaction.
📈 Trend Analysis for Smarter Planning
Monthly charts reveal how your ROI and investment value evolve throughout the year, helping you plan long-term strategies.
🧮 Accurate, Automated Calculations
No more manual reporting—Power BI updates every KPI when you refresh your dataset.
📦 What’s Inside the Wealth Tech Dashboard in Power BI
Your Power BI file contains five structured pages, each designed to help you understand investments from different perspectives.
✔ Overview Page – Your Financial Snapshot
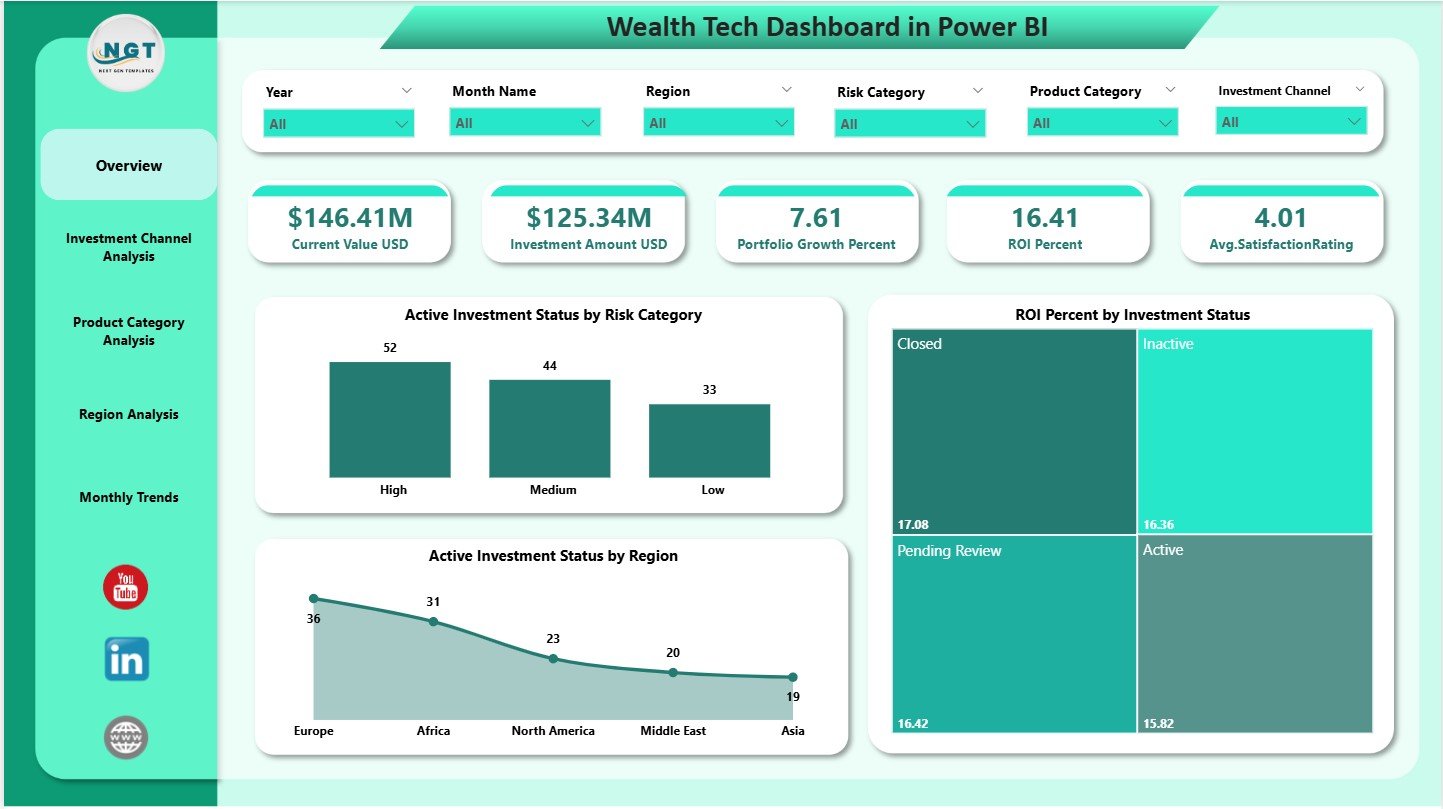
Includes all major KPI cards along with visuals that show:
-
Risk distribution
-
ROI by status
-
Active investment status by region
This page alone provides enough insights to conduct a complete portfolio review.
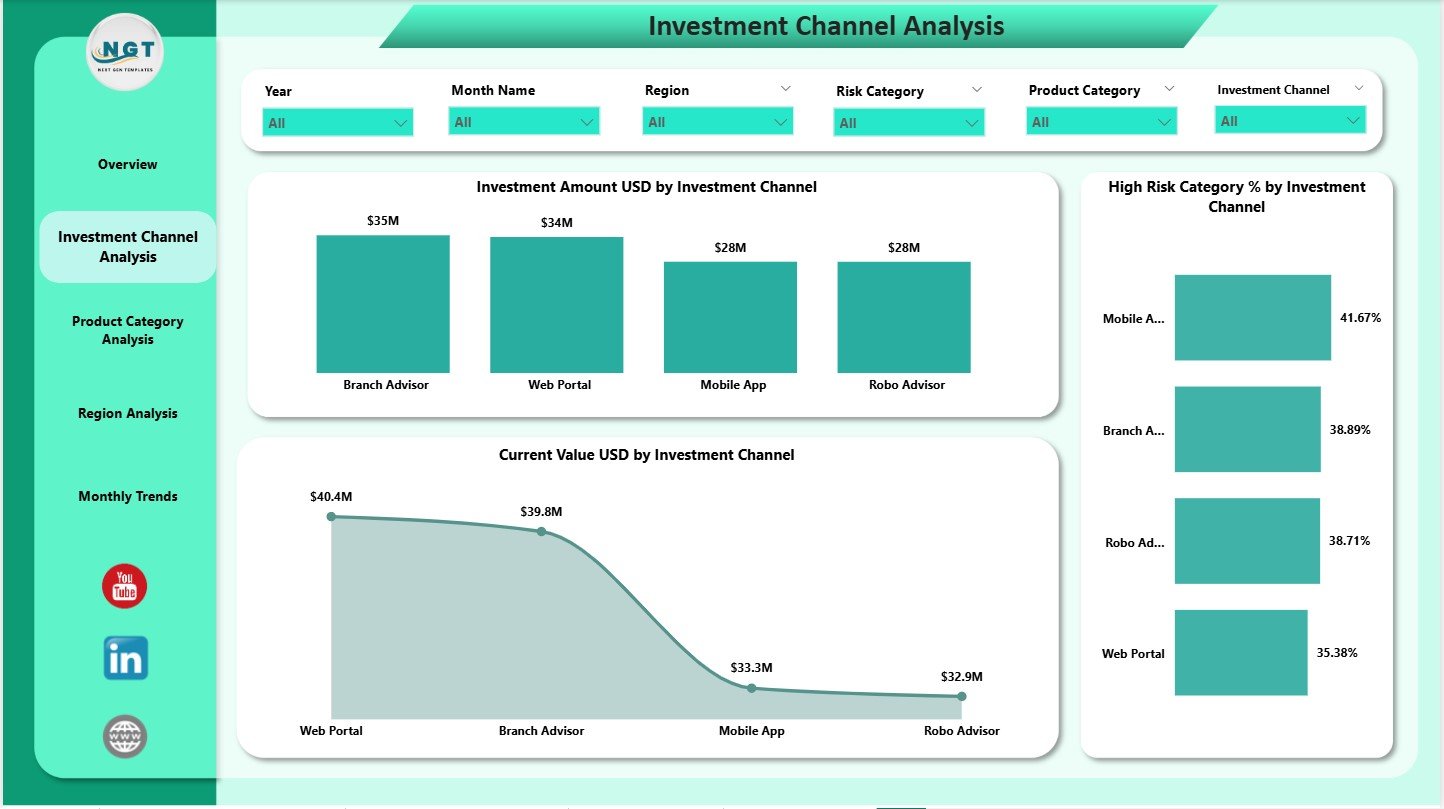
✔ Investment Channel Analysis Page
Understand which channels bring maximum investments, which ones are risky, and which contribute the most value.
Charts include:
-
Investment Amount by Channel
-
High Risk Category %
-
Current Value by Channel
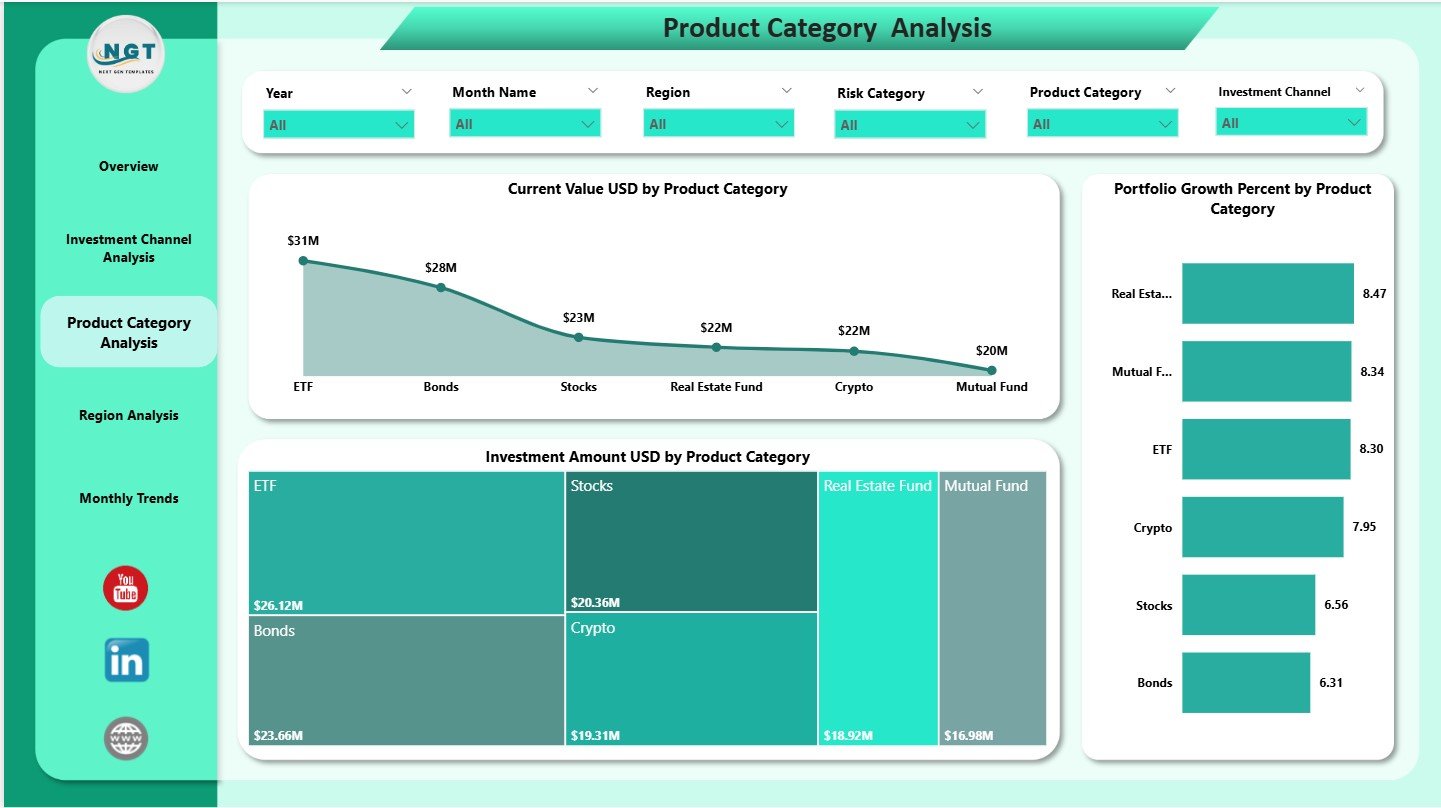
✔ Product Category Analysis Page
Explore performance across products like mutual funds, ETFs, bonds, insurance, retirement plans, and digital investments.
Charts reveal:
-
Current Value by Category
-
Portfolio Growth by Category
-
Investment Amount by Category
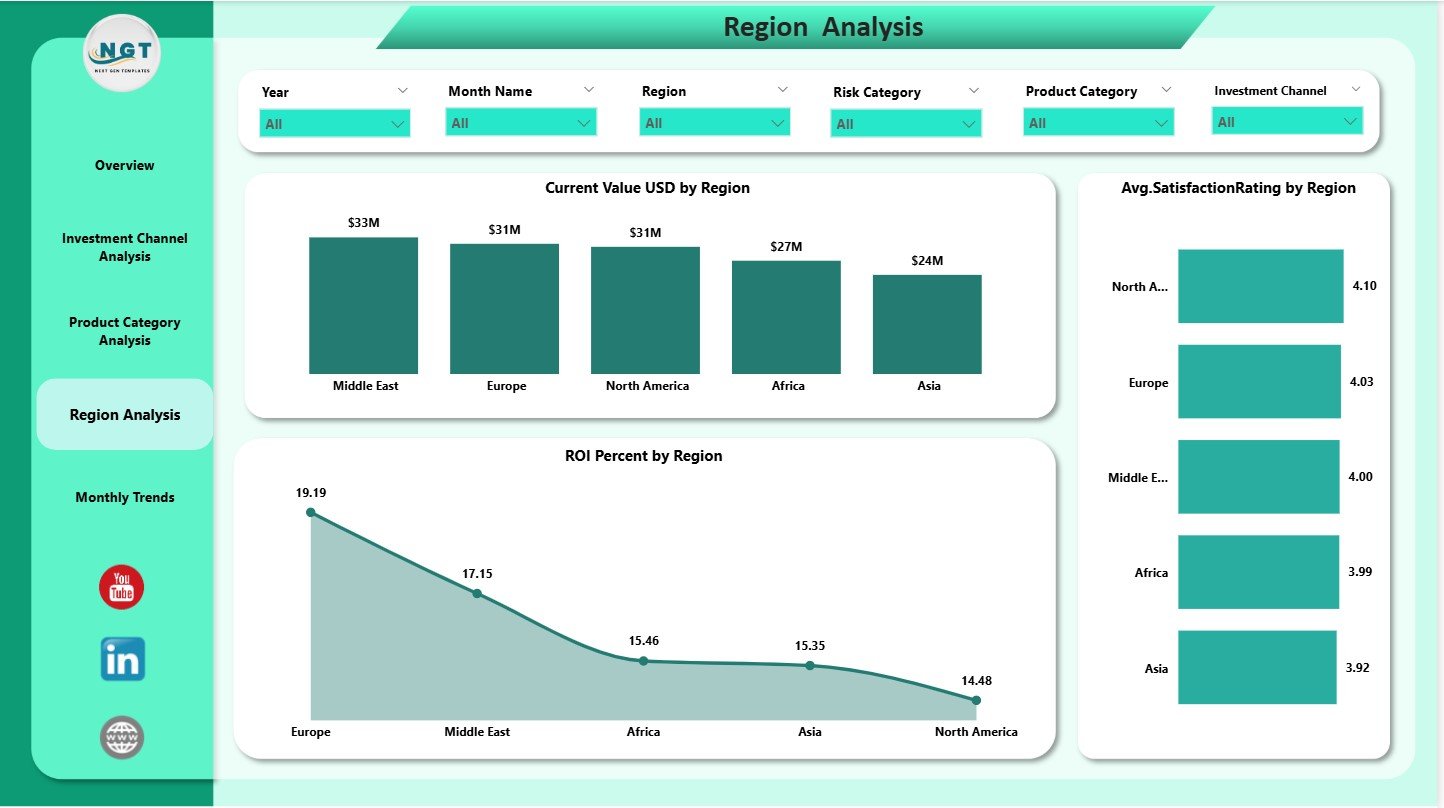
✔ Region Analysis Page
Compare regional performance with ease.
Includes:
-
Current Value by Region
-
Satisfaction Rating by Region
-
ROI % by region
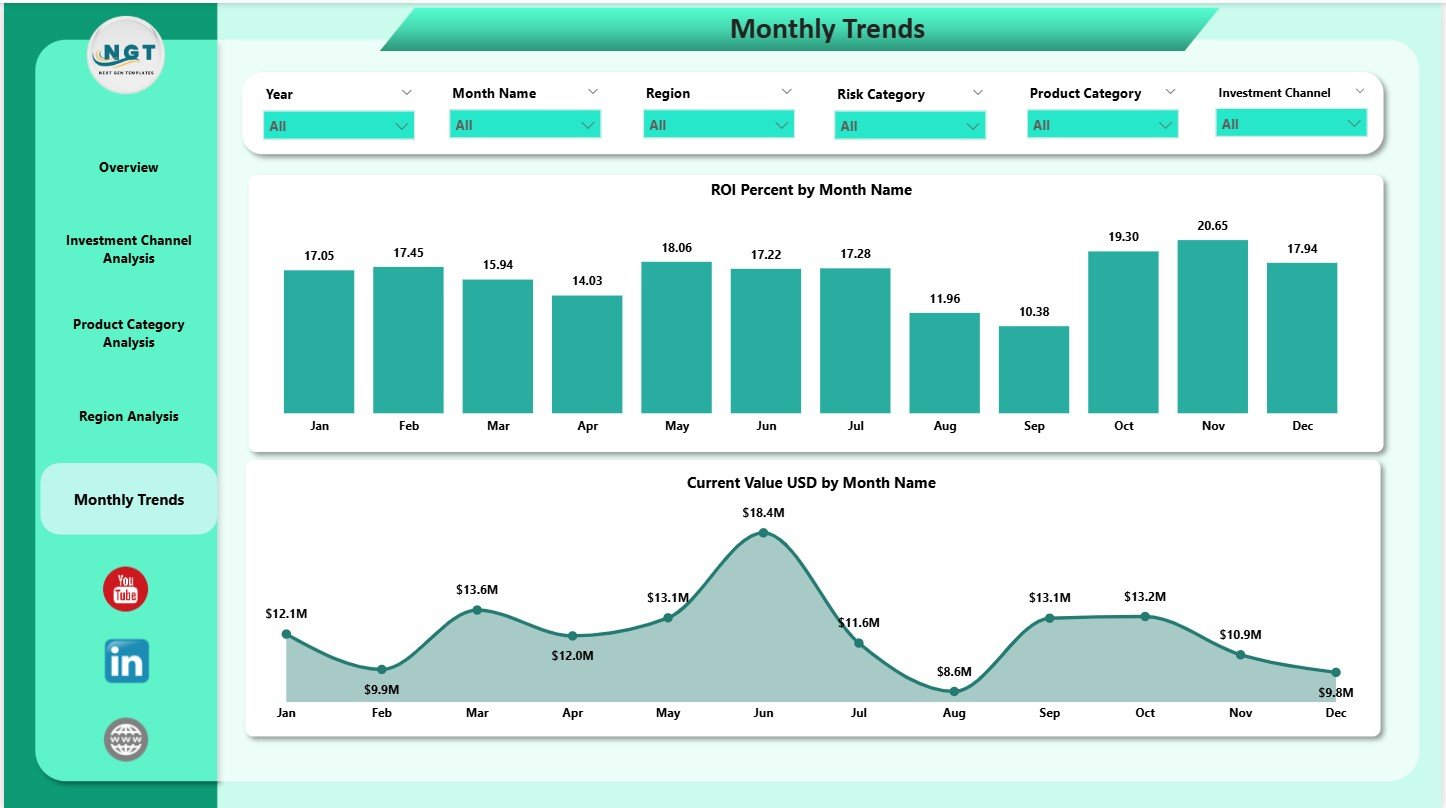
✔ Monthly Trends Page
Study how your portfolio behaves across months.
Charts show:
-
ROI (%) by Month
-
Current Value (USD) by Month
This page is essential for quarterly reviews and planning.
🛠 How to Use the Wealth Tech Dashboard in Power BI
Using the dashboard is simple, fast, and beginner-friendly:
➤ Step 1: Update Your Excel or Power BI Data Source
Enter updated investment amounts, ROI, risk levels, categories, channels, and regions.
➤ Step 2: Refresh the Dashboard
Power BI auto-updates all visuals and insights.
➤ Step 3: Use Slicers for Focused Analysis
Choose channels, months, or regions to zoom into specific performance areas.
➤ Step 4: Review Trend Charts
Study monthly ROI and current value trends for better decision-making.
➤ Step 5: Compare Categories and Regions
Identify which areas deliver the highest returns and which need improvement.
With this workflow, you get real-time clarity and a deeper understanding of your investment performance.
👥 Who Can Benefit from This Wealth Tech Dashboard in Power BI
This dashboard is ideal for anyone who manages or reviews investments:
💼 Wealth Managers & Financial Advisors
Analyze client portfolios with smart, visual insights.
🧑💼 Investment Analysts & Portfolio Managers
Track ROI, growth, and risk across multiple products and regions.
🏦 Banks & Financial Institutions
Monitor customer satisfaction, investment channels, and product performance.
🧑💻 Individual Investors
Understand your portfolio better and make smarter decisions.
📊 FinTech & Wealth Tech Platforms
Deliver transparent insights to clients with professional analytics.
If you want precise, fast, and visually rich investment performance tracking—this dashboard is the perfect tool.


Reviews
There are no reviews yet.