

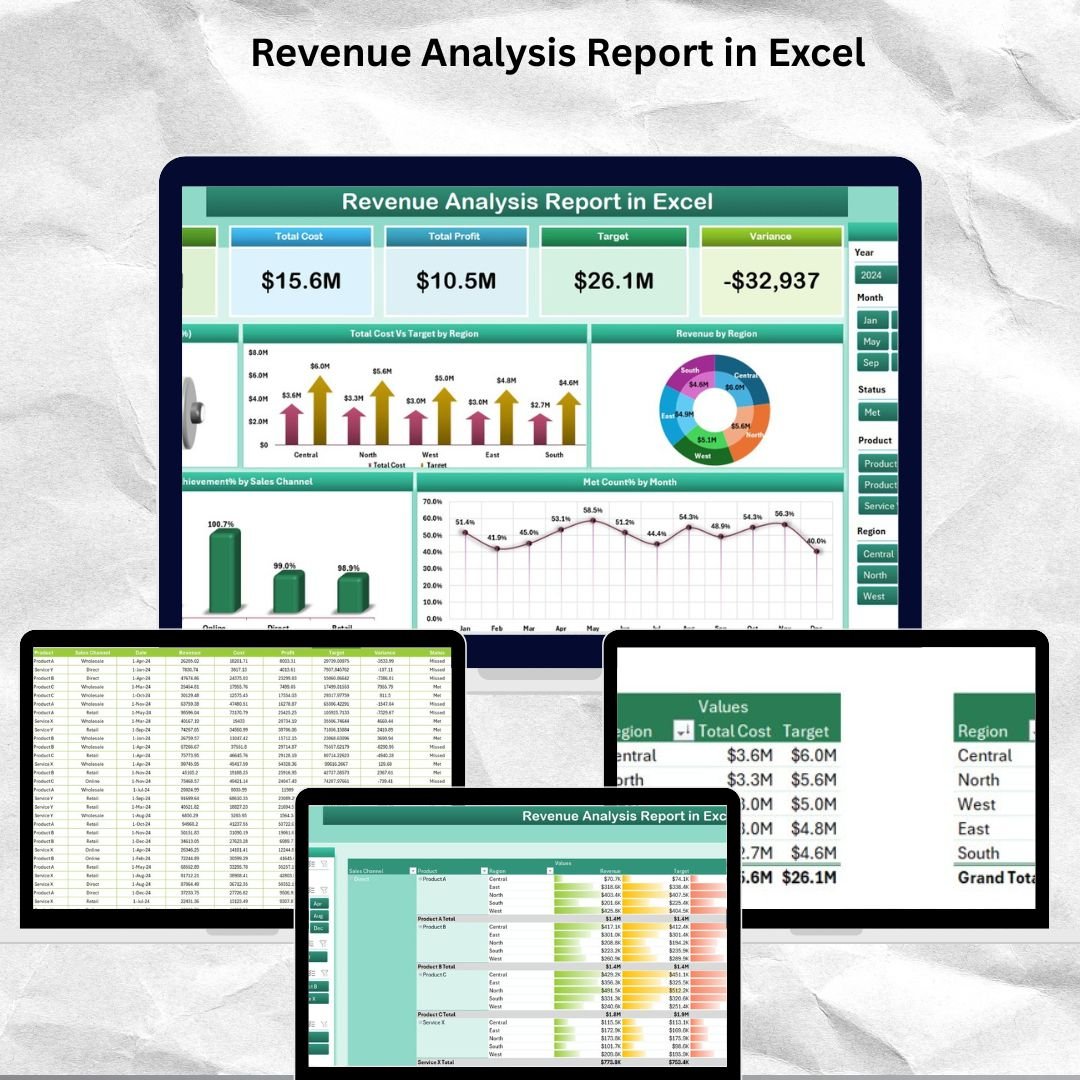

Revenue isn’t just a number—it’s the heartbeat of your business. Understanding where your revenue is coming from, how it’s performing against targets, and what trends are shaping your success can give you the edge in a competitive marketplace.
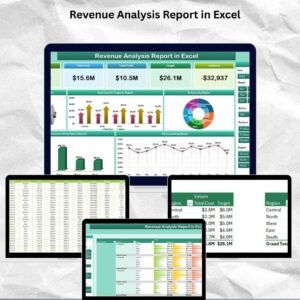
📊 Introducing the Revenue Analysis Report in Excel – a powerful, easy-to-use reporting template that turns your raw data into dynamic dashboards, helping you unlock financial insights without needing complex tools or software.
Whether you’re a finance analyst, business owner, or sales executive, this Excel-based report gives you everything you need to stay on top of your revenue performance.
✅ Key Features of Revenue Analysis Report in Excel
🏠 Summary Dashboard – View Big Picture Insights Instantly
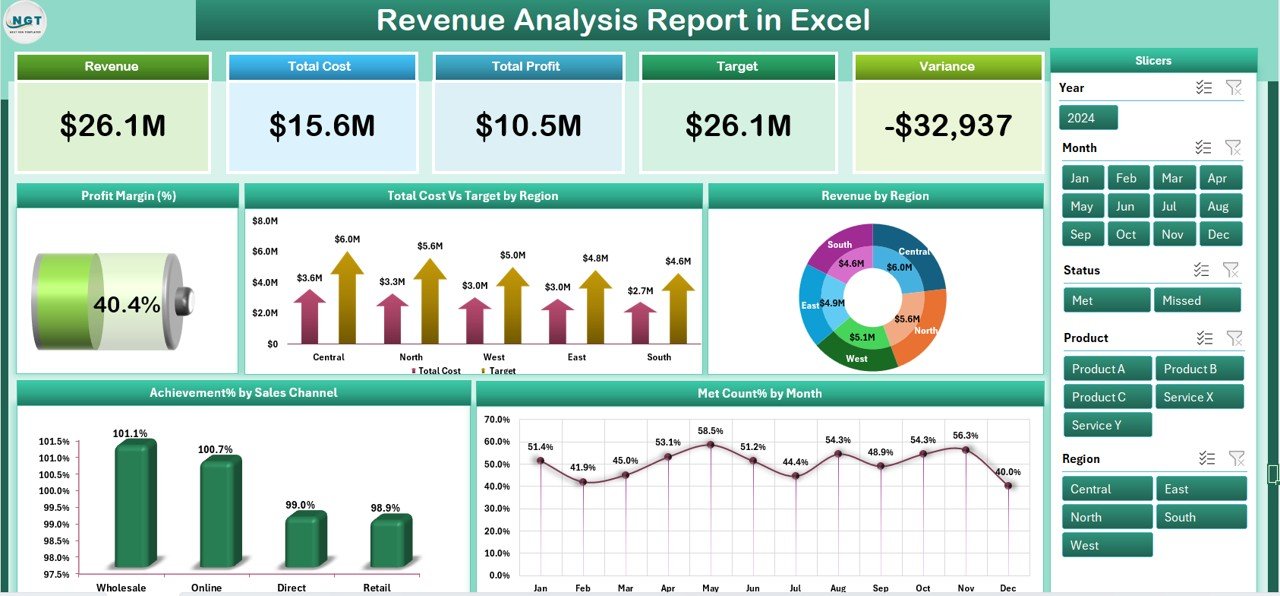
This is your command center. The Summary Page includes:
📌 Top 5 KPI Cards:
Total Revenue
Total Cost
Profit Margin (%)
Target Revenue
Variance
🎯 Slicers on the right: Filter by Region, Sales Channel, or Month
📈 5 Visual Charts:
Profit Margin %
Total Cost vs Target Revenue by Region
Revenue by Region
Achievement % by Sales Channel
Met Count % by Month
Get high-level clarity with just a few clicks.
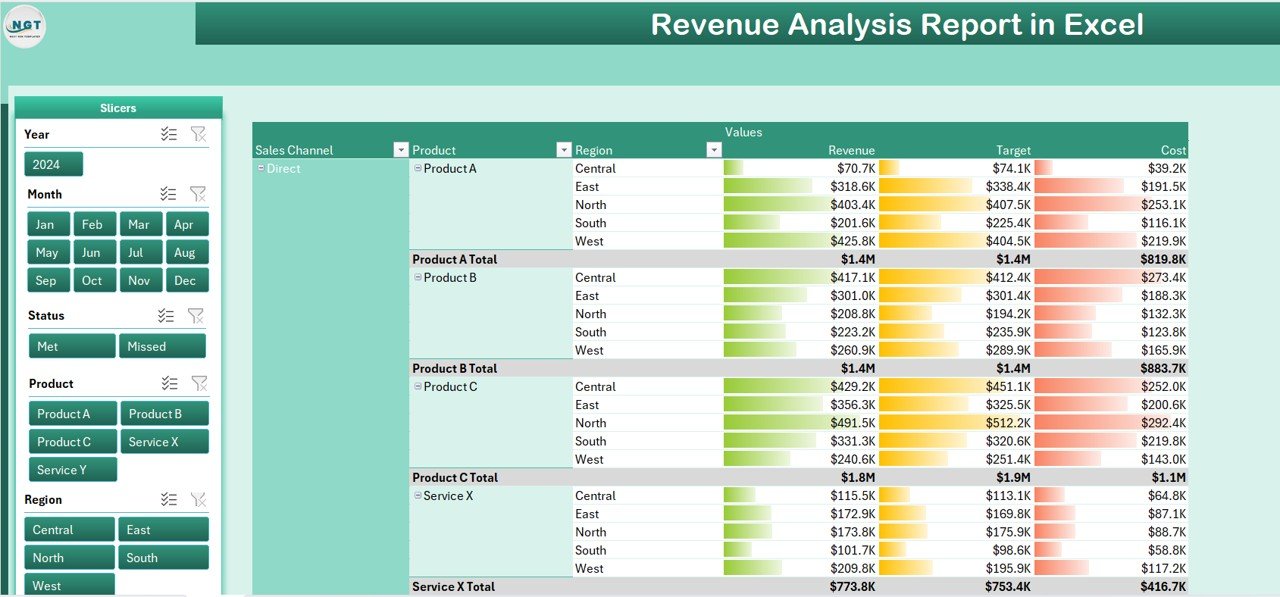
📑 Report Page – Deep Dive into Raw & Calculated Data
This page is perfect for in-depth analysis:
📍 Left-side Slicers for filtering
📊 A sortable and filterable Information Table showing:
Revenue
Cost
Target
Variance
Profit Margin
Ideal for financial analysts and management reviews.
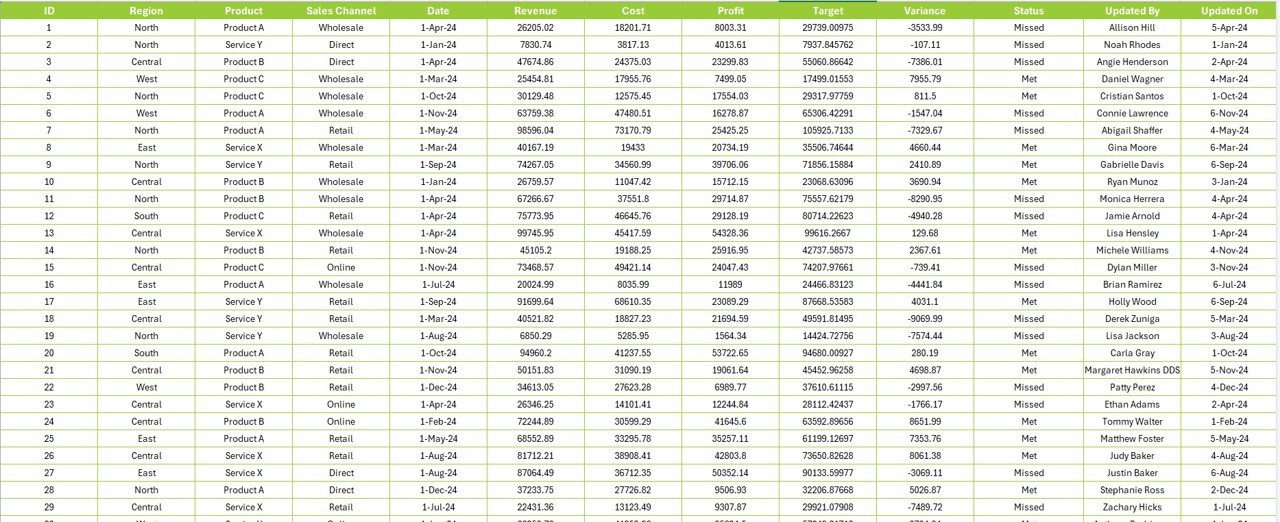
📂 Data Sheet – Your Source of Truth
All core data is stored here:
📅 Sales Date
🌍 Region
🛍️ Sales Channel
💵 Revenue
💰 Cost
🎯 Target Revenue
Paste or import your sales data here and watch the dashboard update automatically.
⚙️ Support Sheet – Manage Lookup Lists with Ease
Maintain data integrity with pre-set dropdown lists:
Regions
Sales Channels
Time periods
Customize it to fit your business model effortlessly.
📦 What’s Inside the Revenue Analysis Report?
✅ 4 Sheet Tabs:
Summary Page
Report Page
Data Sheet
Support Sheet
📊 Powered by:
Excel Tables & Pivot Charts
Slicers for interactivity
Dynamic KPI Cards
Built-in Excel formulas—no VBA needed!
💡 Fully customizable & compatible with Excel 2016 and later.
🛠️ How to Use the Revenue Analysis Report in Excel
📥 Download & Open the Excel file
📊 Paste Your Data into the Data Sheet
🧭 Use Slicers to filter views on the Summary or Report Page
📈 Review KPI Cards and Visuals
📤 Export or Share the insights with your team
Everything updates in real-time—no extra steps required!
👥 Who Can Benefit from This Dashboard?
💼 Business Owners
📊 Finance Analysts
🧑💻 Operations Managers
📈 Sales Executives
🏢 SMEs & Startups
🧾 Accountants & Consultants
If revenue matters to your role, this tool is a game-changer.
📚 Click here to read the Detailed blog post
📺 Visit our YouTube channel to learn step-by-step video tutorials






Reviews
There are no reviews yet.