

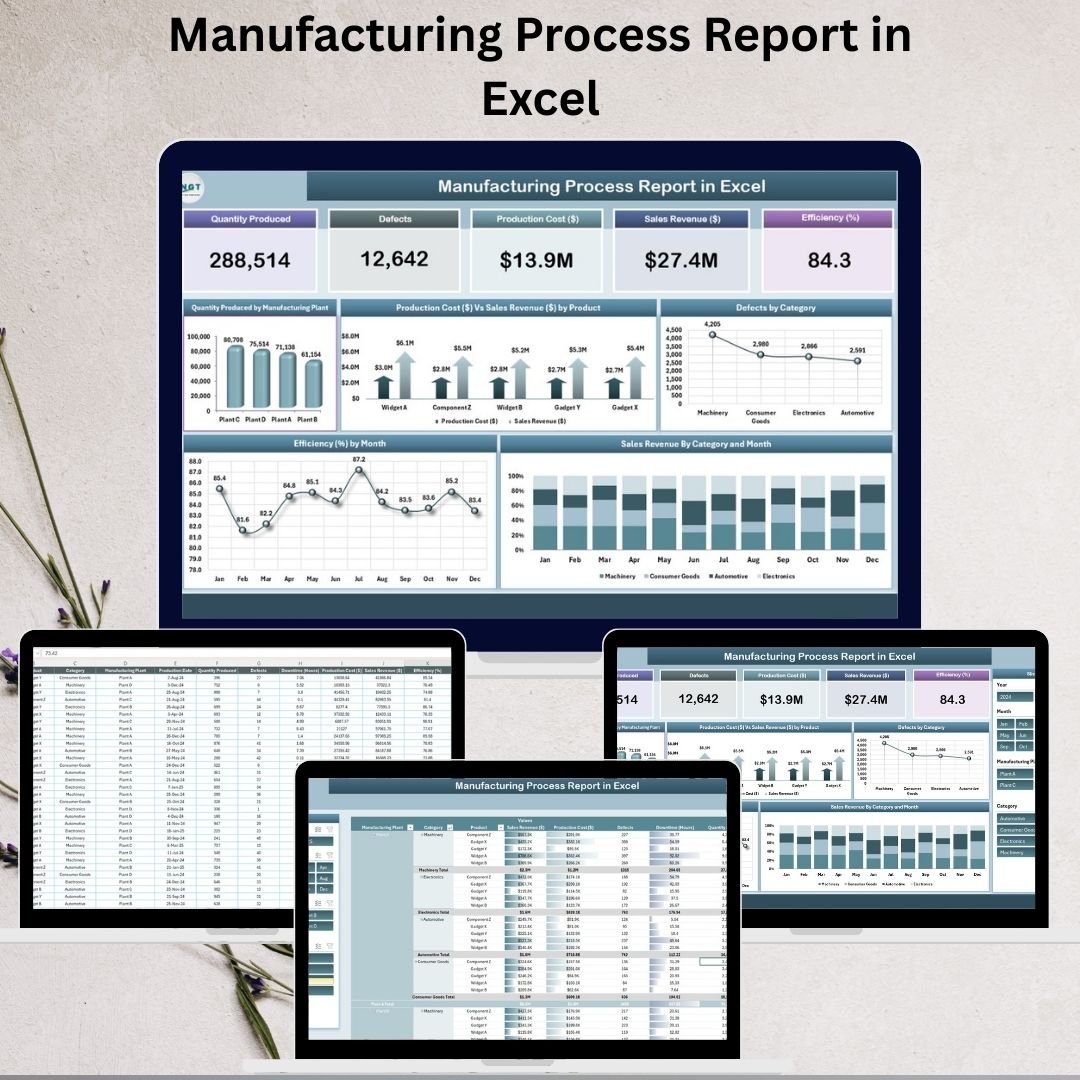

The Manufacturing Process Report in Excel is a powerful, ready-to-use reporting tool designed to help manufacturing companies track, monitor, and analyze their production performance in real-time. In today’s fast-paced manufacturing environment, efficiency, cost management, and quality control are essential for staying competitive. This tool provides a clear and structured way to evaluate production data, identify bottlenecks, and make informed decisions that boost profitability.
Whether you’re a plant manager, production supervisor, or business analyst, this report gives you actionable insights through easy-to-understand dashboards, interactive charts, and pivot-based analysis.
✨ Key Features of the Manufacturing Process Report in Excel
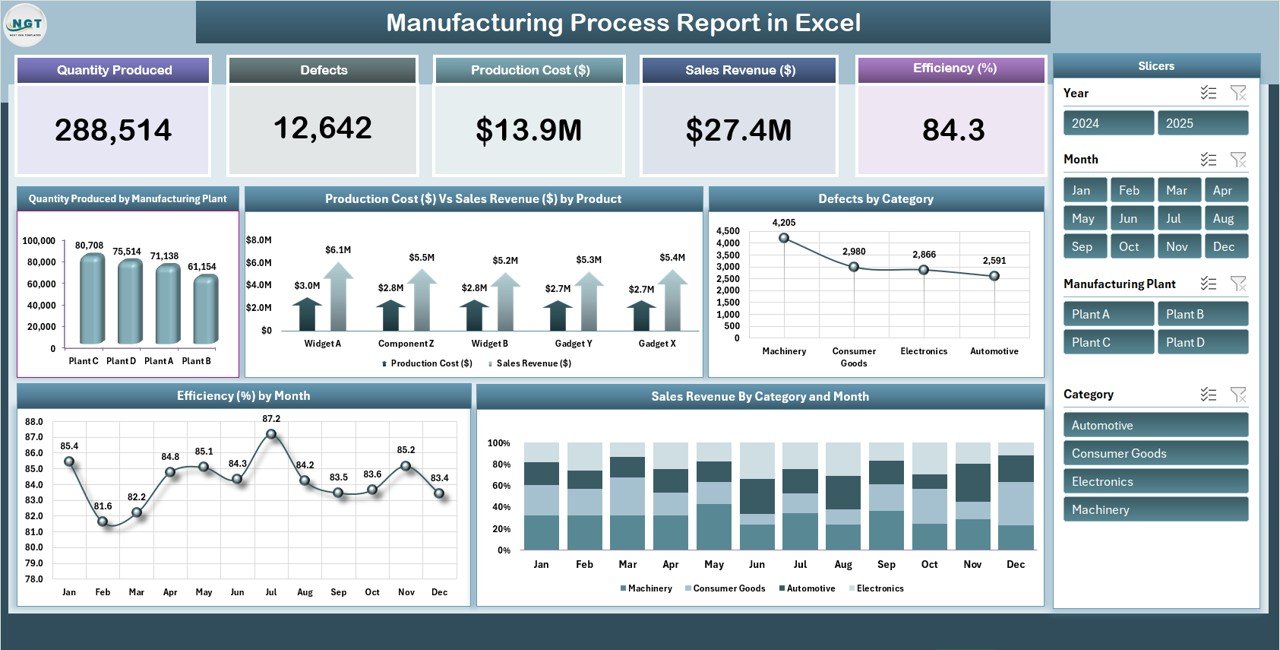
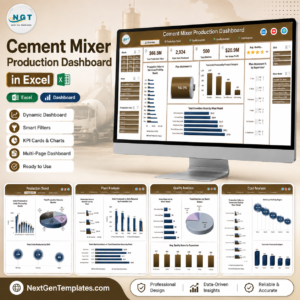
Summary Dashboard for Quick Insights
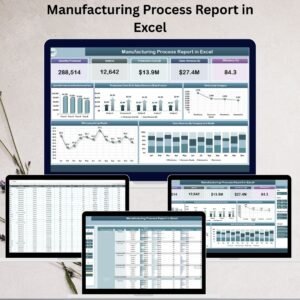
The summary sheet gives you a high-level overview of your manufacturing process. With key cards such as Quantity Produced, Defects, Production Cost, Sales Revenue, and Efficiency, you’ll always know the current state of operations at a glance.Interactive charts show:
Production quantity by plant
Cost vs. revenue comparisons by product
Defects categorized by type
Sales revenue trends by category and month
Efficiency percentage by month
✅ This ensures you can spot trends, detect inefficiencies, and act immediately.
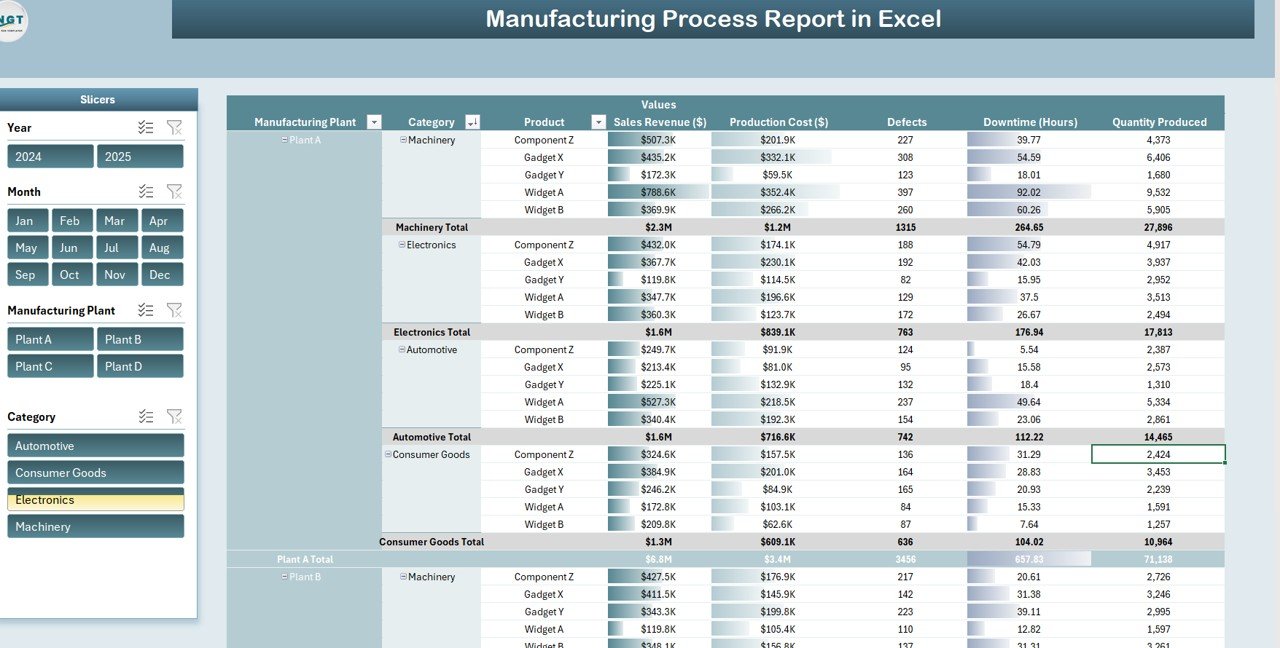
Detailed Reporting with Pivot Tables
The Report Sheet Tab uses pivot tables for in-depth analysis. You can filter and compare performance by product, plant, or time period. Managers can deep-dive into:Bottleneck identification
Departmental efficiency
Monthly and yearly performance comparisons
📊 Pivot flexibility means you can generate management-ready reports in just minutes.
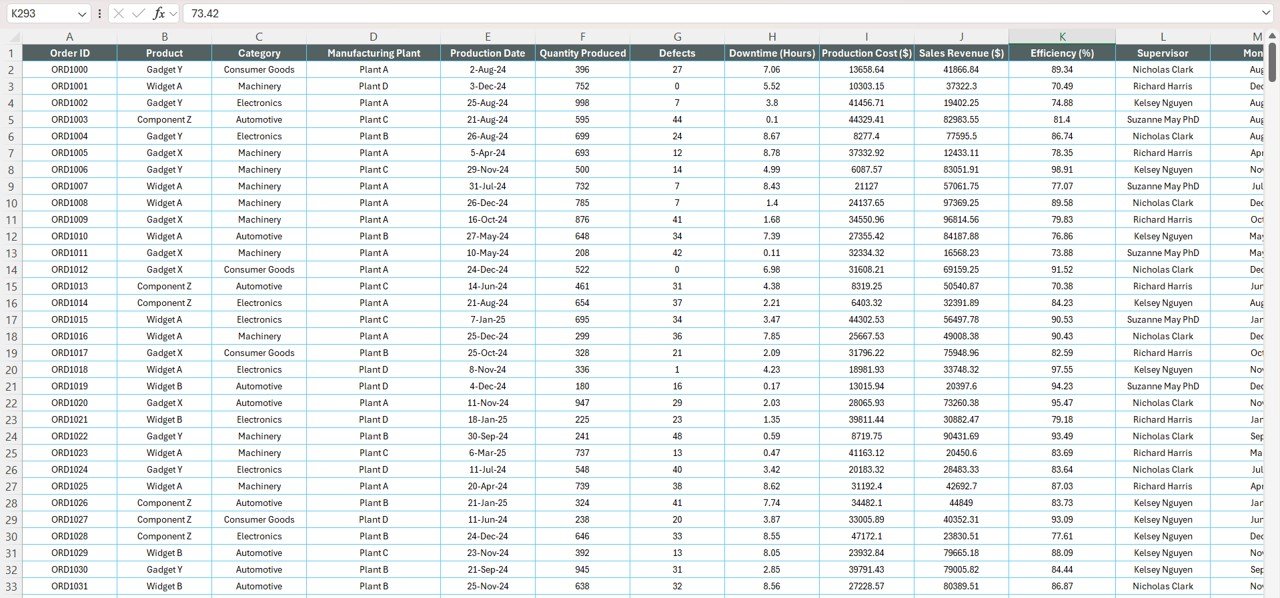
Centralized Data Management
The Data Sheet Tab is where you input daily production data. It captures:Units produced
Defects and categories
Production cost
Sales figures
This structured data automatically updates dashboards and reports — saving time and reducing errors.
📦 What’s Inside the Manufacturing Process Report
When you download this Excel-based tool, you’ll receive:
A pre-designed summary dashboard with interactive visuals.
A report sheet for customizable pivot table analysis.
A data input sheet to store and manage all manufacturing records.
It’s built to be plug-and-play: just input your data, and the dashboard instantly updates.
⚙️ How to Use the Manufacturing Process Report
Enter Data: Fill in daily or weekly records in the Data Sheet Tab.
Analyze Trends: Review the Summary Dashboard for quick insights.
Drill Deeper: Use the Report Tab pivot tables for custom views.
Take Action: Identify inefficiencies, reduce defects, and improve overall production efficiency.
No advanced Excel skills are needed — everything is automated and user-friendly.
👨🏭 Who Can Benefit from This Report?
This tool is perfect for:
Manufacturing Managers – Monitor multiple plants and streamline production.
Supervisors – Track daily performance and ensure production goals are met.
Quality Control Teams – Identify recurring defect patterns and implement solutions.
Business Analysts – Analyze costs, revenue, and efficiency for data-driven decision-making.
Executives – Get a clear overview of profitability and efficiency across operations.
🚀 Benefits of Using the Manufacturing Process Report
Improved Visibility: Monitor KPIs like production output, costs, and efficiency.
Data-Driven Decisions: Identify trends and act quickly to address inefficiencies.
Enhanced Quality Control: Detect defects early and prevent recurring issues.
Time Savings: Automated dashboards mean no more manual reporting.
Customizable: Modify KPIs and charts to suit your plant’s unique needs.
📌 Click here to read the Detailed Blog Post
Watch the step-by-step video Demo:













Reviews
There are no reviews yet.