

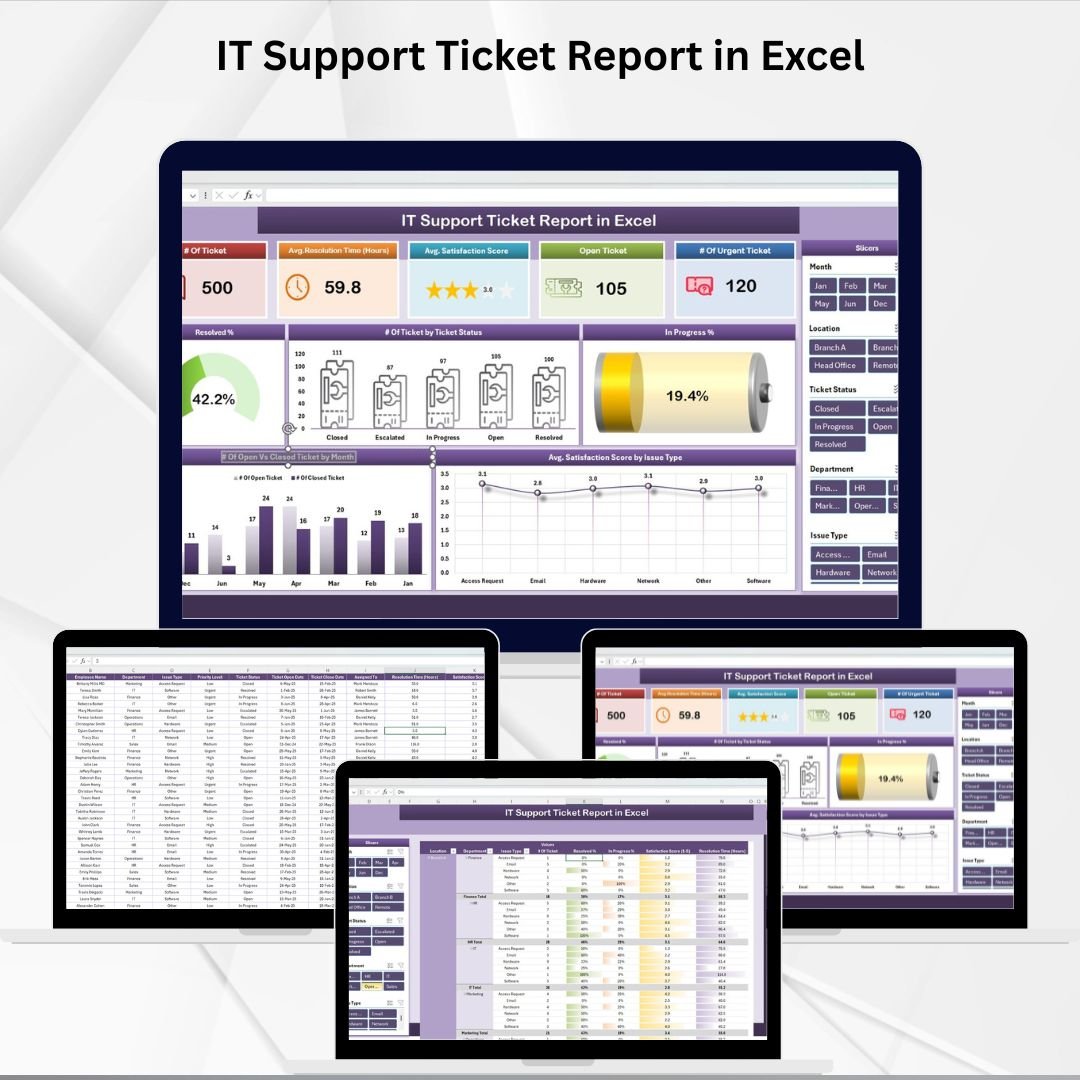
Efficient IT support management is the backbone of smooth business operations. Delays in resolving issues can lead to downtime, employee frustration, and reduced productivity. To address this, the IT Support Ticket Report in Excel provides a ready-to-use, interactive solution that allows IT managers and support teams to monitor key metrics, analyze trends, and improve service delivery.
This template is built with dynamic dashboards, cards, charts, and Power Pivot capabilities—all within Excel—so you can track tickets, resolution efficiency, and satisfaction levels in real time. Whether you’re leading a corporate IT team or managing support for a small business, this report helps you turn raw data into actionable insights.
🔑 Key Features of IT Support Ticket Report
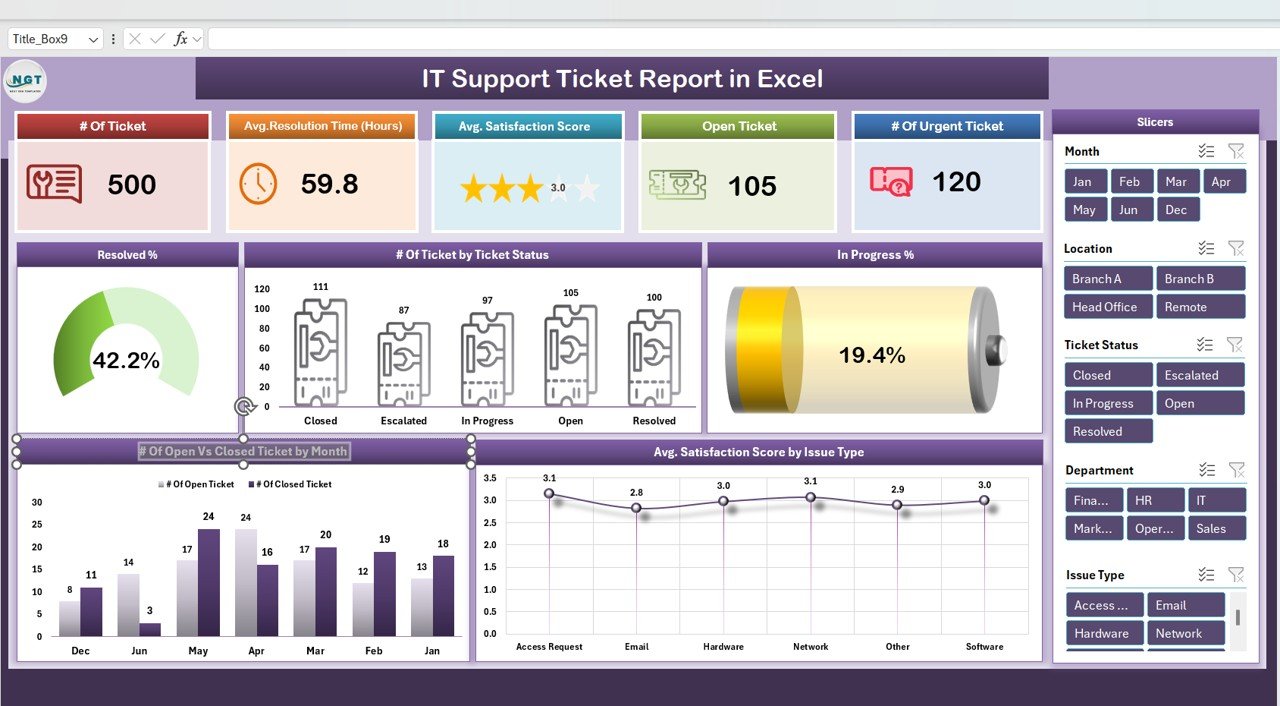
📊 Overview Page
Cards Display:
Total Tickets Logged
Average Resolution Time (Hours)
Average Satisfaction Score
Open Tickets
Urgent Tickets
Charts Included:
Resolved % vs In Progress %
Ticket Status Breakdown
Avg. Satisfaction Score by Issue Type
Open vs Closed Tickets by Month
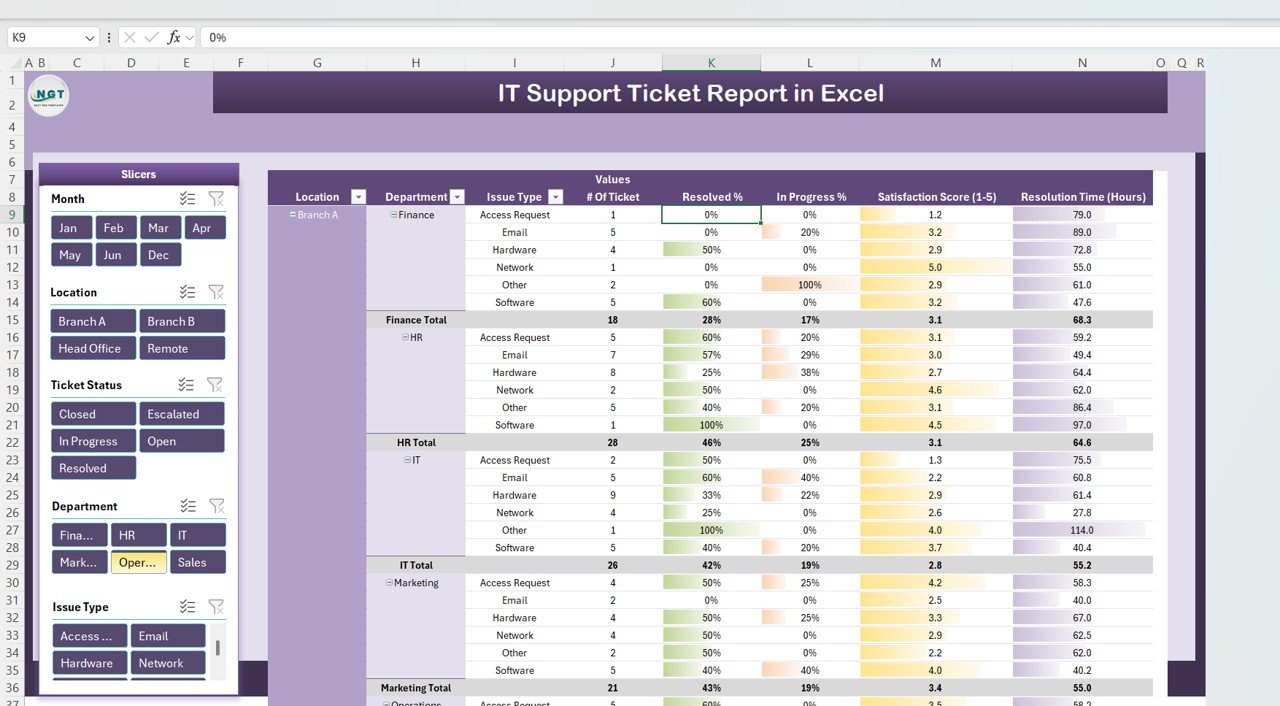
📈 Report Sheet (Power Pivot View)
Filter tickets by status, priority, department, or technician
Drill down into multi-dimensional analytics
Handle large datasets efficiently without lag
Generate ad-hoc reports for leadership
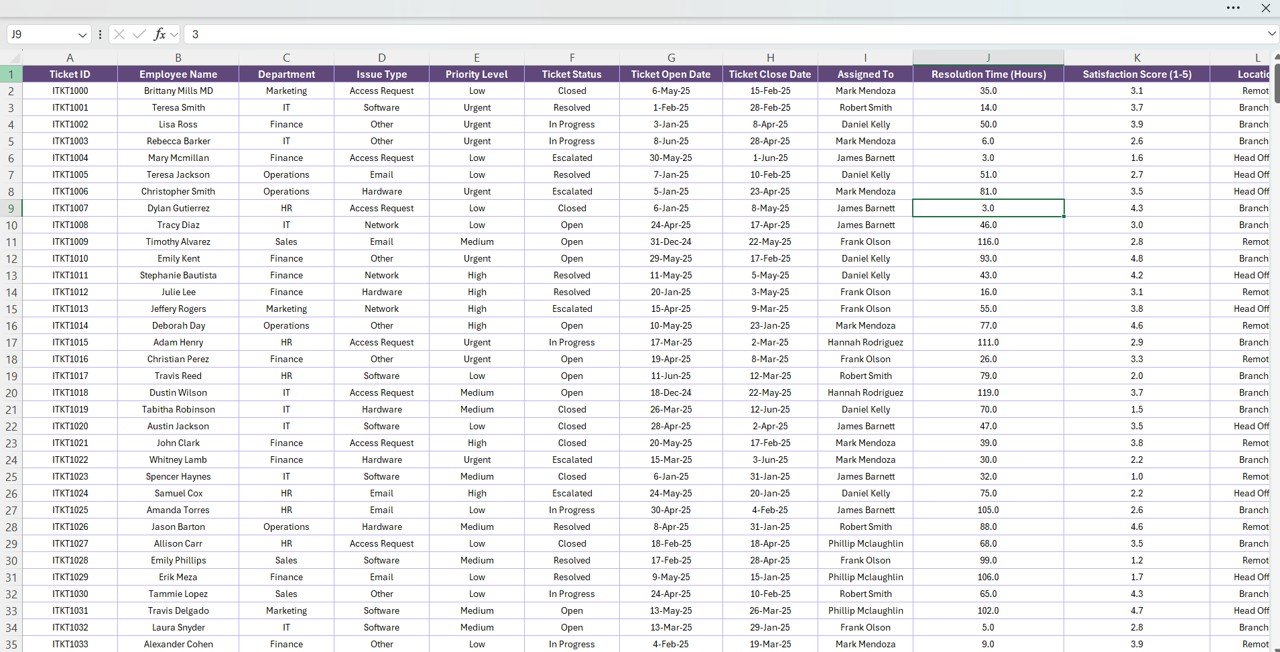
🧾 Data Sheet
Capture all ticket details including:
Ticket ID, Employee, Department
Issue Type, Priority, Status
Open/Close Dates
Assigned Technician
Resolution Time & Satisfaction Score
Automatically updates charts & KPIs
📦 What’s Inside the Report
✅ 3 Structured Tabs – Overview, Report (Pivot View), Data Sheet
✅ Comprehensive KPIs – Monitor resolution time, satisfaction, urgent tickets
✅ Interactive Visuals – Auto-updating charts and cards
✅ Power Pivot Analytics – Slice and dice data with ease
✅ Scalable Design – Works for small and large IT teams
👥 Who Can Benefit from This Report?
👨💻 IT Support Teams – Track daily performance and prioritize urgent issues.
👩💼 IT Managers – Gain visibility into bottlenecks and efficiency metrics.
🏢 Organizations – Improve employee satisfaction by reducing downtime.
📊 Decision Makers – Make data-driven IT resource planning decisions.
📋 Best Practices for Using the Report
🔄 Update Ticket Data Regularly – Keep inputs consistent for accurate analysis.
🎯 Monitor Key KPIs – Pay attention to resolution times and urgent tickets.
📊 Use Power Pivot Filters – Compare by department, technician, or issue type.
🚨 Focus on Urgent Tickets – Maintain SLA compliance by resolving them quickly.
📢 Share Reports with Leadership – Present trends to drive improvements.
✅ Advantages of IT Support Ticket Report
Centralized Tracking – All ticket details in one Excel file
Quick Insights – Cards and charts for instant visibility
Performance Monitoring – Identify top-performing technicians and departments
Trend Analysis – Spot recurring issues and plan resources better
Scalable – Efficiently handles growing ticket volumes
Cost-Effective – No need for expensive ITSM tools
🔗 Click here to read the Detailed blog post
Watch the step-by-step video Demo:



Reviews
There are no reviews yet.