

Customer support plays a pivotal role in shaping customer experience and loyalty. Delayed responses, unresolved tickets, or inefficient handling can damage brand reputation and lead to customer churn. The Customer Support Report in Excel is a ready-to-use, interactive reporting solution designed to help support managers, supervisors, and teams track tickets, monitor resolution times, and analyze performance across departments and categories.
This Excel-based tool transforms raw support data into visual dashboards, KPIs, and detailed reports, making it easier to spot bottlenecks, prioritize critical tickets, and improve response quality. Whether you manage a small team or a large support center, this report ensures your customer service operations are efficient, transparent, and customer-centric.
🔑 Key Features of the Customer Support Report
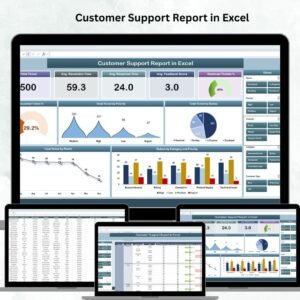
📋 Summary Sheet Tab
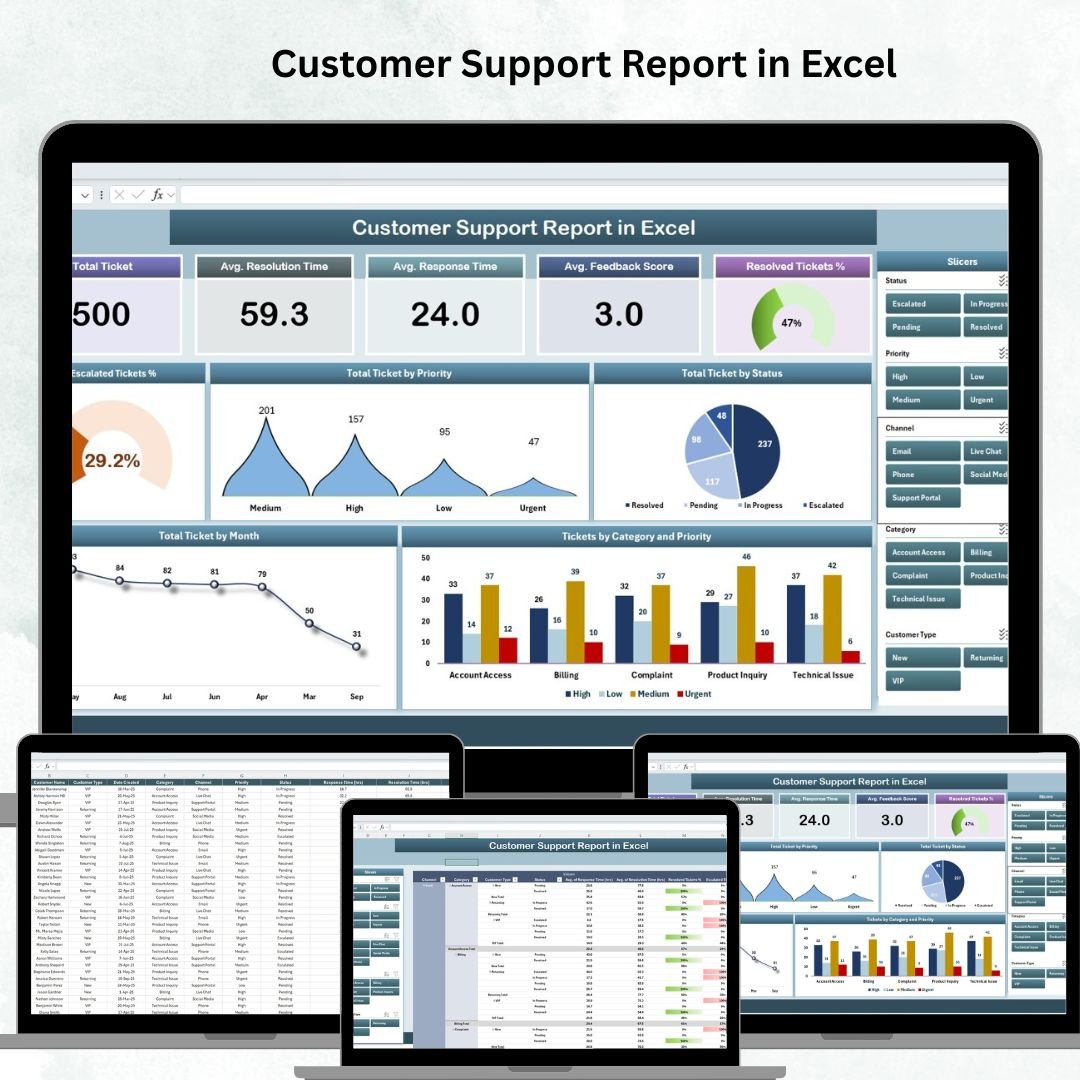
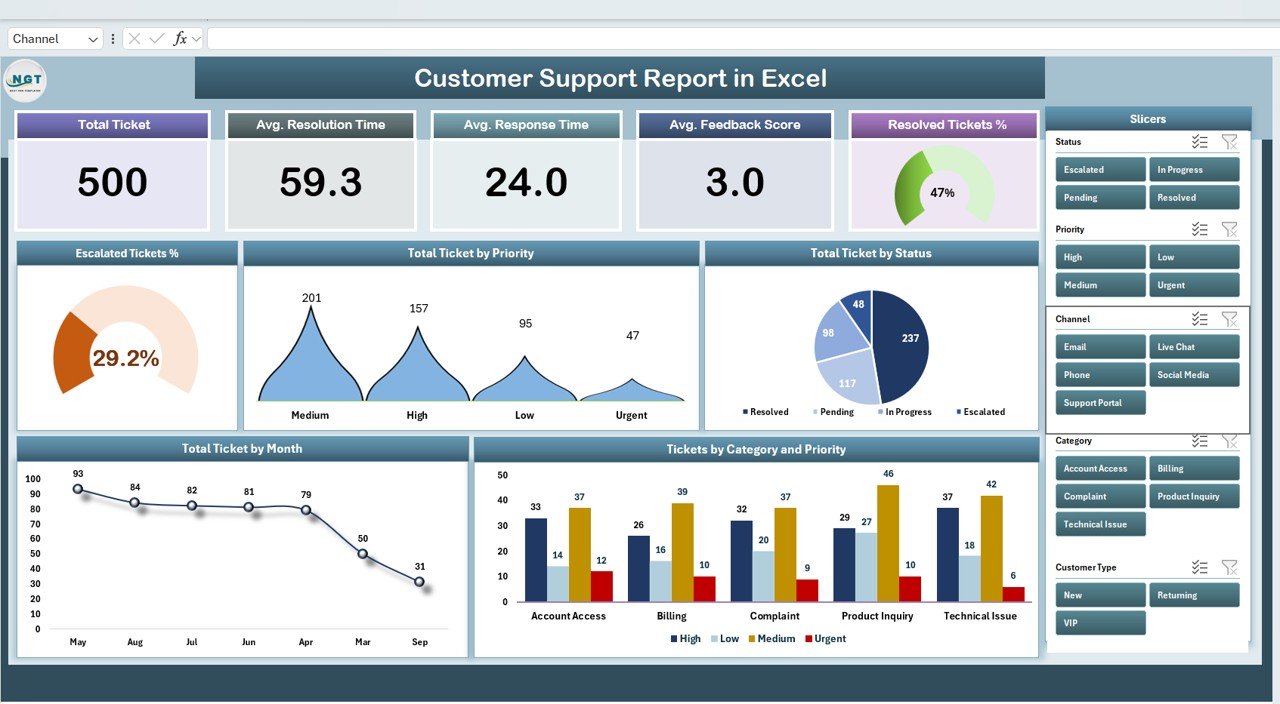
Displays high-level KPIs with cards:
Total Tickets
Average Resolution Time
Average Response Time
Average Feedback Score
Resolved Tickets %
Charts for:
Escalated Tickets %
Ticket volume by Priority and Status
Tickets by Category & Priority
Ticket Trends by Month
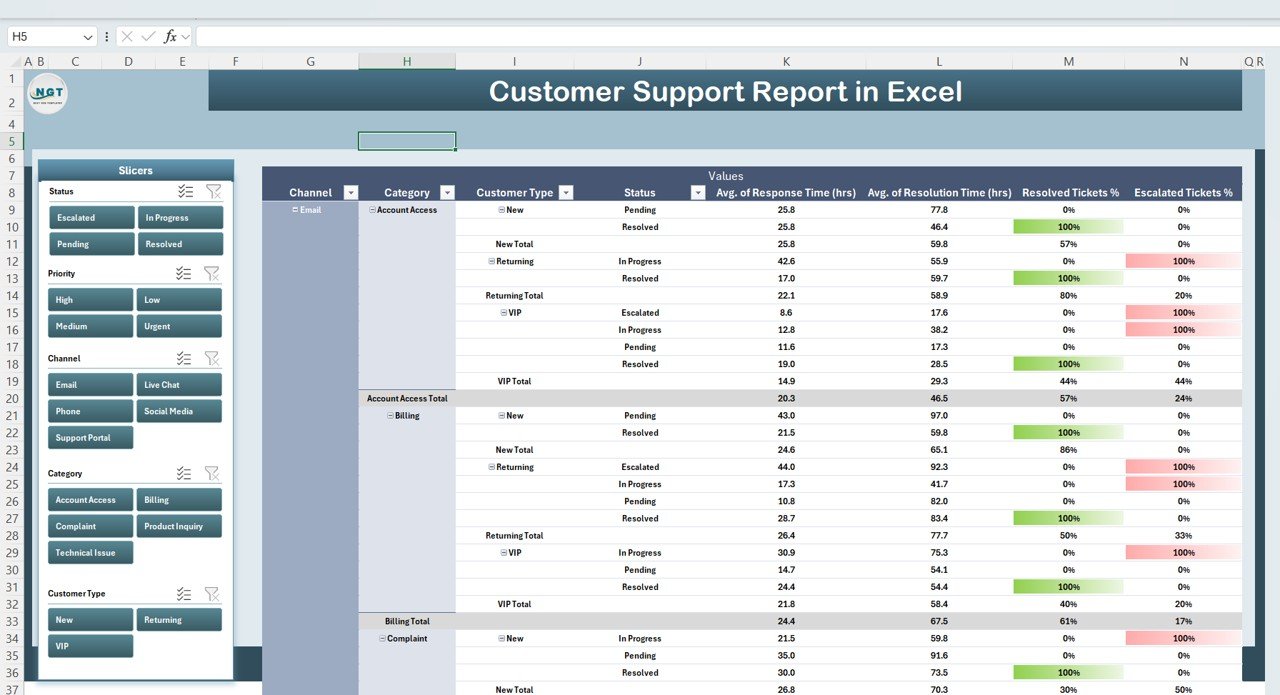
📊 Report Sheet Tab
Power Pivot–driven analytics for deeper insights
Drill-down capabilities by Department, Priority, or Category
Summarized KPIs for management and regulatory reporting
Identify recurring issues and department-level performance gaps
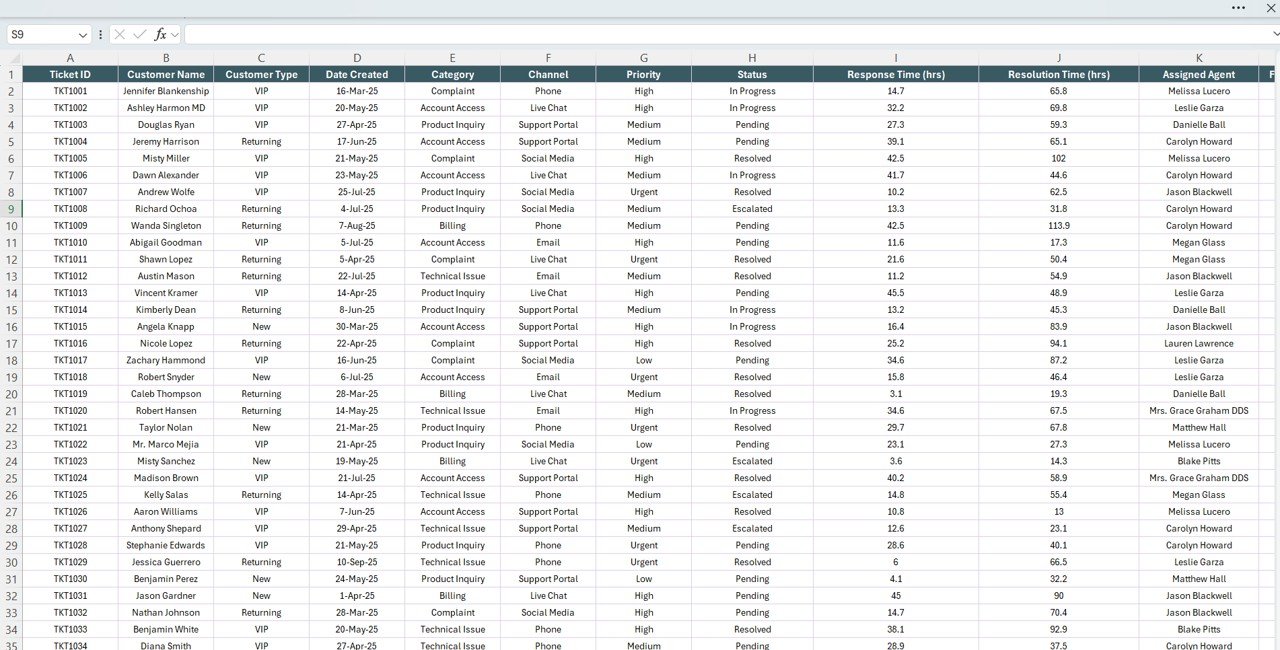
📑 Data Sheet Tab
Structured input format for ticket-level data
Capture date, category, priority, status, resolution time, feedback score, and escalation
Automatic updates across Summary and Report sheets
Ensures accuracy, consistency, and real-time reporting
📦 What’s Inside the Customer Support Report?
When you download this template, you’ll receive:
✅ Summary Dashboard – KPIs & charts for quick insights
✅ Report Tab – Drill-down analysis by team, department, or category
✅ Data Sheet – Structured ticket input for automation
✅ Pre-Built Visualizations – Escalation %, Resolution Time, Feedback Scores
✅ Sample Data – Pre-filled records for demonstration
✅ Customizable Fields – Modify ticket categories, KPIs, and priority levels
This is a plug-and-play solution — no coding, macros, or complicated setup required.
🧑💼 Who Can Benefit from This Report?
🎯 Support Managers – Monitor ticket resolution and team efficiency
🎯 Supervisors – Identify escalations and prioritize urgent cases
🎯 Executives – Track customer support performance trends over time
🎯 Customer Experience Teams – Measure satisfaction and feedback scores
🎯 SMEs & Enterprises – Scale support insights for any organization size
This template is built for organizations aiming to improve customer satisfaction through structured, data-driven support monitoring.
🧪 How to Use the Customer Support Report
Enter Ticket Data – Record support cases in the Data Sheet
View KPIs – Track resolution time, feedback scores, and escalation rates in the Summary Sheet
Analyze Reports – Drill into department and category-level performance via the Report Sheet
Spot Trends – Identify recurring issues with monthly ticket charts
Take Action – Optimize staffing, training, and escalation processes
This report ensures your customer support teams work smarter, not harder.
🌟 Why Choose This Excel Report?
Centralized ticket tracking in one place
Visual dashboards for clarity and speed
KPI-driven insights for faster decision-making
Monitor satisfaction and efficiency simultaneously
Fully customizable to your categories and KPIs
Scalable for small or large support teams
With the Customer Support Report in Excel, you’ll boost support efficiency, improve resolution speed, and increase customer satisfaction — all with one simple, automated tool. 🌟
🔗 Click here to read the Detailed blog post
Watch the step-by-step video Demo:
🔗 Visit our YouTube channel to learn step-by-step video tutorials
Compatibility and Requirements
- Works in Microsoft Excel desktop (Excel 2016 or later, or Microsoft 365).
- The Report sheet is built on Power Pivot.
- Microsoft’s guide Create a PivotTable to analyze worksheet data explains the Excel feature this file is built on.
Frequently Asked Questions
Which sheets are in the Customer Support Report?
There are three: a Summary sheet with KPI cards and charts, a Report sheet with Power Pivot analysis, and a Data sheet where you enter ticket records.
Which KPIs are shown on the Summary sheet?
Total Tickets, Average Resolution Time, Average Response Time, Average Feedback Score and Resolved Tickets %, with charts for escalated tickets, priority and status, category and monthly ticket trends.
What do I record for each ticket?
Date, category, priority, status, resolution time, feedback score and escalation. The Summary and Report sheets update from this data.
Does it come with sample data?
Yes. It includes pre-filled sample records so you can see how the report works before adding your own tickets.
Related Customer Support Templates
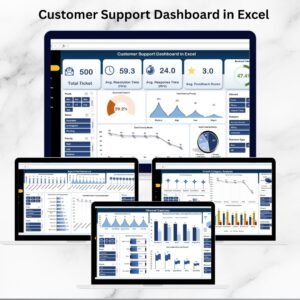
- Customer Support Dashboard in Excel: a full customer support dashboard in Excel
- Customer Support Dashboard in Google Sheets: customer support reporting in Google Sheets
- Customer Support Dashboard in Power BI: customer support reporting in Power BI
- Customer Support SLA KPI Dashboard in Excel: track SLA targets for support tickets
- Customer Service Request Tracker in Excel: log and follow up customer service requests
Browse all Excel reports or the Excel dashboards.






Reviews
There are no reviews yet.