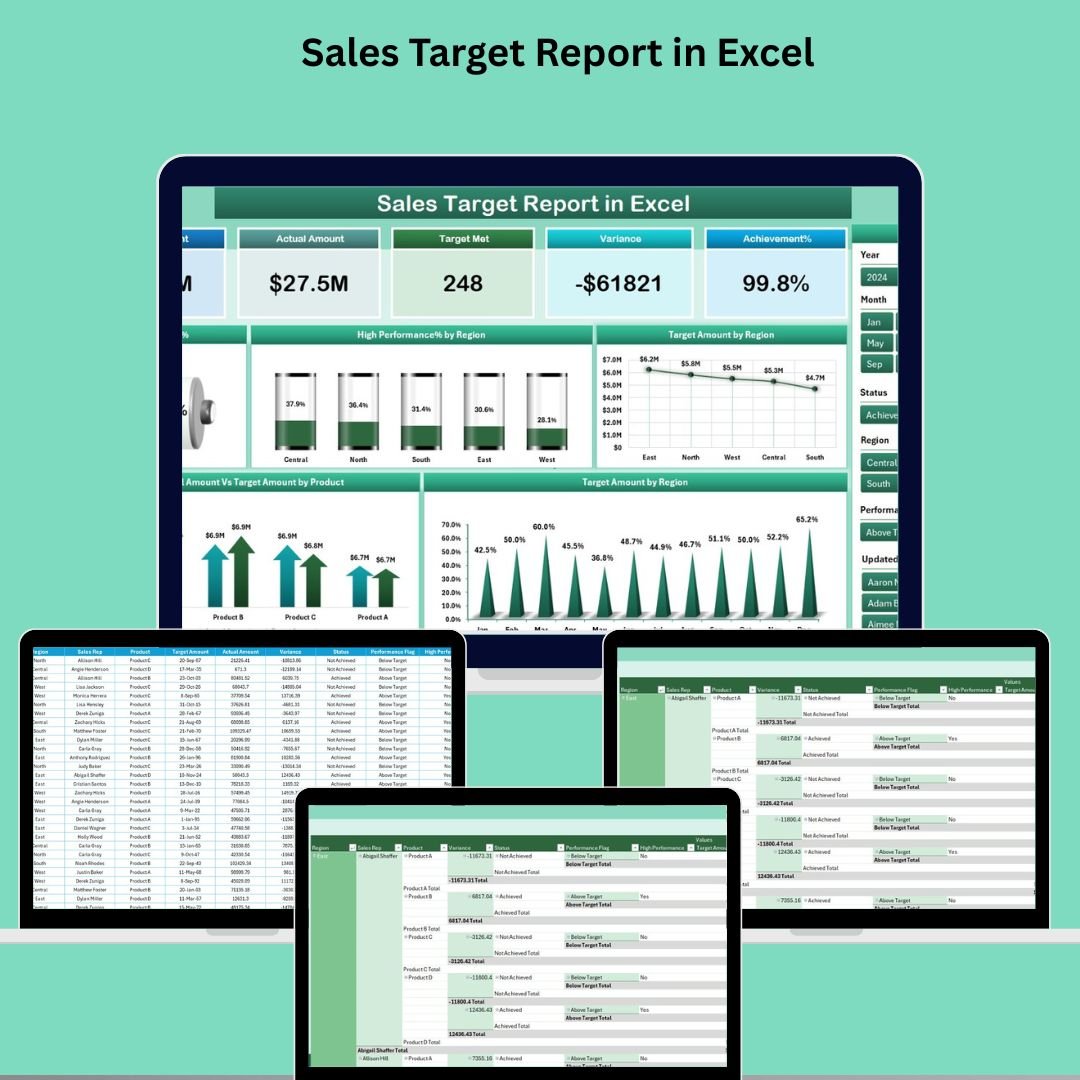
📊 Key Features of Sales Target Report in Excel
📌 Summary Page with KPIs
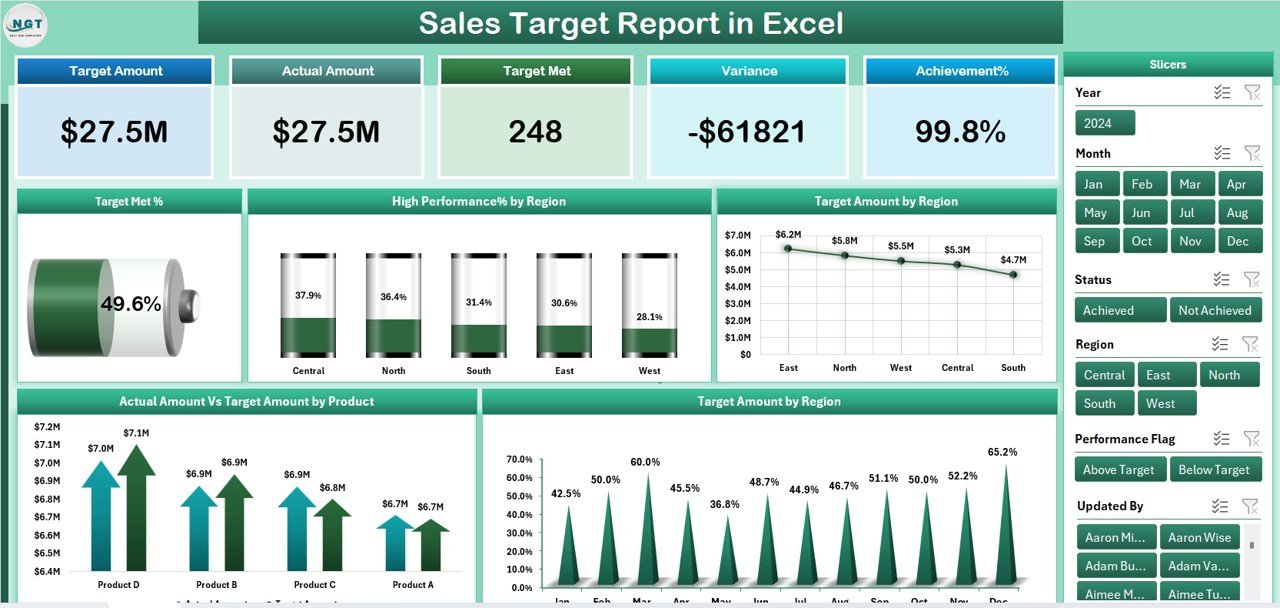
Quickly evaluate your sales performance using 5 essential KPI cards like Total Sales, Target Met %, and High-Performance %. Perfect for management-level overviews.
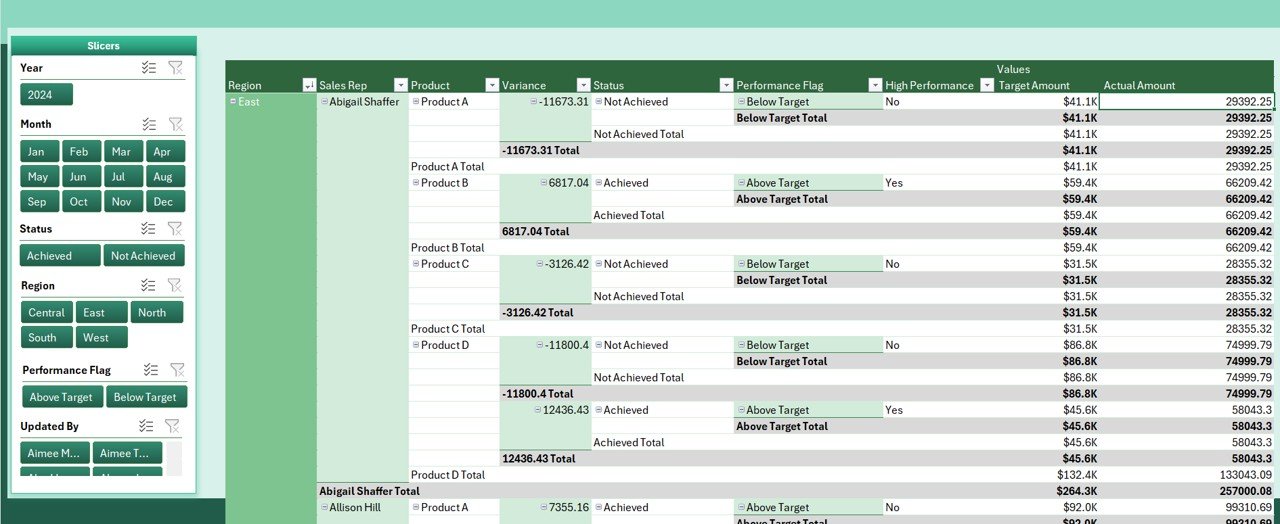
🧮 Slicers for Dynamic Filtering
Easily filter the entire report by Region, Product, or Date Range using intuitive slicers on the right-hand side of the dashboard.
📈 Visual Sales Analytics
Includes 5 informative charts:
-
Target Met %
-
High-Performance % by Region
-
Target Amount by Region
-
Actual vs Target by Product
-
Regional Target Amount Breakdown
These visuals make it easy to spot overperformers, underachievers, and trending patterns.
📝 Detailed Report Page
Drill into individual metrics with a powerful slicer and data table. Track targets, actuals, and calculated performance progress for every combination of product, region, and period.
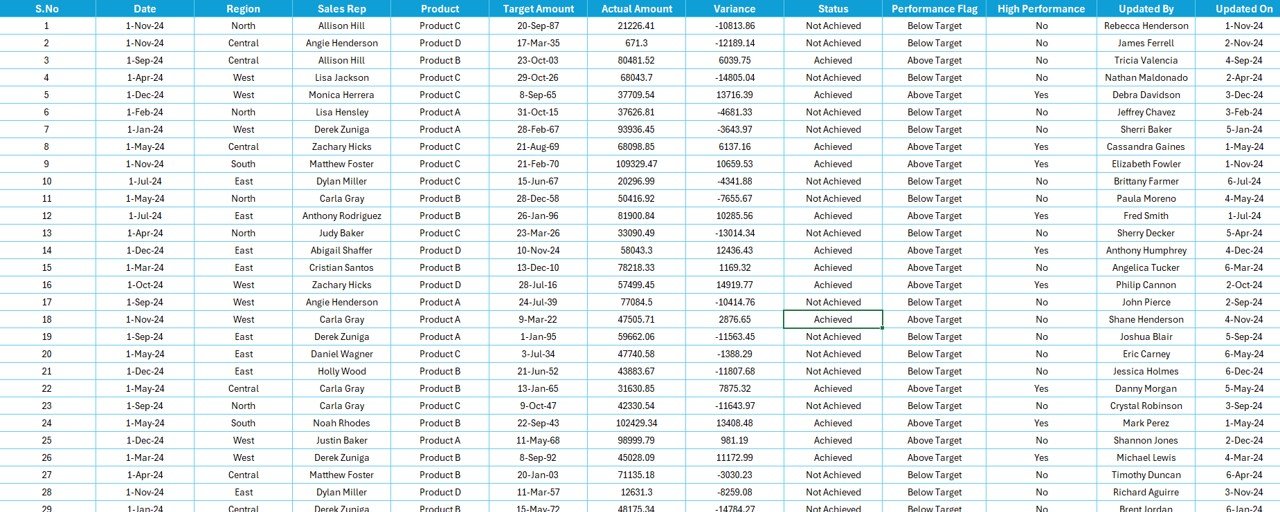
📂 Structured Data Sheet
Maintain raw sales and target data cleanly and consistently. This sheet includes:
-
Actual Sales Records
-
Sales Targets
-
Product Performance Details
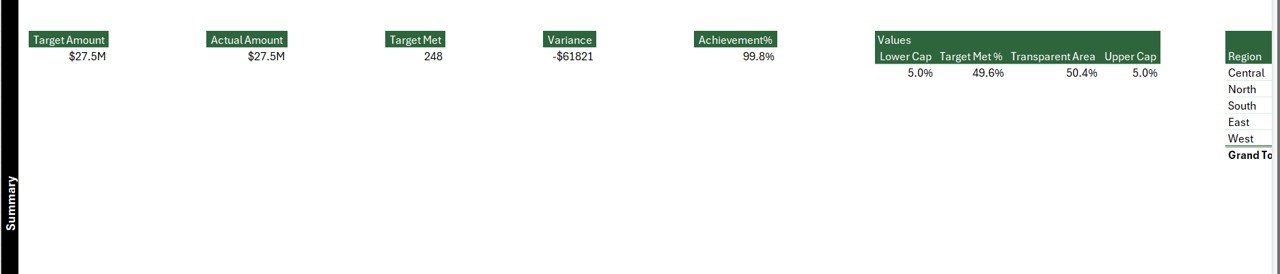
⚙️ Support Sheet for Background Calculations
Handle exchange rates, product categories, and validation lists behind the scenes—ensuring data integrity and reliable metrics.
📊 Excel-Powered, No Add-ins Needed
Everything runs natively within Excel—no extra software, plug-ins, or coding knowledge required.
📂 What’s Inside the Sales Target Report in Excel
✅ Excel File Template (.xlsx) – Ready-to-use and customizable
✅ 4 Structured Tabs:
-
Summary Page – KPIs + Slicers + Charts
-
Report Page – Data table with slicer-based deep dive
-
Data Sheet – Actuals, targets, product-level data
-
Support Sheet – Background values & validation
✅ Interactive Filters – Quickly slice data by region, product, or date
✅ KPI Cards – See how well you’re performing in real time
✅ Charts & Graphs – Easy-to-read visualizations for faster decision-making
✅ Conditional Formatting – Highlights top/bottom performers automatically
⚙️ How to Use the Sales Target Report in Excel
📁 Step 1: Input Your Data
Enter your actual sales and target values into the Data Sheet. Use fields like Product, Region, Date, Target, and Actual.
📊 Step 2: Navigate to the Summary Page
Here, you’ll see high-level cards, slicers, and performance charts—all populated from the Data Sheet.
🧭 Step 3: Use Slicers for Custom Views
Filter by Region, Product, or Timeframe to see performance from multiple perspectives.
📉 Step 4: Dive into the Report Page
For detailed insights, check the Report Page where each row contains in-depth data on targets, actuals, and performance percentages.
📤 Step 5: Share Reports Easily
Export visuals or sheets as PDF to present reports during meetings or share with stakeholders.
👥 Who Can Benefit from This Sales Tracking Tool
💼 Sales Managers – Monitor targets, motivate teams, and guide sales strategy
📈 Business Owners – See how well your business is performing at a glance
🧾 Sales Reps – Track personal performance against goals
🏢 Small Businesses – Leverage Excel without investing in expensive BI tools
📊 Marketing & Finance Teams – Align campaigns with top-performing products or regions
Whether you’re managing a team of 3 or 300, this Excel-based report keeps your goals in sight and your decisions data-backed.


Reviews
There are no reviews yet.