

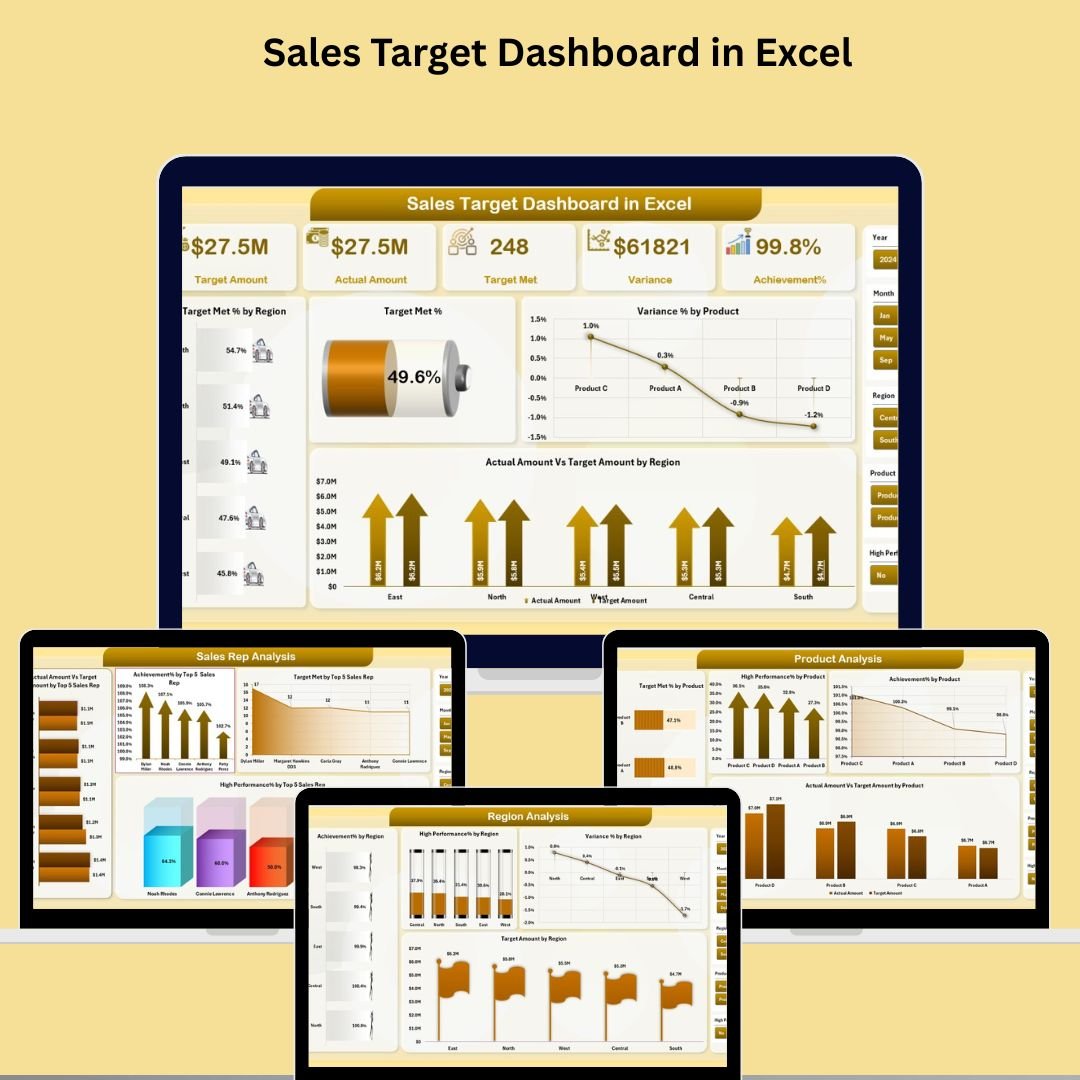

📊 Key Features of Sales Target Dashboard in Excel
🎯 Track Sales vs Target with Precision
Visualize how your sales reps, products, or regions are performing with real-time comparisons of actual vs target sales.
📈 Achievement % & Variance at a Glance
Easily monitor achievement percentages, target met %, and variance % to see what’s working—and what’s not.
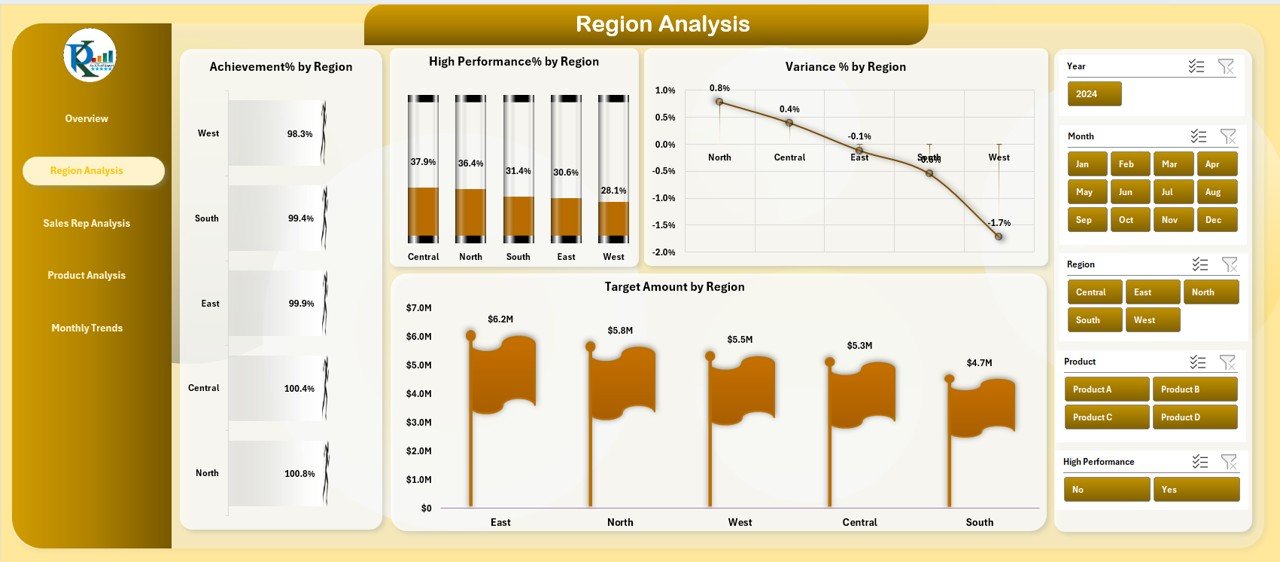
🌍 Region-Wise Drilldown
Get clear visibility into regional performance. Identify which regions are outperforming and where extra support is needed.
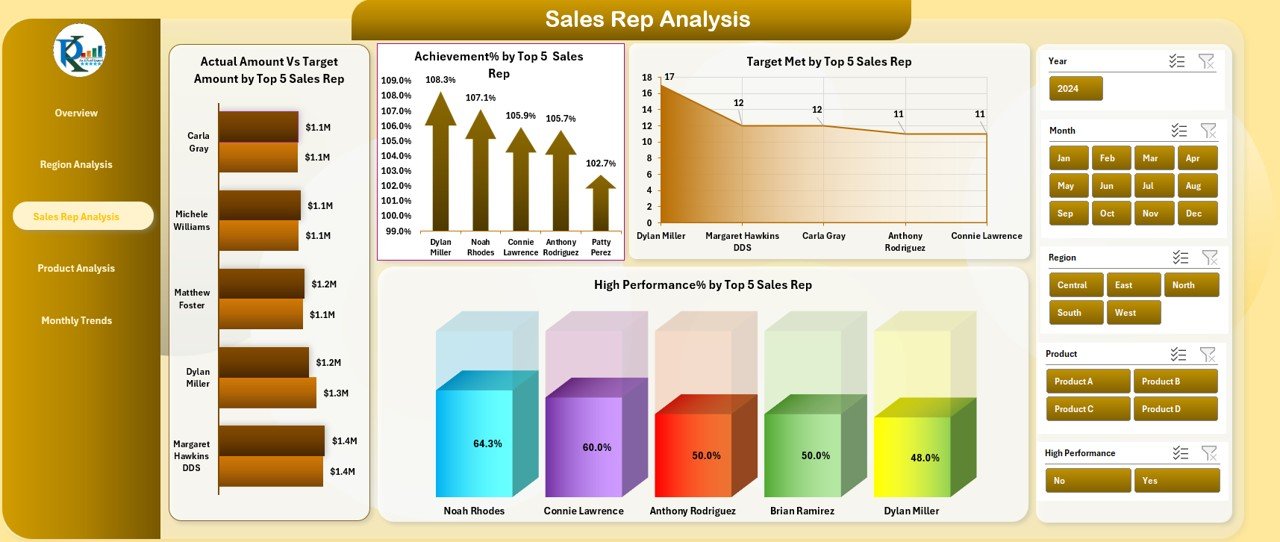
👨💼 Sales Rep Performance Metrics
Rank top-performing sales reps and identify those falling short with detailed rep-level KPIs and charts.
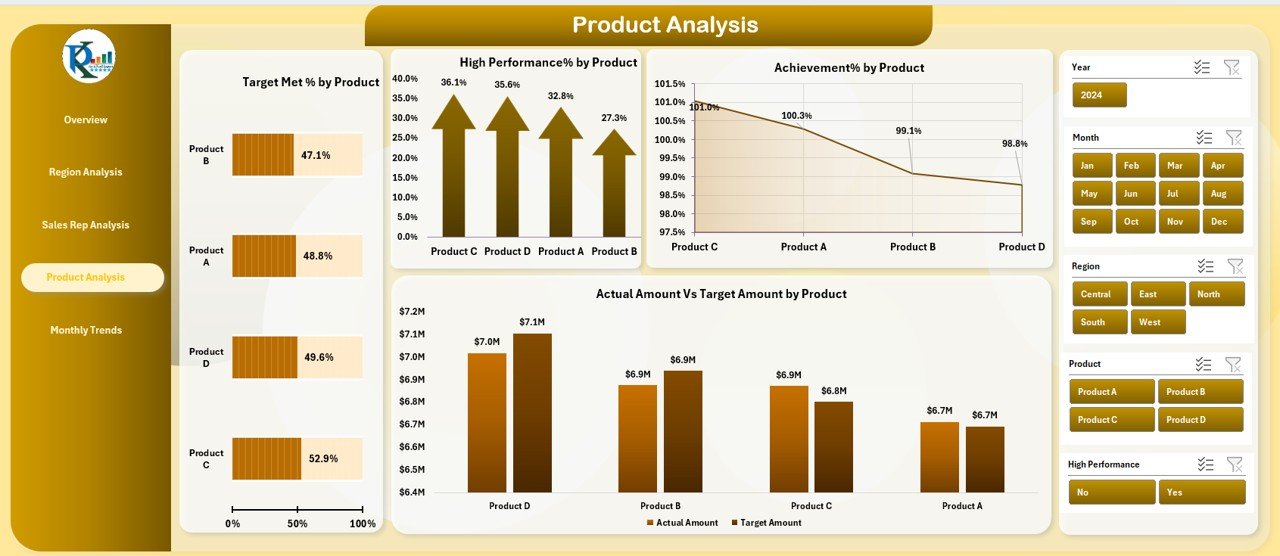
📦 Product Performance Tracking
Spot high-demand products and those missing their targets. Make informed inventory and marketing decisions.
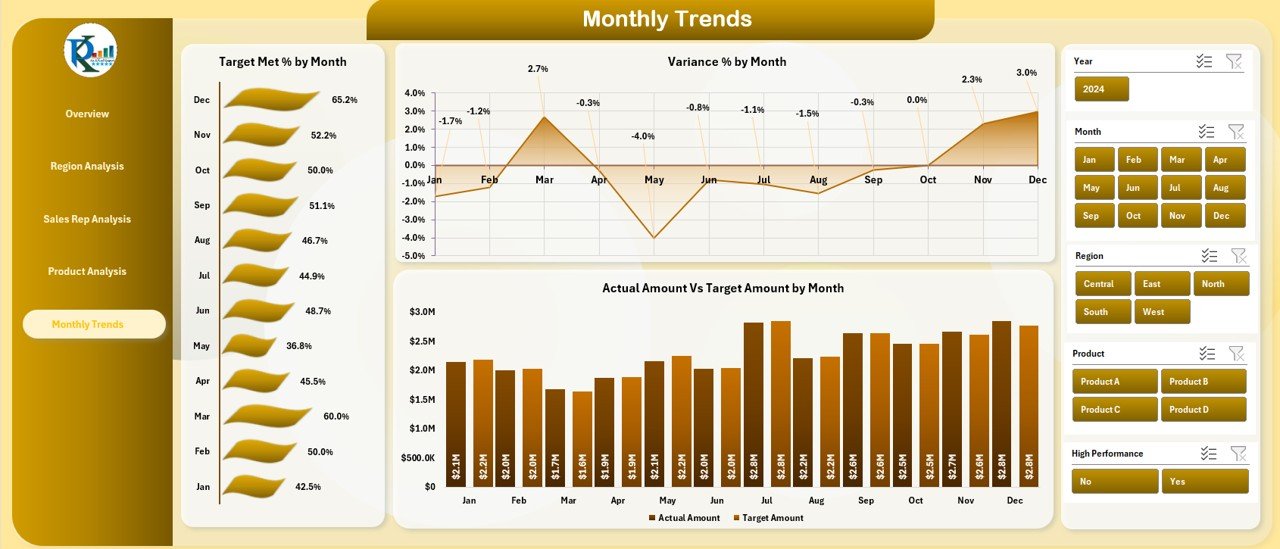
📅 Monthly Trend Analysis
Discover performance trends over time to support quarterly reviews and forecasting.
📌 Slicers for Smart Filtering
Filter data by region, sales rep, product, month, or year to create custom reports instantly.
🖥️ No Add-ins Needed
Built entirely in Excel—just plug in your data and you’re good to go!
📊 Professional-Grade Visuals
Polished metric cards, interactive charts, and slicers make this dashboard boardroom ready.
📂 What’s Inside the Sales Target Dashboard in Excel
✅ Excel File with 5 Dashboard Pages:
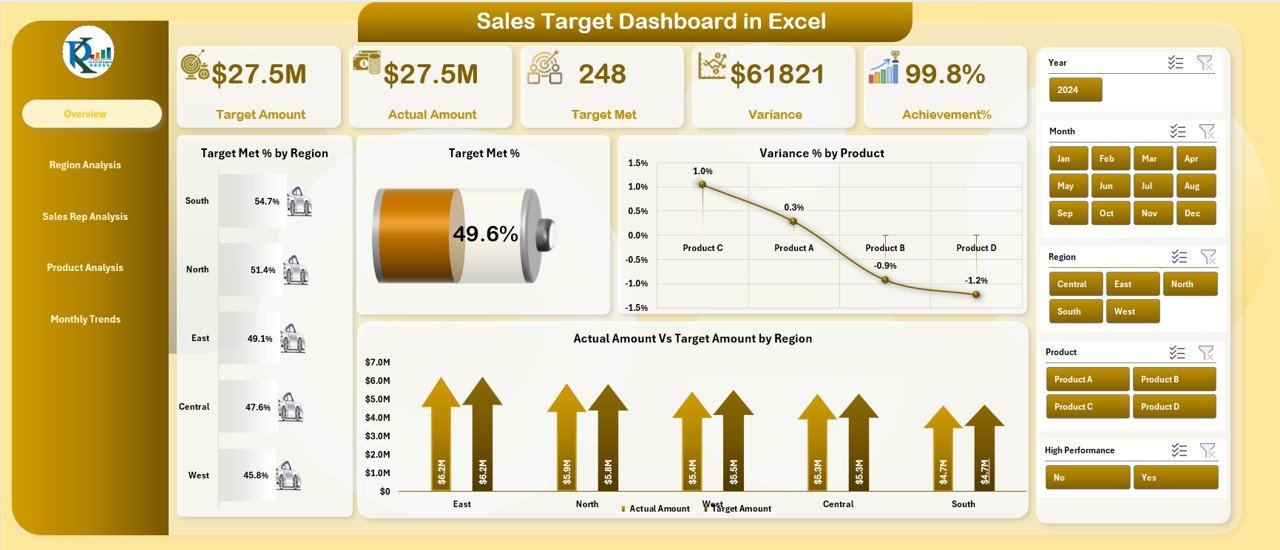
Overview Page – KPI cards, charts, slicers
Region Analysis Page – Compare sales by location
Sales Rep Analysis Page – View top 5 performer metrics
Product Analysis Page – Measure product-level targets
Monthly Trends Page – Track progress month by month
✅ Prebuilt Metric Cards – Total Sales, Target, Achievement %, Target Met %, Variance %
✅ Powerful Charts – Actual vs Target, Target Met %, High Performance %, Achievement %
✅ Slicers (Filters) – Region, Sales Rep, Product, Month, Year
✅ User Guide – Included with step-by-step instructions for updating and customizing the file
✅ Customizable Design – Add your own branding, metrics, or pages easily
⚙️ How to Use the Sales Target Dashboard in Excel
💼 Step 1: Open the File
Load the prebuilt Excel dashboard. Navigate between pages using the Page Navigator.
📥 Step 2: Input or Update Data
Update the ‘Actual’ and ‘Target’ sheets with your latest sales numbers (Date, Region, Product, Sales Rep, etc.).
🧠 Step 3: Apply Filters (Slicers)
Use slicers to filter your data across region, sales reps, product, and time period.
📊 Step 4: Review KPI Cards & Charts
Check the overview page for quick metrics, then deep-dive into region, product, or rep-specific pages.
📤 Step 5: Export Reports
Export charts or pages as PDFs or images to share with leadership and teams.
This dashboard is user-friendly and doesn’t require advanced Excel skills to get started.
👥 Who Can Benefit from This Sales Target Dashboard
📌 Sales Managers – Track team performance and motivate with visual KPIs.
📊 Business Owners – Instantly see whether goals are being met and where to intervene.
📈 Marketing Teams – Evaluate product performance and plan campaigns accordingly.
🌎 Regional Heads – Drill down into localized performance to plan better.
💼 Corporate Executives – Use clean reports and visuals in board meetings.
🧪 Analysts – Customize KPIs or add metrics like ASP, Profit Margin, etc.
🛒 Retail & FMCG Brands – Monitor SKUs and fast-moving products vs target.
🔗 Click here to read the Detailed blog post
🎥 Visit our YouTube channel to learn step-by-step video tutorials
Watch the step-by-step video tutorial:
Compatibility and Requirements
- Works in Microsoft Excel desktop (Excel 2016 or later, or Microsoft 365).
- It is built with standard Excel charts and slicers, and no add-ins are needed.
- Microsoft explains how slicers filter data in Use slicers to filter data.
Frequently Asked Questions
How many dashboard pages are included?
Five: Overview, Region Analysis, Sales Rep Analysis, Product Analysis and Monthly Trends.
Which metrics are on the KPI cards?
Total Sales, Target, Achievement %, Target Met % and Variance %.
How do I update the numbers?
Enter your latest figures in the Actual and Target sheets (date, region, product, sales rep and so on). The cards and charts then reflect the new data.
What can I filter by?
Slicers filter the dashboard by region, sales rep, product, month and year.
Is there a user guide?
Yes. A user guide with step-by-step instructions for updating and customizing the file is included.
Related Sales Dashboard Templates
- Sales Target Dashboard in Power BI: the same topic in Power BI
- Sales Target Dashboard in Google Sheets: a Google Sheets version
- Sales Target Report in Excel: a printable sales vs target report
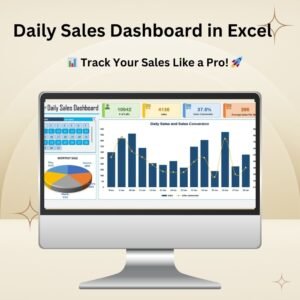
- Daily Sales Dashboard in Excel: track sales day by day
Browse all Excel dashboards or the Excel sales and marketing templates.


























Reviews
There are no reviews yet.