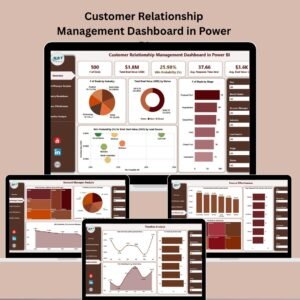
Managing customer relationships isn’t just about keeping in touch—it’s about leveraging data to build stronger connections and drive business success. The Customer Relationship Management Dashboard in Power BI is a powerful, ready-to-use solution designed to help you do exactly that.
Built on Microsoft Power BI, this dashboard gives you a centralized, visual view of all your customer interactions, deal statuses, and team performance. Whether you’re a sales manager, account executive, or data analyst, this tool empowers you to make data-driven decisions that increase revenue, enhance customer experience, and optimize your CRM strategy.
💡 Key Features of Customer Relationship Management Dashboard in Power BI
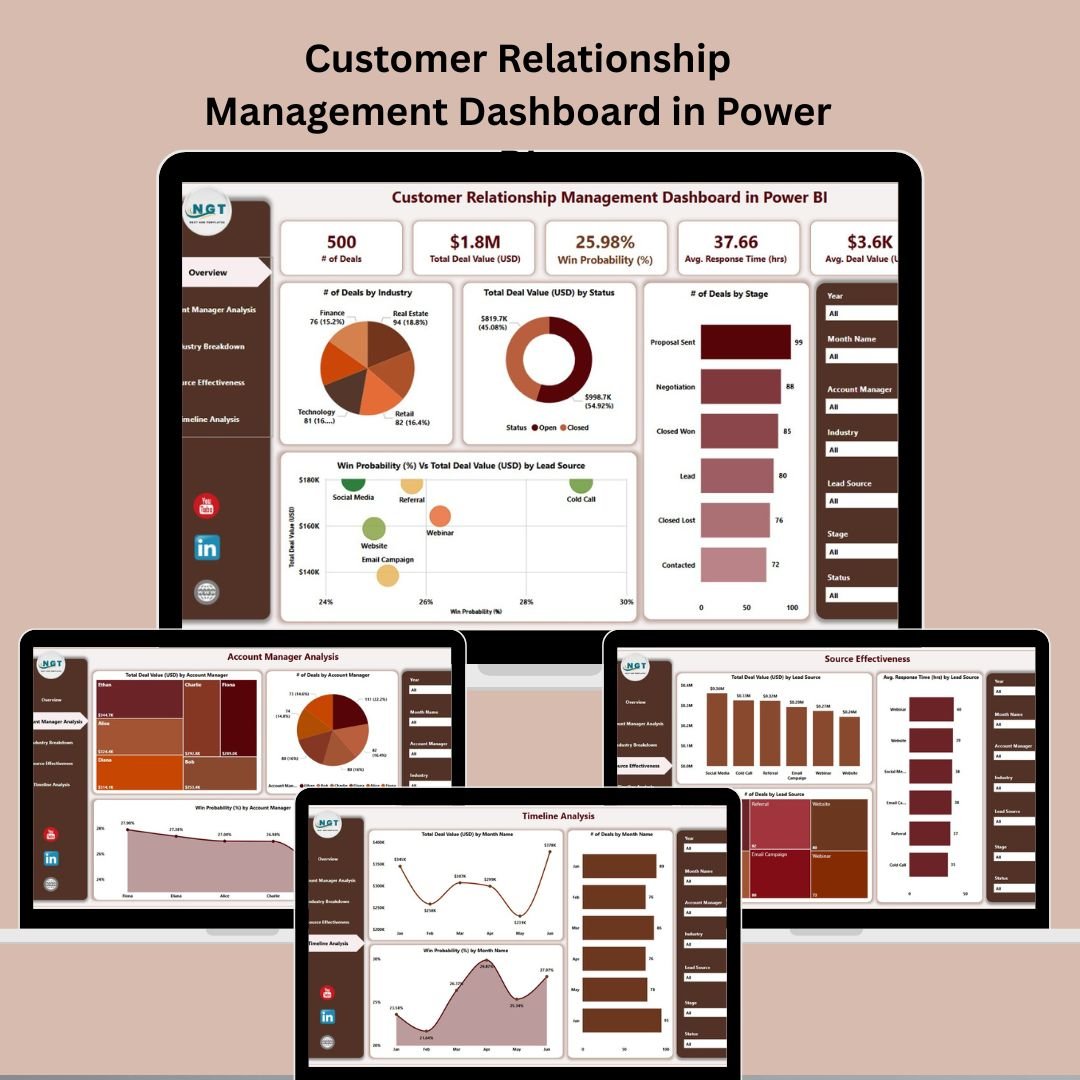
🏠 Overview Page – Executive Snapshot of CRM Performance
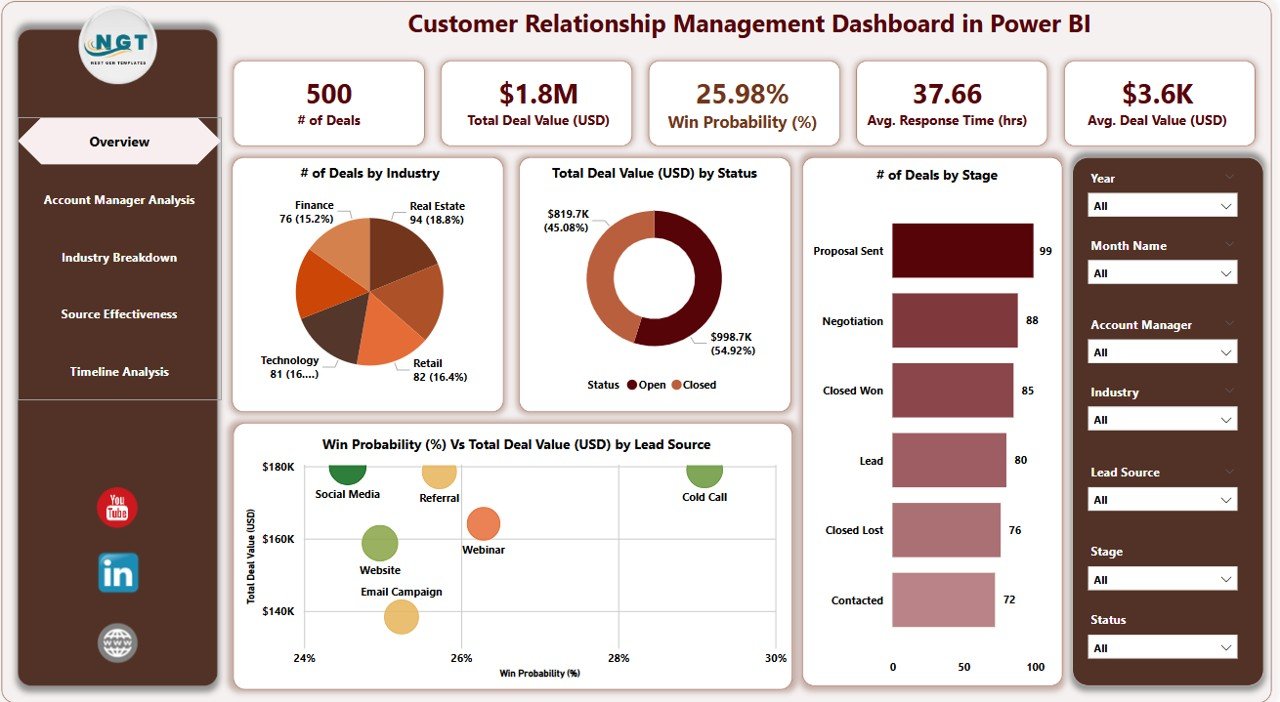
7 dynamic slicers for filtering by source, manager, stage, and more
Summary cards for key KPIs:
📊 Number of Deals by Industry
💰 Total Deal Value by Status
🔁 Number of Deals by Stage
🎯 Win Proclivity (%)
🔍 Deal Value by Lead Source
Get a real-time overview of your sales pipeline and lead efficiency
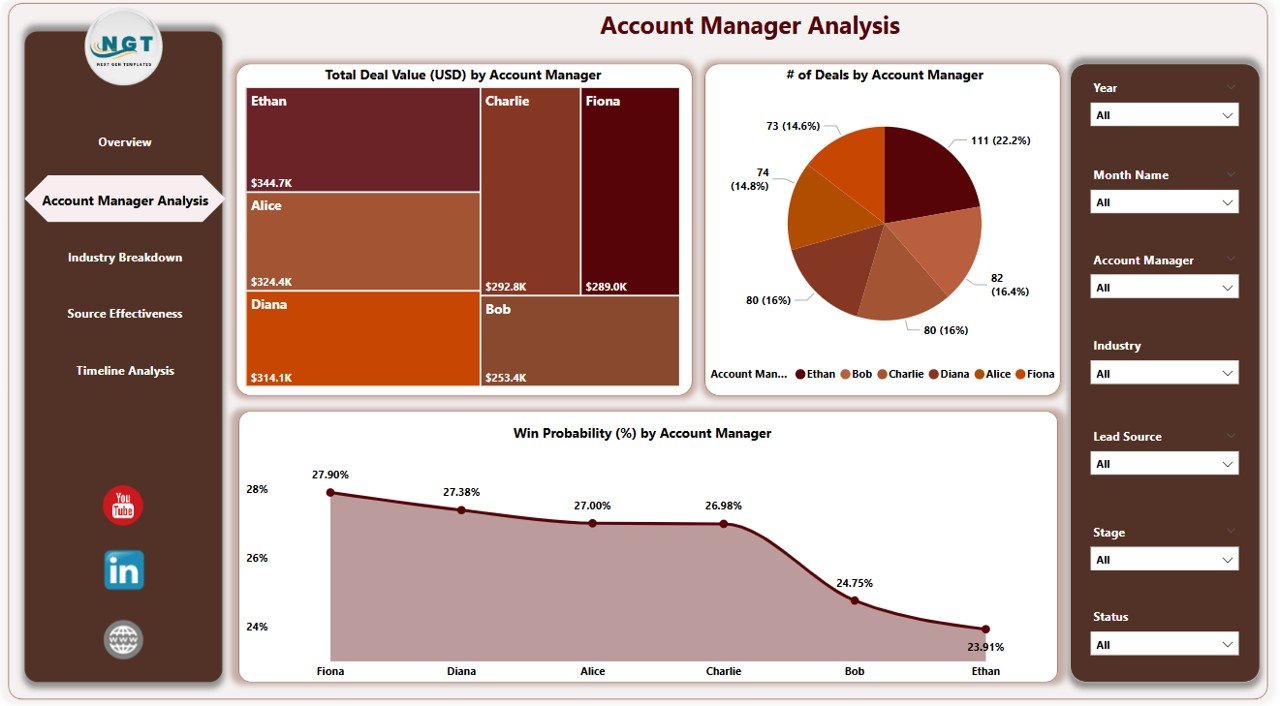
👤 Account Manager Analysis Page – Team Performance Breakdown
Evaluate individual manager performance
Visuals include:
Total Deal Value by Account Manager
Deal Count by Manager
Win Proclivity by Manager
Pinpoint strengths, address gaps, and allocate resources smartly
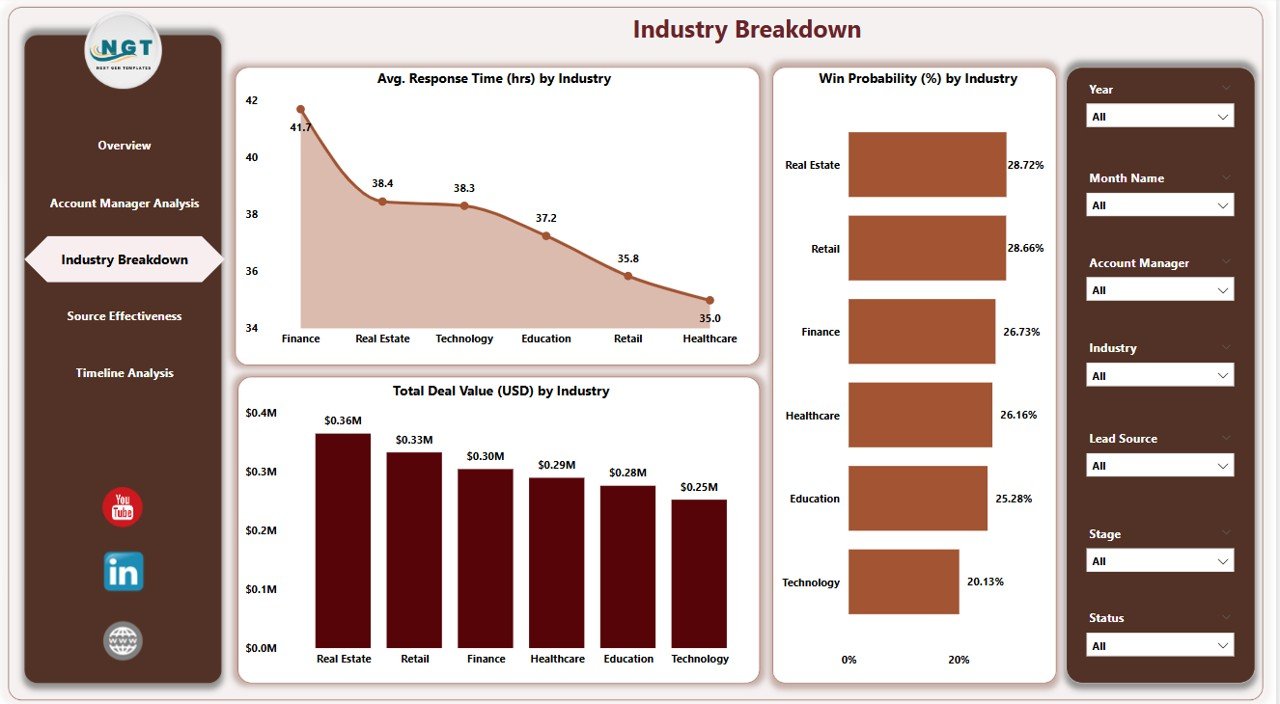
🏭 Industry Breakdown Page – Sector-Wise CRM Insights
Analyze key industries with:
Average Response Time
Win Probability
Total Deal Value
Adjust messaging and tactics based on industry-specific trends
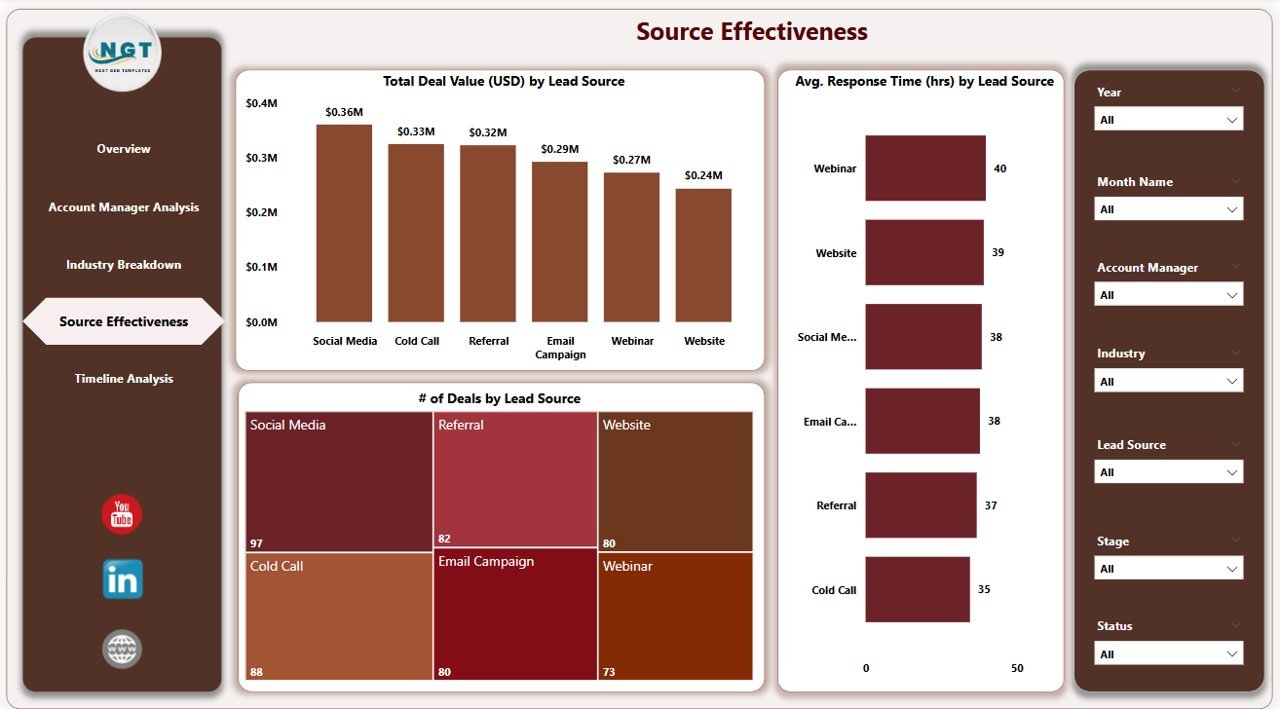
📢 Source Effectiveness Page – Optimize Lead Generation
Understand where your leads are coming from—and which convert best
View:
Total Deal Value by Source
Response Time by Source
Number of Deals by Source
Fine-tune your marketing and lead-generation strategy accordingly
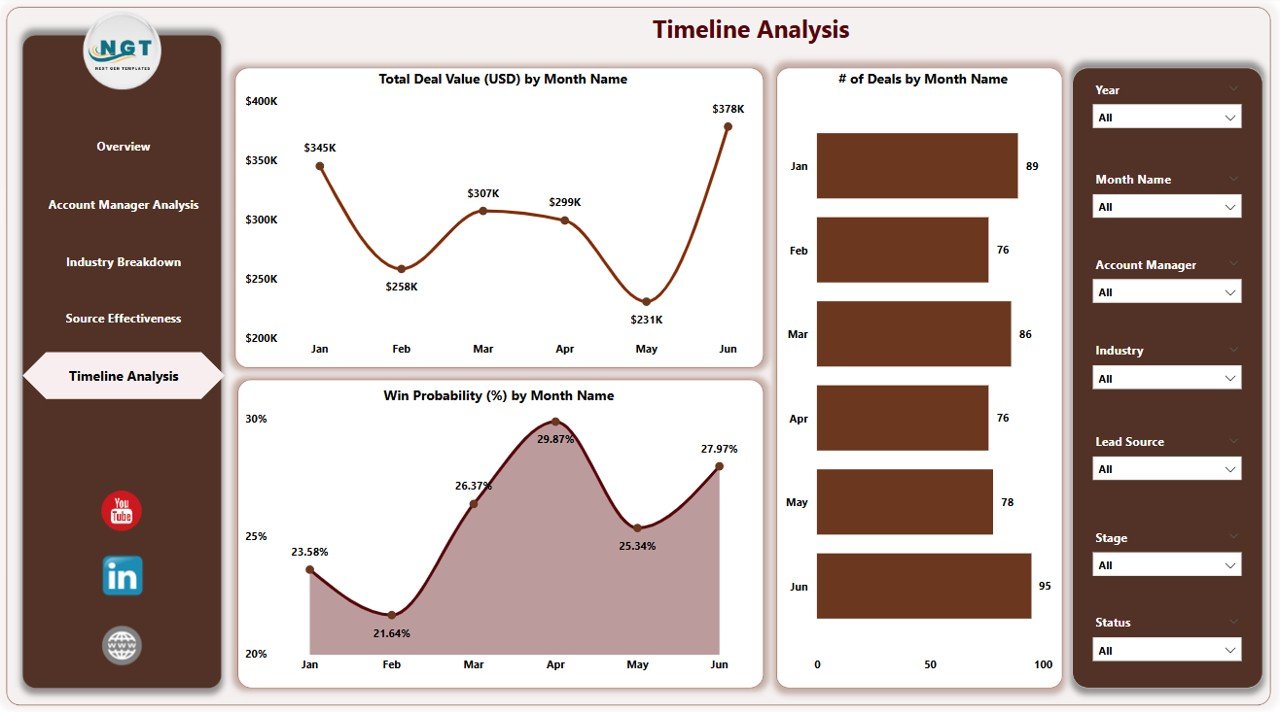
🕒 Timeline Analysis Page – Track Trends Over Time
Identify seasonal peaks and slowdowns
Includes:
Deal Value by Month
Average Response Time by Month
Deal Count by Month
Make timely decisions and plan campaigns around sales cycles
📦 What’s Inside the Dashboard?
Your download includes:
✅ Fully interactive Power BI (.pbix) file
✅ Excel source file for data entry (Actuals and Targets)
✅ Overview, Account Manager, Industry, Source, and Timeline pages
✅ Slicers for deep drill-down
✅ Visuals like bar charts, combo charts, pie charts, and KPI cards
✅ Performance metrics across deals, time, leads, and teams
All you need to do is update the Excel file with your CRM data—and the Power BI dashboard does the rest!
🛠️ How to Use the Product
📥 Download the Power BI file and Excel input sheets
📁 Input your CRM data (deals, sources, team, industry) into the Excel file
🔗 Connect Excel data to the dashboard
📊 Use slicers to filter views across managers, sources, months, and industries
💼 Review real-time metrics and take action
No coding. No confusion. Just actionable CRM analytics at your fingertips!
👥 Who Can Benefit from This Dashboard?
🏢 Sales Managers – Monitor team performance, deal stages, and conversions
📈 CRM Specialists – Dive into lead sources and win ratios
📞 Account Executives – Track individual progress and customer interactions
🧠 Business Analysts – Extract and present insights for leadership
📊 Marketing Teams – Analyze which sources generate the most conversions
🛠️ Operations Teams – Plan resource allocation based on real data
If customer relationships impact your bottom line—this dashboard belongs in your toolkit.
🔗 Click here to read the Detailed blog post
🎥 Visit our YouTube channel to learn step-by-step video tutorials
👉 YouTube.com/@PKAnExcelExpert