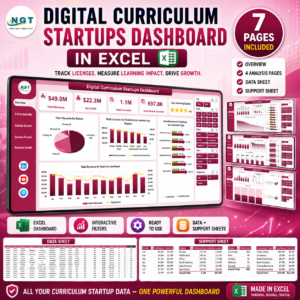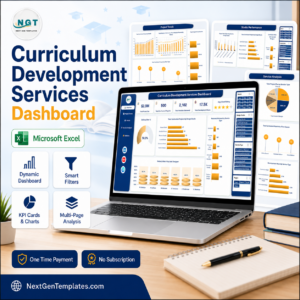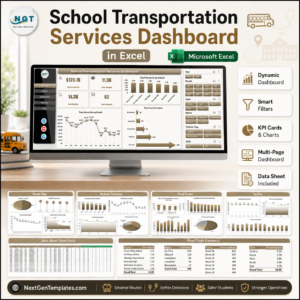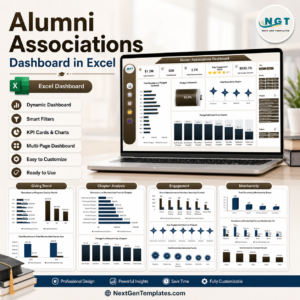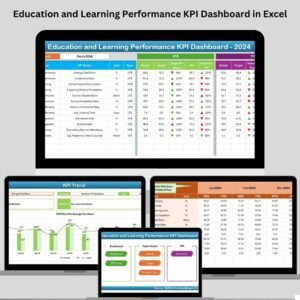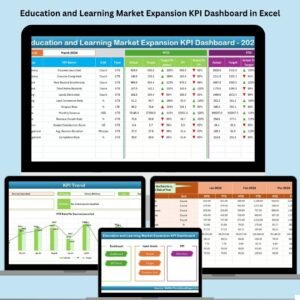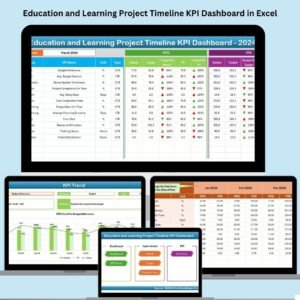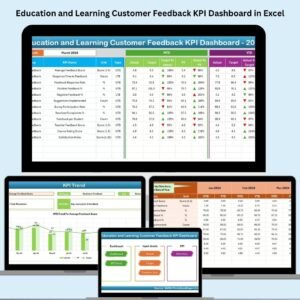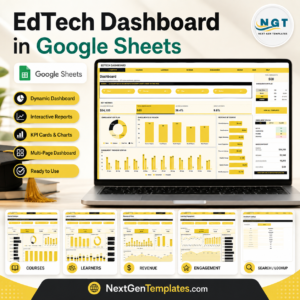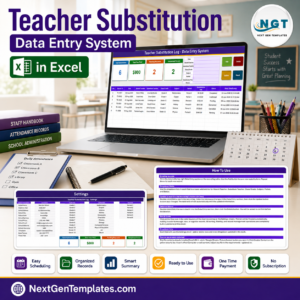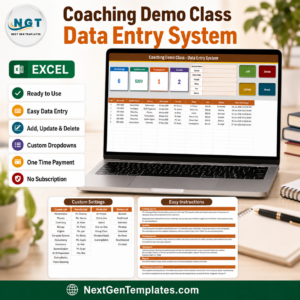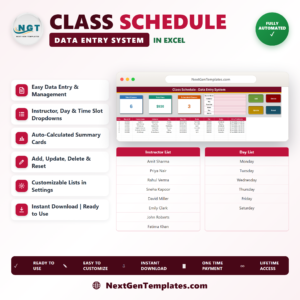

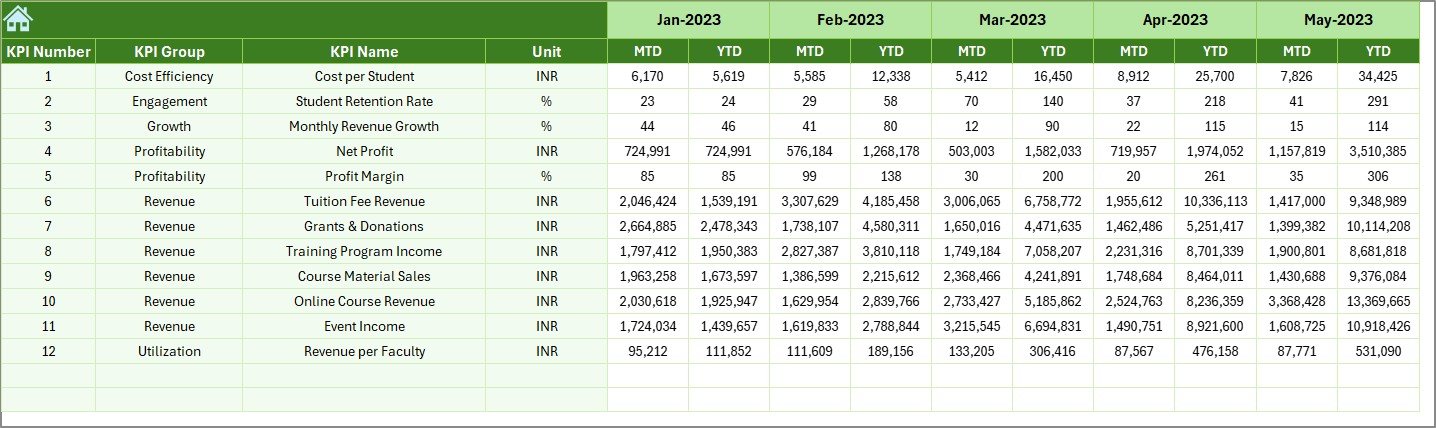

Managing revenue in education doesn’t have to be complex. The Education and Learning Revenue Tracking KPI Dashboard in Excel makes it simple to visualize, analyze, and take control of your institution’s financial performance. Whether you’re running a school, university, training center, or online learning platform, this dynamic dashboard brings all your key revenue indicators into one clear, professional Excel file.
Designed for finance officers, administrators, and education entrepreneurs, this tool tracks tuition, grants, course sales, and more helping you make smarter decisions with real-time financial insights. From monthly tracking to year-over-year comparisons, the dashboard enables strategic planning with confidence.
📌 Key Features
This Excel-based dashboard includes 7 fully interactive worksheet tabs to manage your entire revenue cycle:
🏠 Home Sheet

Central navigation panel
6 quick-access buttons for seamless use
📊 Dashboard Sheet
Visual display of KPIs for selected month
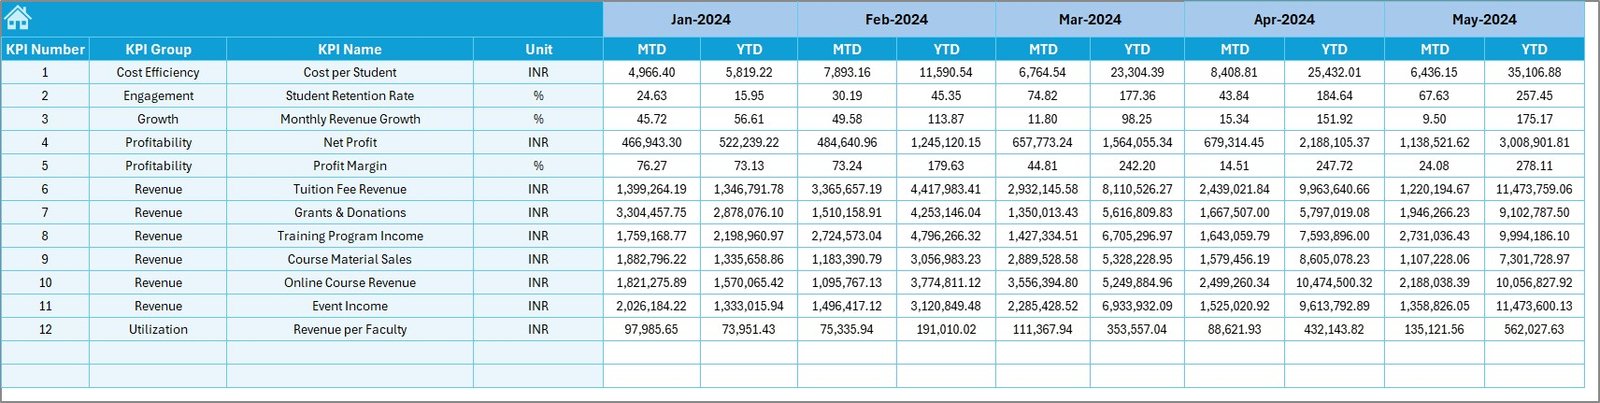
Auto-calculates MTD and YTD (Actual, Target, Previous Year)
Uses conditional formatting arrows for quick trend visualization
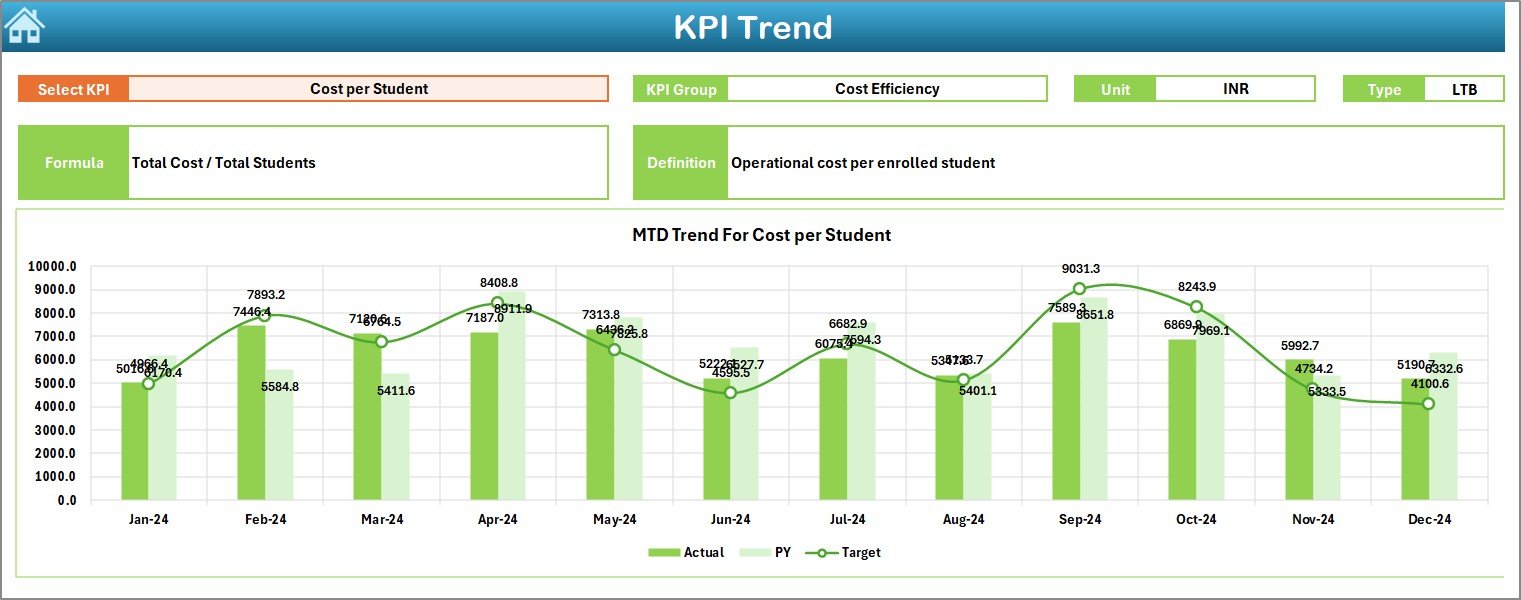
📈 KPI Trend Sheet
Select any KPI to view its metadata and trend charts
MTD and YTD comparison across Actual, Target, and Previous Year
📥 Actual Numbers Input Sheet
Manually input monthly data with ease
Choose financial year start month for accurate tracking
🎯 Target Sheet
Define MTD and YTD targets by month
Ideal for budget forecasting and performance alignment
📆 Previous Year Number Sheet
Store last year’s actual data for direct comparison
🧾 KPI Definition Sheet
Lists KPI names, formulas, and definitions
Editable and easy to adapt to your institution’s needs
✅ Advantages of This Excel Dashboard
📂 Centralized Tracking
Track tuition, grants, course revenue, and other income streams in one place.
📊 Instant Performance Visibility
Clear MTD and YTD performance against targets and last year.
🧩 Fully Customizable
Add, modify, or remove KPIs based on your educational model.
🚀 Actionable Insights
Use trend graphs and conditional formatting to identify issues early.
🧠 Decision Support
Helps leadership teams with data-backed financial planning and growth strategies.
🎓 Who Should Use This?
School and College Administrators
University Finance Teams
Coaching and Training Centers
Online Course Creators
Educational NGOs and Nonprofits
Anyone responsible for revenue and budget decisions will benefit from this tool.
🔑 KPIs You Can Track
Tuition Fee Collection Rate
Revenue per Student
Online Course Income
Grant and Donation Revenue
Scholarship Impact
Target Achievement %
YOY Growth (Monthly/Yearly)
💡 Best Practices
✔ Keep targets SMART
✔ Update data monthly or weekly
✔ Validate data accuracy
✔ Limit KPIs to the most relevant
✔ Share dashboard insights with teams
⚠️ Common Mistakes to Avoid
❌ Backdating or skipping data updates
❌ Using overly complex KPIs
❌ Ignoring gaps between target and actuals
❌ Not setting starting month in the input sheet
❌ Forgetting stakeholder collaboration
📘 Real-World Example
A coaching center using this dashboard noticed a dip in online course revenue compared to last year. By spotting the drop early, they launched a new campaign and adjusted targets accordingly avoiding a revenue shortfall and improving growth.
🏁 Conclusion
The Education and Learning Revenue Tracking KPI Dashboard in Excel is not just a spreadsheet—it’s a powerful strategic tool. Use it to gain financial clarity, improve decision-making, and secure the sustainability of your educational programs. Customize it, share it, and let the data tell your institution’s success story.
🎥 Learn How to Use It
Visit our YouTube channel for tutorials:
🔗 youtube.com/@PKAnExcelExpert