



The Fan Engagement KPI Dashboard in Excel is a must-have tool for sports teams, entertainment companies, and marketers looking to track, analyze, and optimize their fan engagement efforts. This Excel-based dashboard helps organizations monitor key performance indicators (KPIs) such as fan interaction, social media activity, ticket sales, merchandise purchases, and overall fan sentiment, providing you with real-time insights to boost engagement and improve your marketing strategies.
Whether you are managing a sports franchise, a live event, or any other fan-based business, this dashboard offers a comprehensive view of your fanbase’s behavior, enabling you to make data-driven decisions that enhance fan experience, increase loyalty, and boost revenue.

Key Features of the Fan Engagement KPI Dashboard in Excel
📊 Comprehensive Fan Engagement Tracking
Monitor key engagement metrics such as social media interactions, event attendance, and merchandise sales. Track the effectiveness of different marketing campaigns and activities.
📅 Event Attendance & Ticket Sales Analysis
Track ticket sales for specific events, monitor attendance rates, and analyze trends to determine which events attract the most fans and generate the highest revenue.
📱 Social Media Metrics
Monitor fan interactions on social media platforms. Track likes, shares, comments, and follower growth to understand how well your social media campaigns are resonating with your audience.
🛍️ Merchandise Sales Performance
Track merchandise sales, including products sold, revenue, and purchase frequency. This feature helps in identifying popular products and optimizing merchandise strategies.
💬 Fan Sentiment & Feedback
Analyze fan sentiment based on feedback, reviews, and survey results. Understand how your audience feels about your brand, events, and offerings, and use this data to make improvements.
⚙️ Customizable & Scalable Dashboard
Customize the dashboard to include any KPIs that matter most to your organization. Add, remove, or adjust metrics to suit your specific needs and track the success of different engagement strategies.
Why You’ll Love the Fan Engagement KPI Dashboard in Excel
✅ Track Fan Engagement Across Multiple Channels
Monitor fan engagement in real time, whether it’s through social media, event attendance, or merchandise sales. Get a complete view of your fan interaction efforts.
✅ Maximize Event Success
By analyzing ticket sales and event attendance, you can identify the most successful events and optimize marketing strategies to improve attendance and revenue for future events.
✅ Enhance Social Media Strategy
Track social media metrics to assess the effectiveness of your campaigns. Adjust strategies based on real-time data to improve fan interactions and brand awareness.
✅ Boost Merchandise Revenue
Monitor merchandise sales and identify trends in fan purchases. Use these insights to optimize product offerings and marketing strategies, increasing revenue from merchandise sales.
✅ Data-Driven Decisions for Fan Engagement
Use detailed insights from the dashboard to improve fan experience, loyalty, and overall engagement. Make informed decisions that align with fan preferences and increase brand affinity.
What’s Inside the Fan Engagement KPI Dashboard in Excel?
Fan Engagement Metrics: Track social media interactions, event attendance, and fan interactions.
Event & Ticket Sales Tracking: Monitor ticket sales and analyze event attendance trends.
Social Media Metrics: Track likes, shares, comments, and follower growth on various platforms.
Merchandise Sales Performance: Analyze merchandise sales and revenue generation.
Fan Sentiment Analysis: Monitor fan feedback and sentiment through surveys and reviews.
Customizable Dashboard: Adjust KPIs and metrics to fit your unique fan engagement strategy.
How to Use the Fan Engagement KPI Dashboard in Excel
1️⃣ Download the Template: Access the Fan Engagement KPI Dashboard in Excel instantly.
2️⃣ Input Your Fan Data: Enter data for ticket sales, social media engagement, merchandise sales, and fan feedback.
3️⃣ Track KPIs & Performance: Monitor your key metrics in real time and assess fan interaction.
4️⃣ Analyze Trends & Insights: Use the dashboard to track engagement trends, popular events, and successful campaigns.
5️⃣ Optimize Fan Engagement Strategies: Make data-driven decisions to improve fan experience, increase loyalty, and drive revenue.
Who Can Benefit from the Fan Engagement KPI Dashboard in Excel?
🔹 Sports Teams & Leagues
🔹 Event Organizers & Promoters
🔹 Music & Entertainment Companies
🔹 Marketing & Social Media Teams
🔹 Merchandise Managers & Retailers
🔹 Brand Managers & Fan Engagement Specialists
🔹 Small & Medium Enterprises (SMBs) in the Entertainment Industry
Ensure that you are effectively engaging with your fanbase and maximizing revenue opportunities with the Fan Engagement KPI Dashboard in Excel. Track social media metrics, ticket sales, merchandise purchases, and more to improve your fan engagement strategies and drive business success.
Click here to read the Detailed blog post
Visit our YouTube channel to learn step-by-step video tutorials
Youtube.com/@PKAnExcelExpert
Compatibility and Requirements
- Works in Microsoft Excel desktop (Excel 2016 or later, or Microsoft 365).
- New to Excel? Microsoft’s Excel for Windows training covers the basics.
Frequently Asked Questions
Which fan engagement KPIs does the dashboard track?
It tracks social media interactions, event attendance, ticket sales, merchandise sales and fan sentiment.
Which social media metrics are included?
It tracks likes, shares, comments and follower growth.
Can I see which events sell best?
Yes. Ticket sales and attendance tracking show which events attract the most fans and revenue.
Where does fan sentiment come from?
You enter feedback, reviews and survey results, and the dashboard tracks sentiment from that data.
Is there a Power BI version?
Yes. The Fan Engagement KPI Dashboard in Power BI covers the same KPIs in Power BI.
Related Fan and Sports Templates
- Fan Engagement KPI Dashboard in Power BI: the same KPIs in Power BI
- Fan Engagement KPI Dashboard in Google Sheets: the same KPIs in Google Sheets
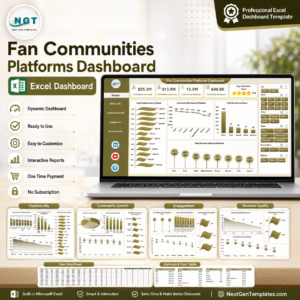
- Fan Communities Platforms Dashboard in Excel: track fan community platforms
- Sports League KPI Dashboard in Excel: KPIs for sports leagues
- Marketing and Social Media Analytics Kit: 7 marketing templates in one download
Browse all Excel KPI dashboards or the Excel sales and marketing templates.




























Reviews
There are no reviews yet.