


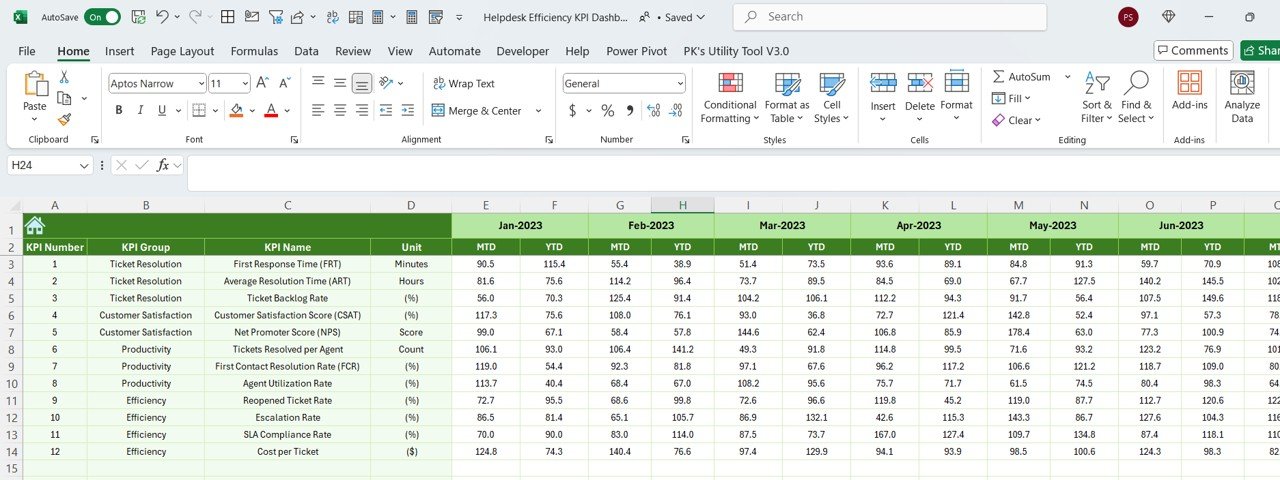


The Helpdesk Efficiency KPI Dashboard in Excel is a powerful tool designed to help businesses, IT teams, and customer support departments monitor and optimize the performance of their helpdesk operations. This Excel-based dashboard allows you to track key performance indicators (KPIs) such as response time, resolution time, customer satisfaction, and ticket volume, providing valuable insights that help improve overall helpdesk efficiency.
Whether you’re managing a small team or overseeing a large-scale customer support operation, this dashboard helps you stay on top of essential metrics, make data-driven decisions, and identify areas for improvement. With customizable features and real-time data tracking, the Helpdesk Efficiency KPI Dashboard is the perfect tool for optimizing your helpdesk performance and ensuring high-quality customer support.
Key Features of the Helpdesk Efficiency KPI Dashboard in Excel
📊 Response & Resolution Time Tracking
Monitor the average time it takes for your team to respond to and resolve customer tickets. This helps ensure that customers receive timely support and that your team’s response times are optimized.
📈 Ticket Volume Management
Track the number of support tickets created, closed, and pending. Use this information to assess workload distribution and ensure your team has the capacity to handle incoming requests.
📅 Customer Satisfaction Monitoring
Measure customer satisfaction using metrics like Net Promoter Score (NPS) or CSAT (Customer Satisfaction Score). These KPIs provide valuable feedback on how well your team is performing in resolving customer issues.
⚙️ Issue Categorization & Trend Analysis
Categorize and track common support issues to identify trends. This helps you identify recurring problems, enabling your team to address them more efficiently and proactively.
🔄 Customizable KPIs & Metrics
Customize the dashboard to include the KPIs that are most important to your business. Whether you need to track escalated issues, ticket types, or service level agreements (SLAs), you can adjust the metrics to fit your needs.
📉 Data Visualization & Reporting
The dashboard includes easy-to-read charts and graphs that provide a visual representation of your helpdesk’s performance. Use this data to generate reports, share insights with your team, and make informed decisions.
Why You’ll Love the Helpdesk Efficiency KPI Dashboard in Excel

✅ Centralized Helpdesk Performance Tracking
Track all essential helpdesk KPIs in one place, from response time to customer satisfaction, making it easy to monitor and improve your operations.
✅ Optimized Customer Support
Use the data from the dashboard to identify inefficiencies in your support process and implement changes that reduce response and resolution times.
✅ Improve Customer Satisfaction
Track customer satisfaction metrics and get real-time feedback, allowing you to improve your service quality and build better customer relationships.
✅ Data-Driven Decision Making
Make informed decisions based on real-time performance data. Whether it’s adjusting team capacity or refining processes, the dashboard gives you the insights you need.
✅ Customizable & Scalable
The dashboard can be customized to suit your specific helpdesk needs, whether you’re managing a small customer support team or a large enterprise with multiple departments.
What’s Inside the Helpdesk Efficiency KPI Dashboard in Excel?
Response & Resolution Time Tracking: Monitor the time it takes to respond to and resolve tickets.
Ticket Volume Management: Track the number of tickets created, closed, and pending.
Customer Satisfaction Monitoring: Measure satisfaction using NPS, CSAT, or other metrics.
Issue Categorization & Trend Analysis: Track recurring issues and identify trends.
Customizable KPIs: Adjust the dashboard to fit your specific performance metrics.
Data Visualization: Visualize your helpdesk performance with easy-to-read charts and graphs.
How to Use the Helpdesk Efficiency KPI Dashboard in Excel
1️⃣ Download the Template: Get access to the Helpdesk Efficiency KPI Dashboard in Excel instantly.
2️⃣ Input Your Helpdesk Data: Add your team’s response time, resolution time, ticket volume, and satisfaction scores.
3️⃣ Track KPIs & Performance: Monitor key metrics such as response time, customer satisfaction, and ticket volume.
4️⃣ Analyze Trends & Data: Use issue categorization and trend analysis to identify areas for improvement.
5️⃣ Optimize Helpdesk Operations: Use the insights to optimize workflows, improve efficiency, and enhance customer satisfaction.
Who Can Benefit from the Helpdesk Efficiency KPI Dashboard in Excel?
🔹 Helpdesk Managers & Teams
🔹 Customer Support Departments
🔹 IT Support Teams
🔹 Business Owners & Operations Managers
🔹 E-commerce & Online Service Providers
🔹 Enterprises with Large Customer Support Operations
🔹 Small & Medium Enterprises (SMBs)
Optimize your helpdesk efficiency and improve customer support with the Helpdesk Efficiency KPI Dashboard in Excel. Track response and resolution times, manage ticket volumes, and enhance customer satisfaction—all from one easy-to-use tool.
Click here to read the Detailed blog post
Visit our YouTube channel to learn step-by-step video tutorials
Youtube.com/@PKAnExcelExpert
Compatibility and Requirements
- Works in Microsoft Excel desktop (Excel 2016 or later, or Microsoft 365).
- The KPIs are shown in interactive charts. Microsoft explains Excel charts in Create a chart from start to finish.
Frequently Asked Questions
What does the Helpdesk Efficiency KPI Dashboard track?
It tracks response and resolution times, tickets created, closed and pending, customer satisfaction such as NPS or CSAT, and recurring issues by category.
How do I add my own data?
Add your team’s response time, resolution time, ticket volume and satisfaction scores. Then use the dashboard to monitor the KPIs.
Can I spot recurring problems?
Yes. Issue categorization and trend analysis show which issues keep coming back.
Can I change the KPIs?
Yes. You can adjust the dashboard to fit your own performance metrics.
Is there a Google Sheets or Power BI version?
Yes. The Helpdesk Efficiency KPI Dashboard in Google Sheets and the Helpdesk Efficiency KPI Dashboard in Power BI cover the same KPIs on those platforms.
Related Helpdesk and Support Templates
- Helpdesk Efficiency KPI Dashboard in Google Sheets: the same dashboard in Google Sheets
- Helpdesk Efficiency KPI Dashboard in Power BI: the same KPIs in Power BI
- IT Helpdesk KPI Dashboard in Excel: KPIs for an IT helpdesk
- Customer Service KPI Dashboard in Excel: KPIs for a customer service team
- IT and Cybersecurity Operations Bundle: 8 IT templates for Excel and Power BI
Browse all Excel KPI dashboards or the Excel IT templates.































Reviews
There are no reviews yet.