

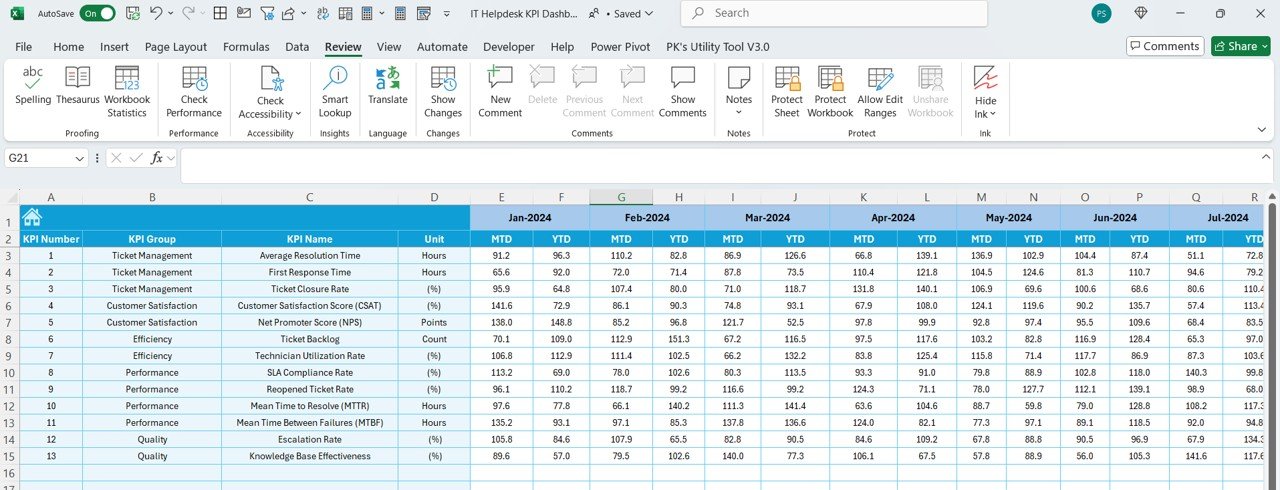
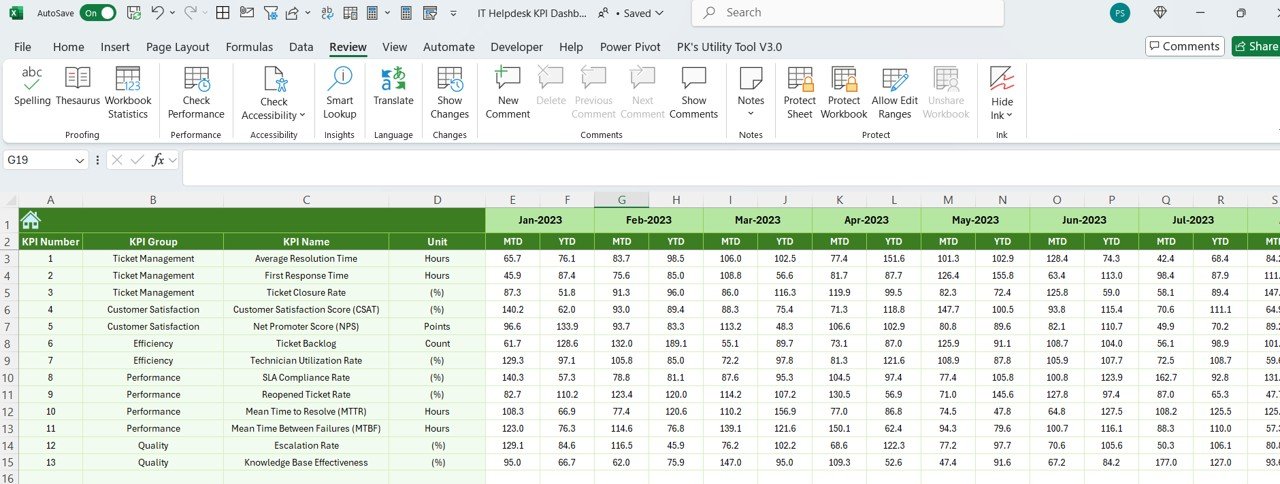
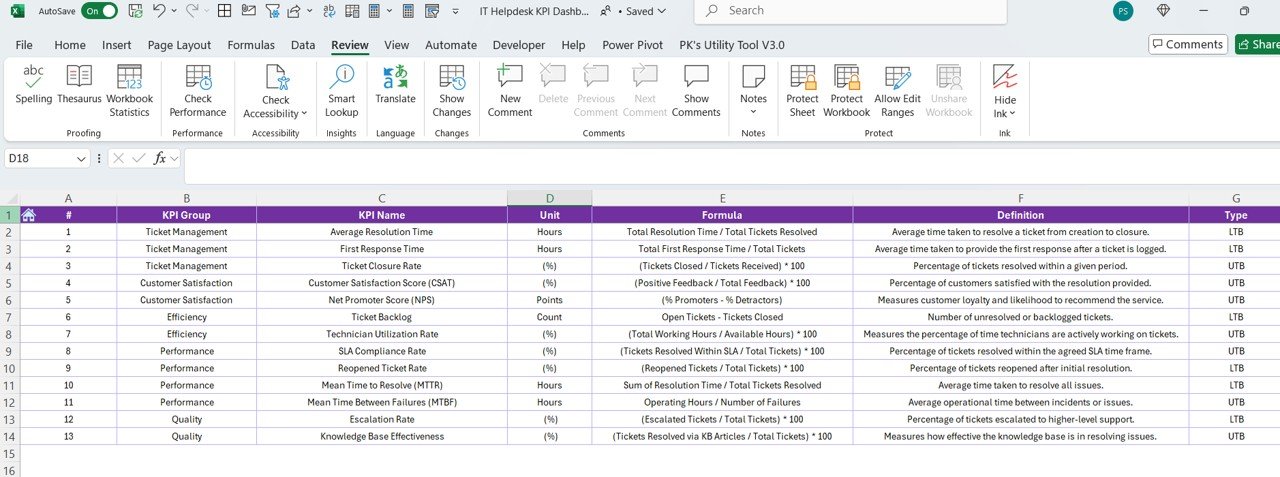

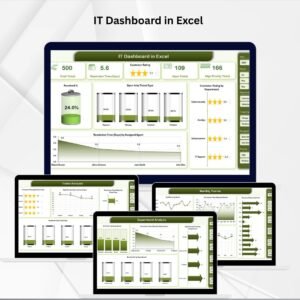
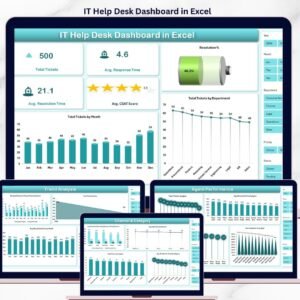
The IT Helpdesk KPI Dashboard in Excel is a powerful tool designed for IT departments and helpdesk teams to monitor, track, and optimize the performance of their support services. This Excel-based dashboard allows businesses to track key performance indicators (KPIs) such as ticket resolution time, response time, customer satisfaction, and ticket backlog, helping you ensure efficient service delivery and improved customer experience.
With the IT Helpdesk KPI Dashboard, IT managers and teams can identify bottlenecks, assess support team efficiency, and continuously improve their operations. The intuitive interface and customizable features make this tool perfect for small businesses or large enterprises that need to manage IT support tickets effectively.
Key Features of the IT Helpdesk KPI Dashboard in Excel
📊 Comprehensive KPI Tracking
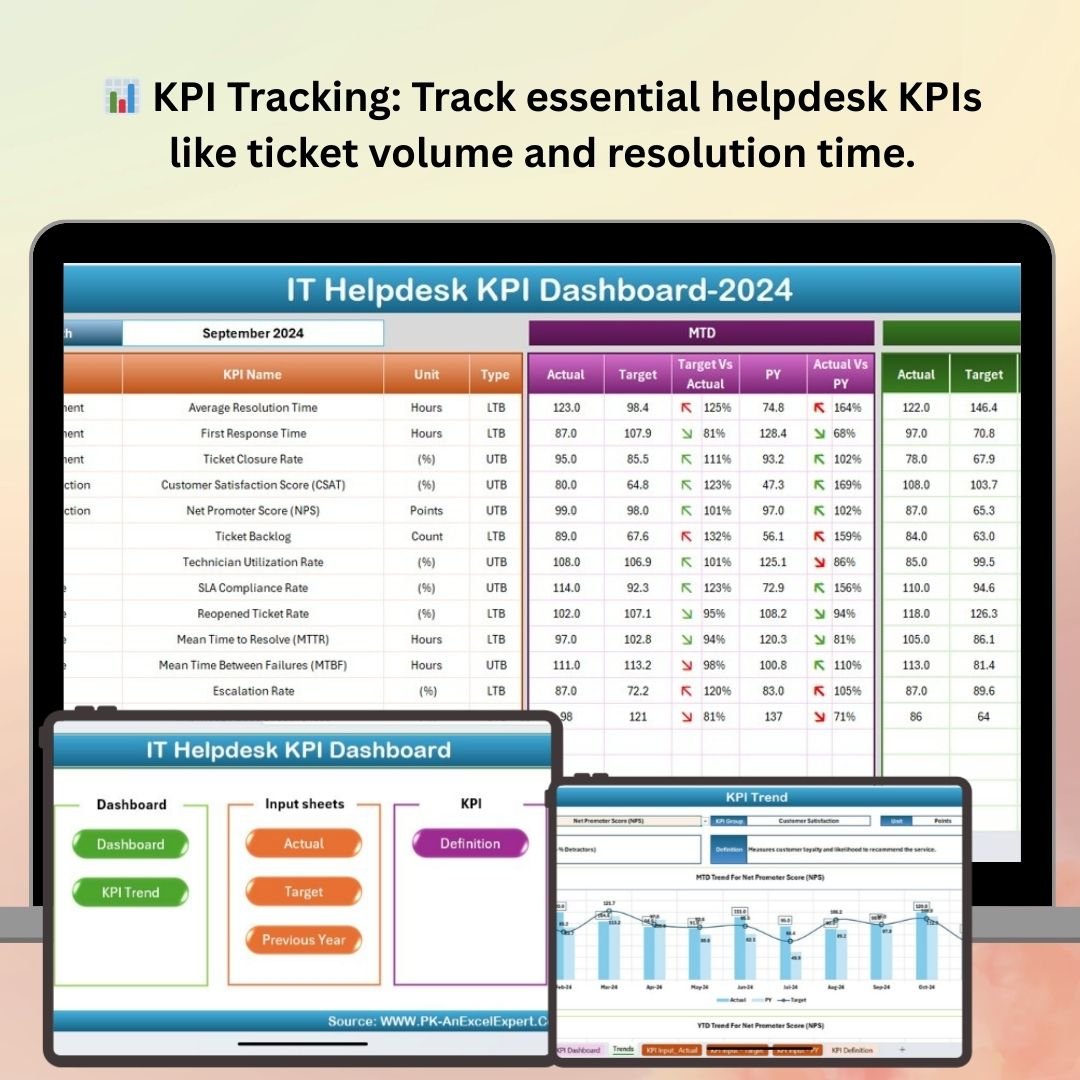
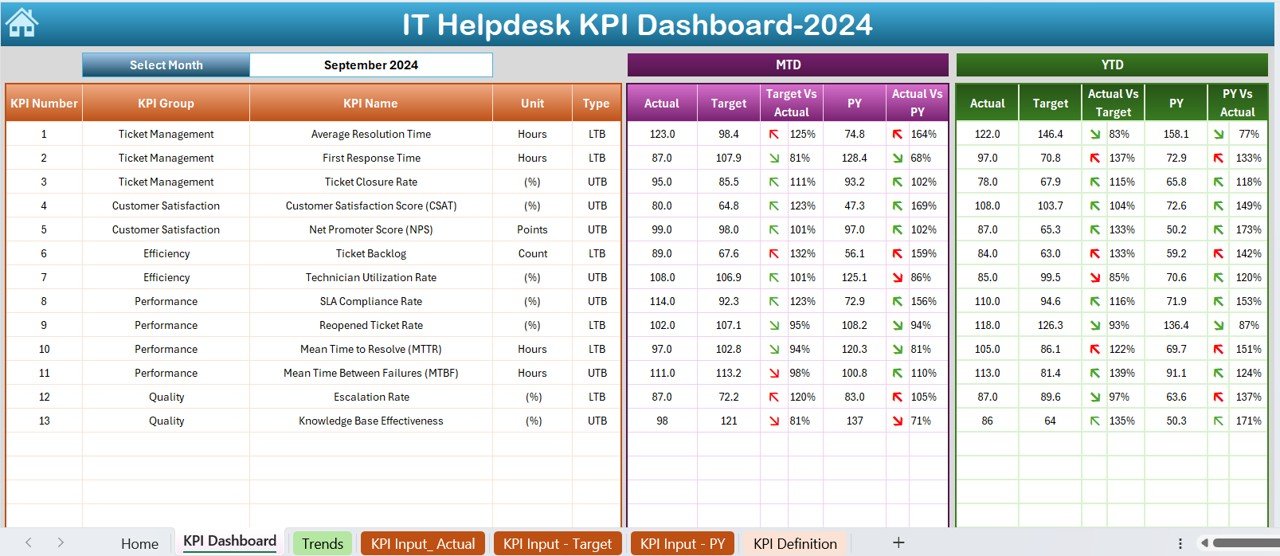
Track essential helpdesk KPIs, including ticket volume, response time, resolution time, customer satisfaction, and ticket backlog. Get a comprehensive view of your IT helpdesk operations at a glance.
⏱ Ticket Resolution Time Monitoring
Monitor the time taken to resolve IT support tickets. Identify delays and inefficiencies in ticket resolution and implement strategies to improve response times.
📅 Ticket Volume Analysis
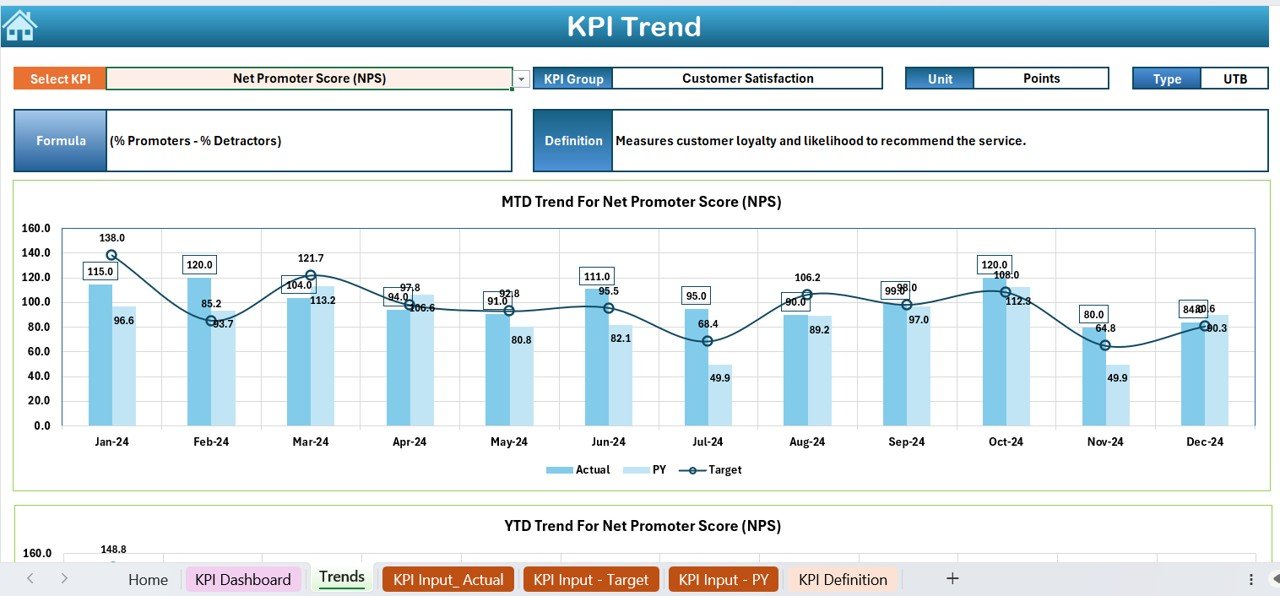
Track the number of support tickets over time and analyze trends in ticket volume. This helps you understand peak periods and plan resources accordingly.
📉 Customer Satisfaction Tracking
Evaluate the quality of your IT support services by tracking customer satisfaction scores, NPS (Net Promoter Score), or survey feedback.
🔄 Ticket Backlog Monitoring
Monitor the number of unresolved tickets in your system and ensure timely follow-up. Keep track of ticket aging to prevent bottlenecks and ensure that nothing falls through the cracks.
📈 Real-Time Data & Reporting
Generate real-time reports to assess team performance, ticket handling times, and service level agreements (SLAs). Use the data to make informed decisions and improve service quality.
⚙️ Customizable Dashboard
Customize the dashboard to match your specific IT helpdesk needs. Modify KPIs, adjust time periods, and personalize the layout to suit your organizational requirements.
Why You’ll Love the IT Helpdesk KPI Dashboard in Excel
✅ Track IT Support Efficiency
Monitor and optimize your IT helpdesk’s performance with KPIs like resolution time, customer satisfaction, and ticket volume.
✅ Improve Response & Resolution Time
Identify delays in ticket resolution and work on strategies to improve response times, resulting in faster service and better customer satisfaction.
✅ Boost Customer Satisfaction
Track feedback from customers and use the insights to enhance your IT support services, improving the overall user experience.
✅ Prevent Ticket Backlog
Keep a close eye on your helpdesk’s workload and prevent backlogs by identifying tickets that require follow-up and resolution.
✅ Customizable for Your Needs
Easily tailor the dashboard to fit your organization’s IT support workflow, allowing you to track the most relevant KPIs for your team.
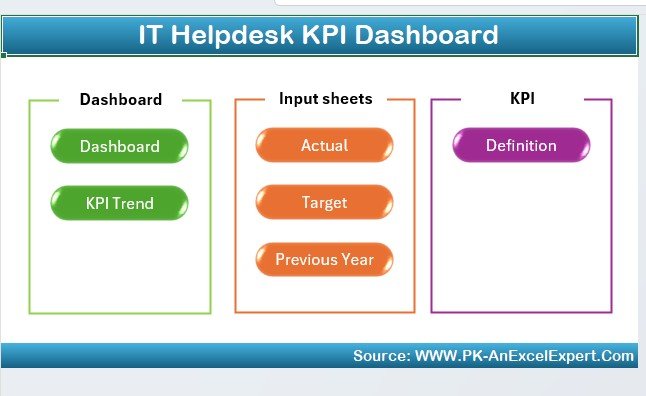
What’s Inside the IT Helpdesk KPI Dashboard in Excel?
Ticket Volume Tracking: Monitor the number of support tickets and identify trends.
Ticket Resolution Time: Track how long it takes to resolve tickets and improve response efficiency.
Customer Satisfaction Metrics: Monitor customer feedback and satisfaction levels.
Ticket Backlog Monitoring: Track unresolved tickets and prevent bottlenecks.
Real-Time Reporting: Generate detailed performance reports and identify areas for improvement.
Customizable KPIs: Adjust the dashboard to your organization’s unique needs and priorities.
How to Use the IT Helpdesk KPI Dashboard in Excel
1️⃣ Download the Template: Instantly access the IT Helpdesk KPI Dashboard in Excel.
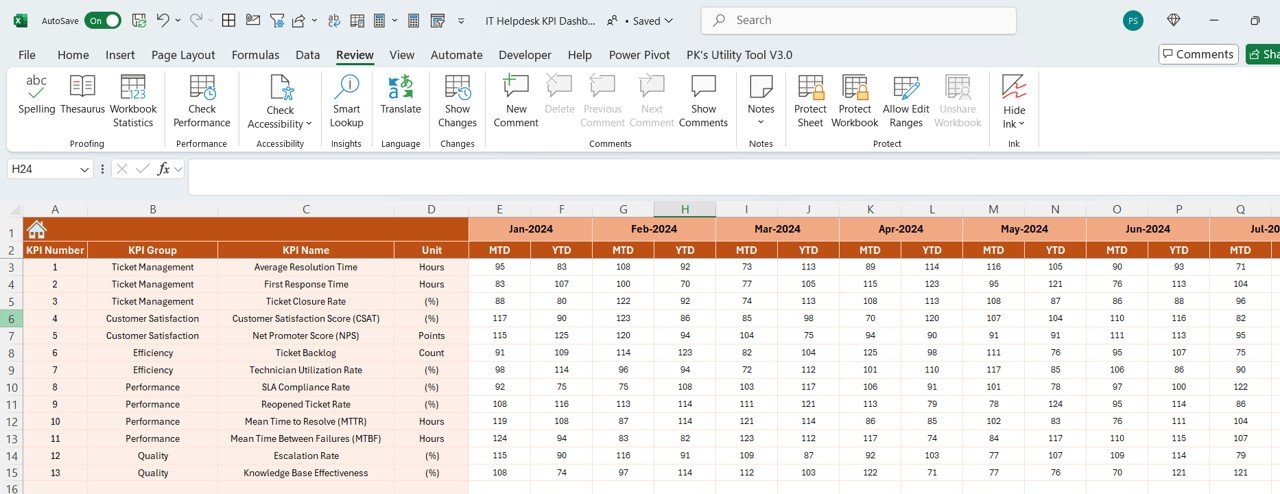
2️⃣ Input Your Ticket Data: Enter data such as ticket volume, resolution time, and customer feedback into the dashboard.
3️⃣ Track Performance Metrics: Monitor key KPIs to evaluate the performance of your helpdesk team.
4️⃣ Analyze Trends & Insights: Use time-based data to identify trends in ticket volume, resolution times, and customer satisfaction.
5️⃣ Improve Your IT Support: Use insights to improve workflows, response times, and customer satisfaction, optimizing your IT helpdesk operations.
Who Can Benefit from the IT Helpdesk KPI Dashboard in Excel?
🔹 IT Helpdesk Managers & Teams
🔹 IT Support Service Providers
🔹 Customer Service & Support Managers
🔹 Small & Medium Enterprises (SMBs)
🔹 Large Enterprises with IT Support Departments
🔹 Businesses Looking to Improve Their IT Support Operations
Optimize your IT support services with the IT Helpdesk KPI Dashboard in Excel. Track performance, reduce response times, and enhance customer satisfaction to deliver exceptional IT support.
Click here to read the Detailed blog post
Visit our YouTube channel to learn step-by-step video tutorials
Youtube.com/@PKAnExcelExpert















Reviews
There are no reviews yet.