




Efficient water management is vital for sustainability, cost control, and service reliability. The Water Supply KPI Scorecard in Excel is a ready-to-use performance tracking solution that helps water utilities, municipal boards, and private service providers monitor key metrics and drive operational excellence.
This data-driven Excel dashboard provides a centralized platform to measure, compare, and analyze KPIs such as production efficiency, non-revenue water, quality compliance, customer response, and financial performance. It’s designed to turn raw operational data into actionable insights — empowering managers to make informed, real-time decisions.
⚙️ Key Features of the Water Supply KPI Scorecard in Excel
📊 4 Organized Sheets – Scorecard Dashboard, KPI Trend, Input Data, and KPI Definition.
🎯 MTD & YTD Views – Switch between short-term and cumulative results.
📈 Actual vs Target vs Previous Year – Analyze performance in real time.
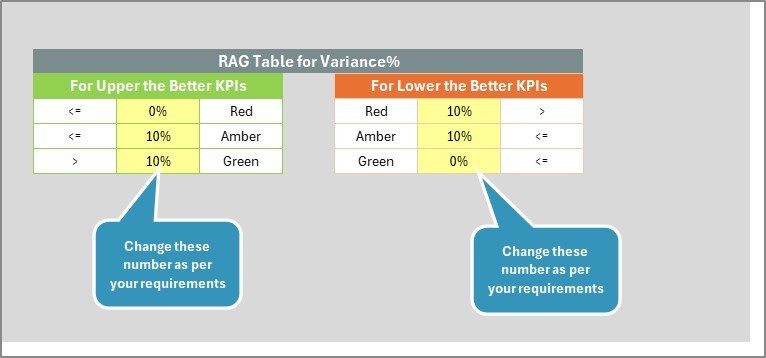
🟢 Color-Coded Indicators – Instantly spot on-track (green), at-risk (yellow), or underperforming (red) KPIs.
📘 Dynamic Dropdowns – Choose months or KPIs easily.
💡 Interactive Charts – Visualize trends and progress over time.
⚙️ Automated Formulas – No manual calculations or coding required.
💼 Fully Editable & Scalable – Customize to match your operational needs.
🧭 Structure of the Template
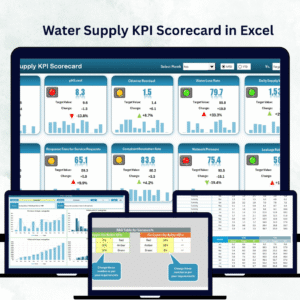
1️⃣ Scorecard Sheet – Main Dashboard
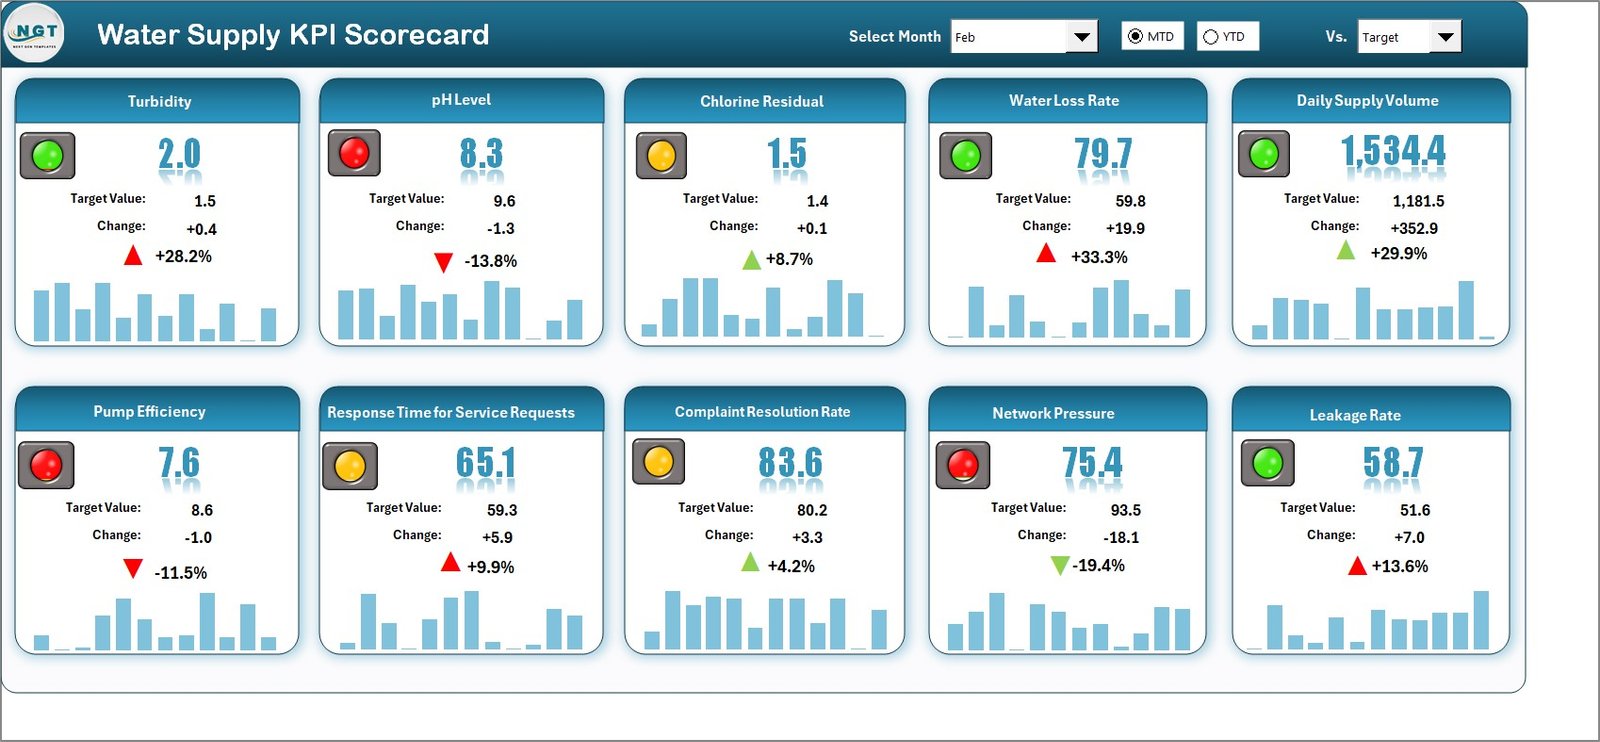
This is your command center.
Dropdown menus to select month or view (MTD/YTD).
Displays 10 KPIs per view for clarity.
Actual vs Target results visualized with color indicators.
💡 Instantly identify which areas are excelling and which need improvement.
2️⃣ KPI Trend Sheet – Performance Over Time
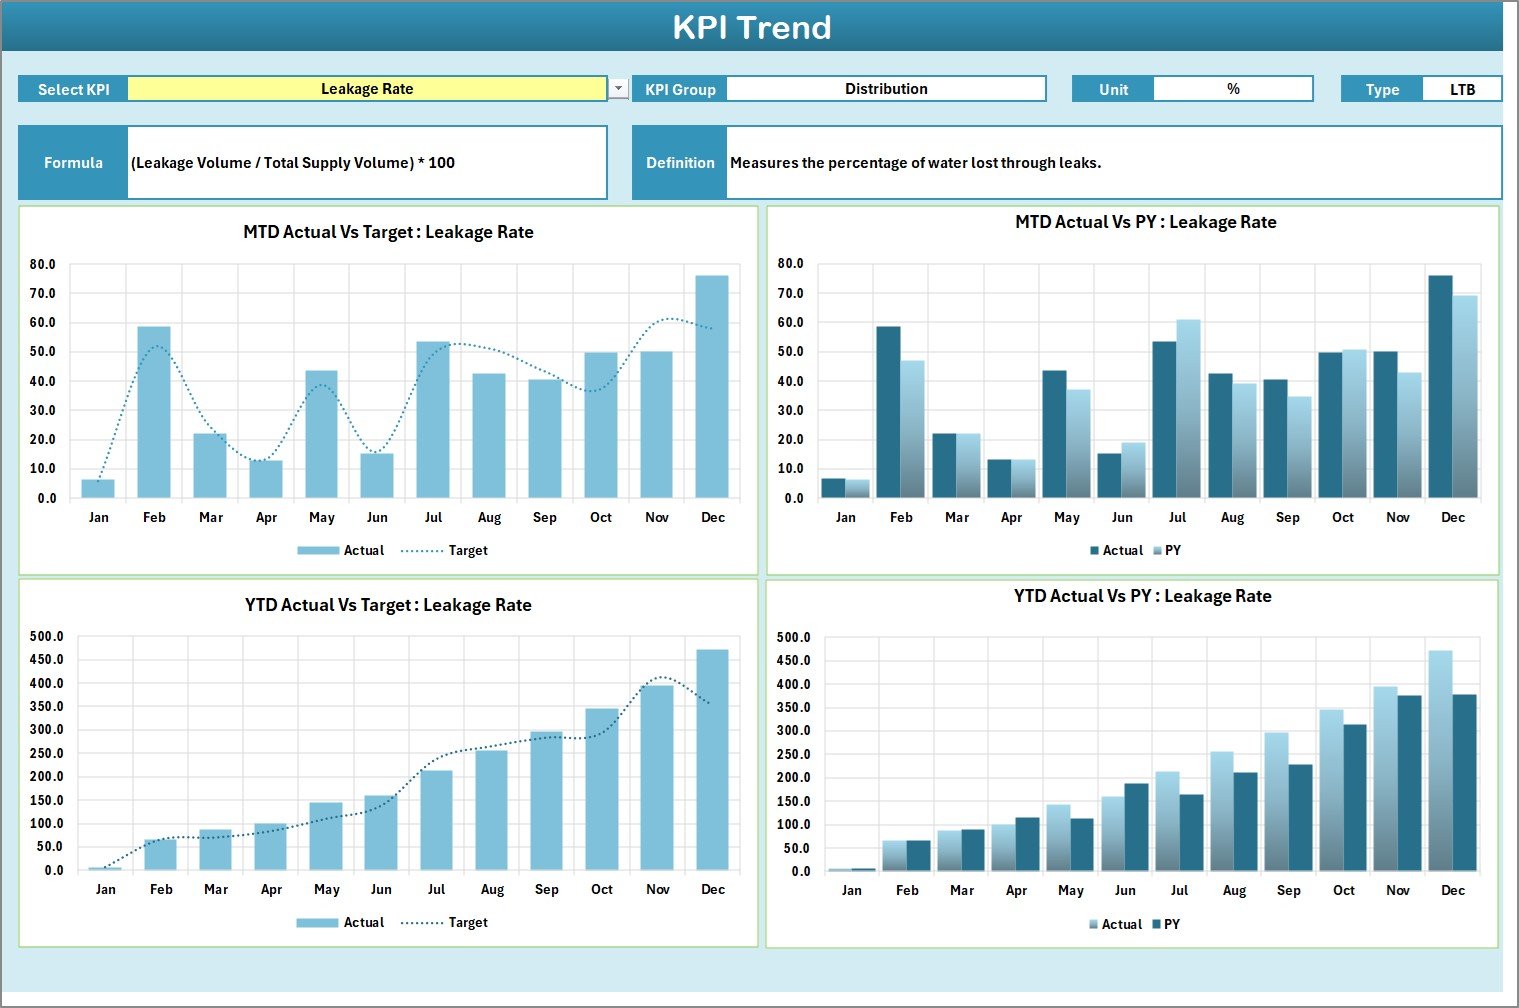
Track monthly and yearly performance for any KPI.
Dropdown (C3) to select the KPI.
Displays KPI details like Group, Unit, and Formula.
Charts compare Actual, Target, and Previous Year (MTD/YTD).
Perfect for performance reviews and progress reports.
3️⃣ Input Data Sheet – Data Management Hub
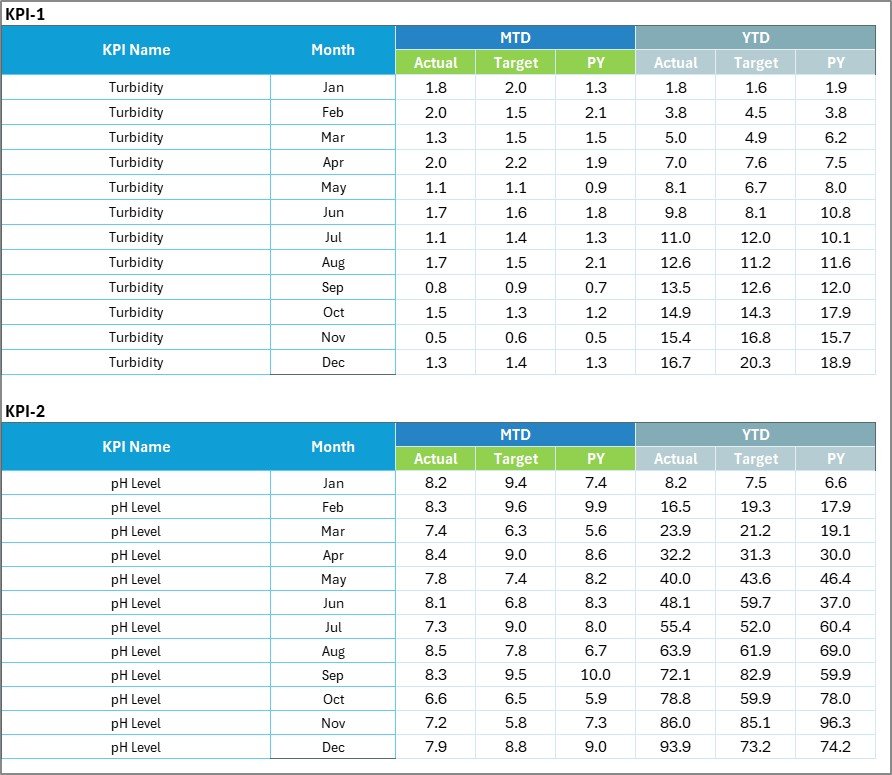
Store monthly data for all KPIs in one place.
Enter Actual, Target, and Previous Year metrics.
Dashboard updates automatically with new entries.
Eliminates repetitive manual reporting.
4️⃣ KPI Definition Sheet – Consistency and Clarity
Document your performance indicators for transparency.
Includes KPI Name, Group, Unit, Formula, Definition, and Type (UTB/LTB).
Ensures every stakeholder interprets performance the same way.
💧 Why Use Excel for KPI Tracking?
Excel is the most accessible and flexible tool for performance monitoring.
Key Benefits:
✅ No need for specialized software.
✅ Highly customizable for local and organizational needs.
✅ Easy integration with existing systems.
✅ Visual dashboards using charts and conditional formatting.
✅ Cost-effective, scalable, and beginner-friendly.
The Water Supply KPI Scorecard combines automation and simplicity, making it suitable for small departments and large water utilities alike.
📈 Advantages of Using the Water Supply KPI Scorecard in Excel
✅ Data-Driven Decision-Making – View real-time MTD/YTD performance and take quick action.
✅ Improved Accountability – Assign KPIs to teams and track responsibility.
✅ Centralized Data Management – Keep all records organized in one file.
✅ Visual Insights – Charts and color codes make analysis effortless.
✅ Strategic Planning Support – Compare monthly and yearly trends to plan budgets.
✅ Cost Efficiency – High-end functionality at zero additional software cost.
🌍 Practical Applications
Municipal Water Departments – Track production, leakage, and service delivery.
Private Utilities – Monitor energy costs, treatment efficiency, and revenue.
Public Health Programs – Measure water quality compliance and access coverage.
Engineering Teams – Evaluate pumping and distribution efficiency.
🧠 Best Practices for Optimal Use
✔ Define 10–15 measurable and relevant KPIs.
✔ Update monthly with verified data.
✔ Use visual alerts to highlight exceptions.
✔ Compare MTD, YTD, and Previous Year for insights.
✔ Protect formulas and key cells to avoid accidental edits.
✔ Conduct quarterly reviews to realign targets.
✔ Back up data regularly.
These practices ensure your scorecard remains reliable, consistent, and insightful.
💡 Example Impact
A city water board implemented this scorecard and achieved:
12% faster leak repair turnaround.
8% reduction in pumping energy costs.
5% improvement in water quality compliance.
By tracking the right KPIs consistently, the board increased operational efficiency and improved customer satisfaction significantly.
🧩 Customizable for Any Organization
You can easily:
Add or remove KPIs.
Modify formulas or visuals.
Insert slicers, filters, or charts.
Change colors or branding.
Export data to Power BI for advanced visualization.
Adapt it once — and use it for years of performance reporting.
🧾 Conclusion
The Water Supply KPI Scorecard in Excel isn’t just a dashboard — it’s a complete performance management framework for water utilities.
It empowers teams to track progress, reduce non-revenue water, improve customer satisfaction, and enhance sustainability.
Whether you manage a local utility or a regional infrastructure network, this Excel scorecard transforms your operations into a transparent, measurable, and data-driven system.
💧 Start today — measure what matters, manage efficiently, and sustain your success.
Click here to read the Detailed blog post
👉 Visit our YouTube Channel: https://www.youtube.com/@PKAnExcelExpert
Watch the step-by-step video tutorial:
Compatibility and Requirements
- Works in Microsoft Excel desktop (Excel 2016 or later, or Microsoft 365).
- Microsoft’s guide Use conditional formatting to highlight information explains how the green, yellow and red indicators work.
Frequently Asked Questions
Which sheets are in the Water Supply KPI Scorecard?
Four: the Scorecard sheet, the KPI Trend sheet, the Input Data sheet and the KPI Definition sheet.
How many KPIs does the scorecard show?
Ten KPIs per view, with Actual against Target shown through color indicators.
Can I switch between MTD and YTD?
Yes. Dropdown menus on the Scorecard sheet let you choose the month and the MTD or YTD view.
What do I enter each month?
Actual, Target and Previous Year values in the Input Data sheet. The scorecard updates from these entries.
What is recorded for each KPI?
KPI name, group, unit, formula, definition and type (UTB or LTB), kept in the KPI Definition sheet.
Related Water Utility Templates
- Water Supply KPI Dashboard in Excel: the same topic as a KPI dashboard
- Water Utilities Dashboard in Excel: a full utilities dashboard
- Water Production KPI Dashboard in Excel: focus on production KPIs
- Water Utilities Dashboard in Power BI: an interactive Power BI option
- KPI Scorecard Mega Pack: 12 Excel and Google Sheets scorecards in one bundle
Browse all Excel KPI dashboards.



















Reviews
There are no reviews yet.