

Managing water utility operations is a huge responsibility. You must track water production, supply reliability, distribution losses, treatment quality, revenue collection, maintenance activities, and customer service—all at the same time. When this information stays scattered across Excel files, printed logs, or manual reports, the organization loses clarity. Decision-making slows down, issues go unnoticed, and efficiency drops.
That’s why the Water Utilities KPI Dashboard in Excel becomes an essential tool for utility teams. It brings every critical KPI—operational, financial, and service-related—into one visual, interactive, and easy-to-use dashboard. With automated calculations, MTD & YTD comparisons, PY benchmarks, and real-time trend analysis, this dashboard transforms how water boards and utility departments track performance.
Whether you manage a municipal water board, treatment plant, distribution network, or private utility company, this Excel-based dashboard gives you the power to make data-driven decisions with confidence.
🚀 Key Features of the Water Utilities KPI Dashboard in Excel
🏠 Home Sheet – Easy One-Click Navigation
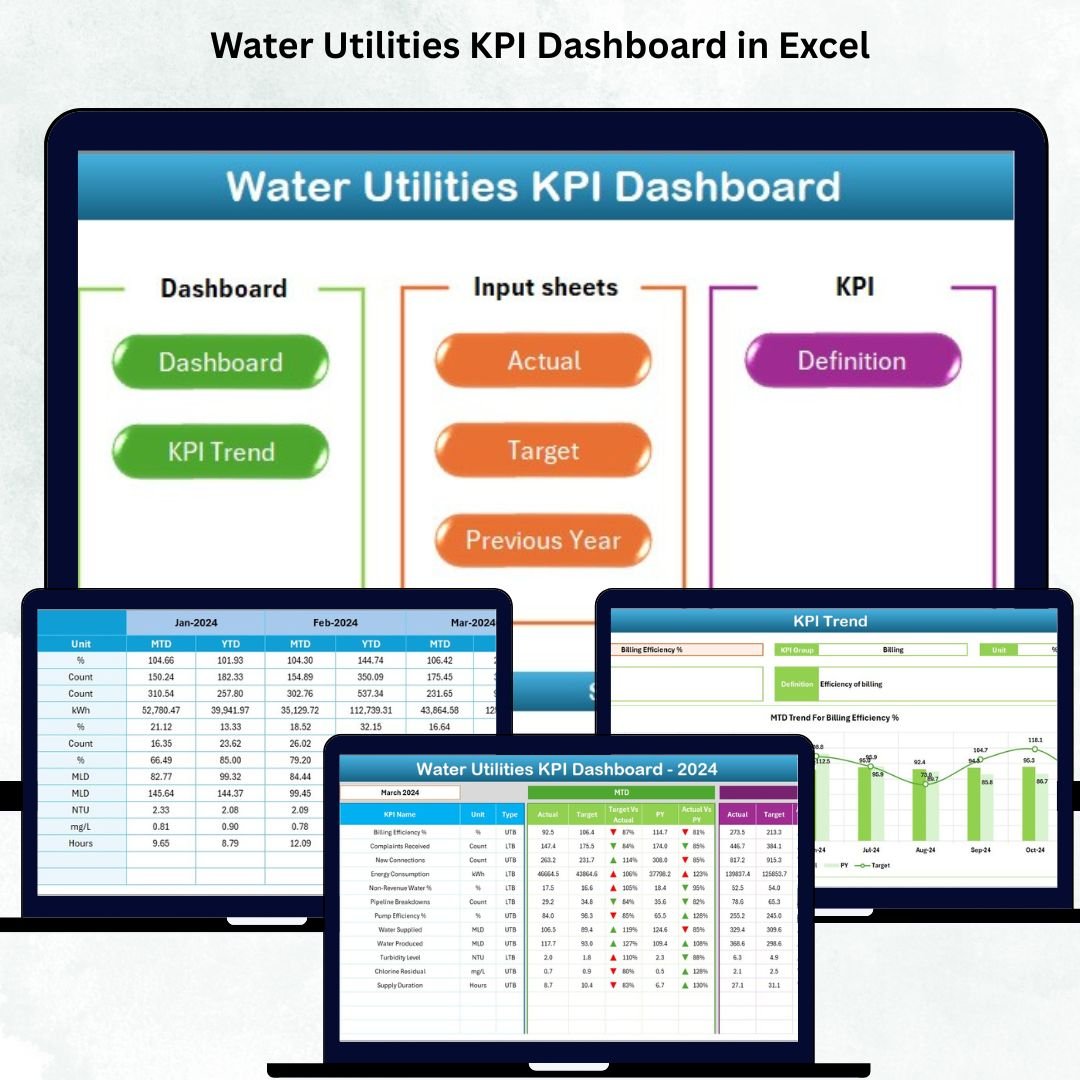
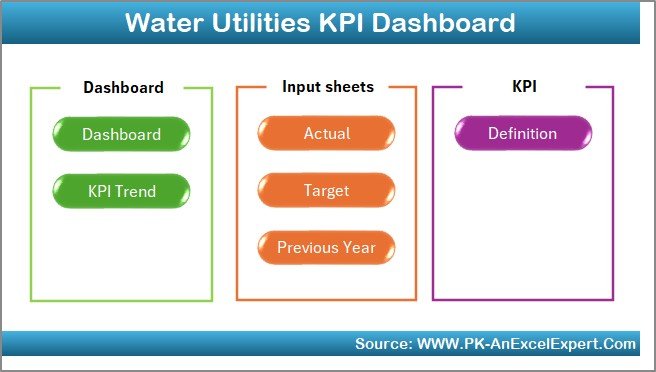
The Home Sheet acts as your control panel. It contains navigation buttons leading to:
Dashboard
KPI Trend
Actual Numbers
Target Numbers
Previous Year Numbers
KPI Definition
This ensures every user—from engineers to supervisors—can move across pages instantly.
📊 Dashboard Sheet – Complete Water Utility KPI Overview
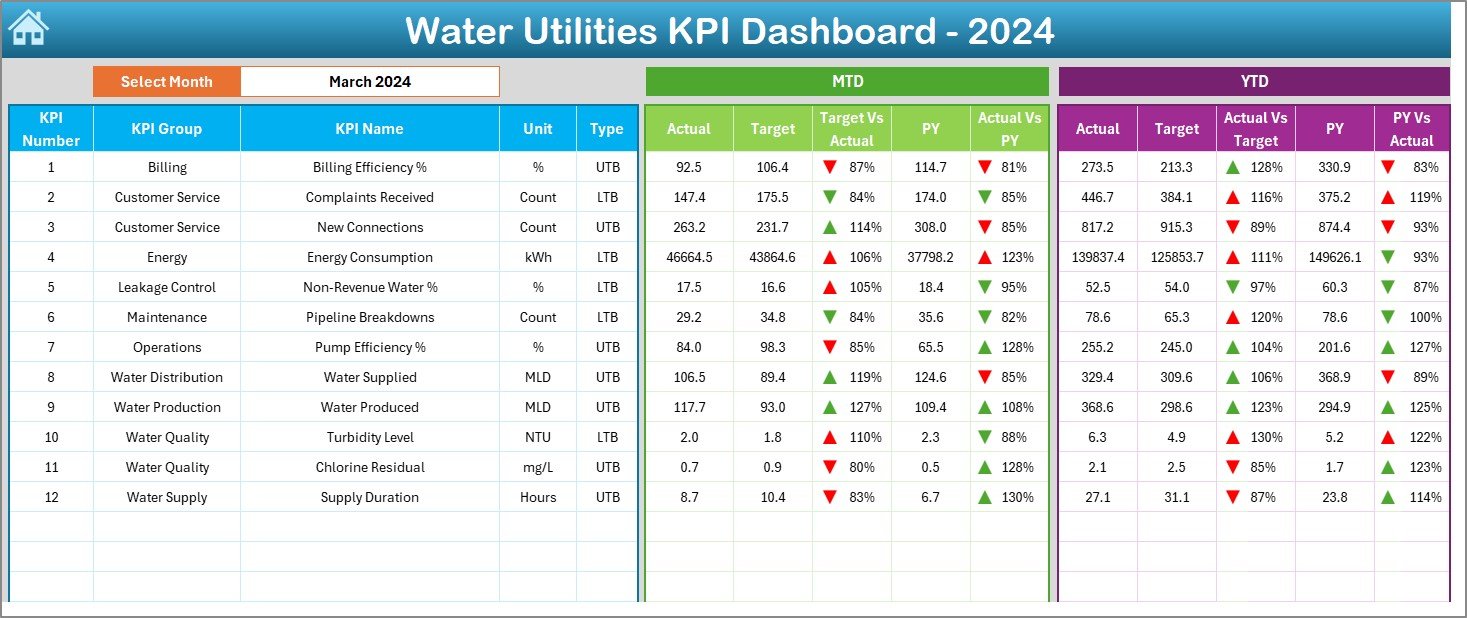
This is the core of the entire file. With a simple month selection (Cell D3), the entire dashboard updates automatically.
You can view:
MTD Actual – Current Month-to-Date performance
MTD Target – Benchmark for the month
MTD Previous Year – Same month performance from last year
Target vs Actual (MTD %) – Up (▲) or Down (▼) indicator
PY vs Actual (MTD %) – Year-on-year improvement
For yearly analysis, you also get:
YTD Actual
YTD Target
YTD Previous Year
Target vs Actual (YTD %)
PY vs Actual (YTD %)
Color-coded arrows help users quickly identify whether performance is improving, declining, or meeting expectations.
📈 KPI Trend Sheet – Visual Analysis at Its Best
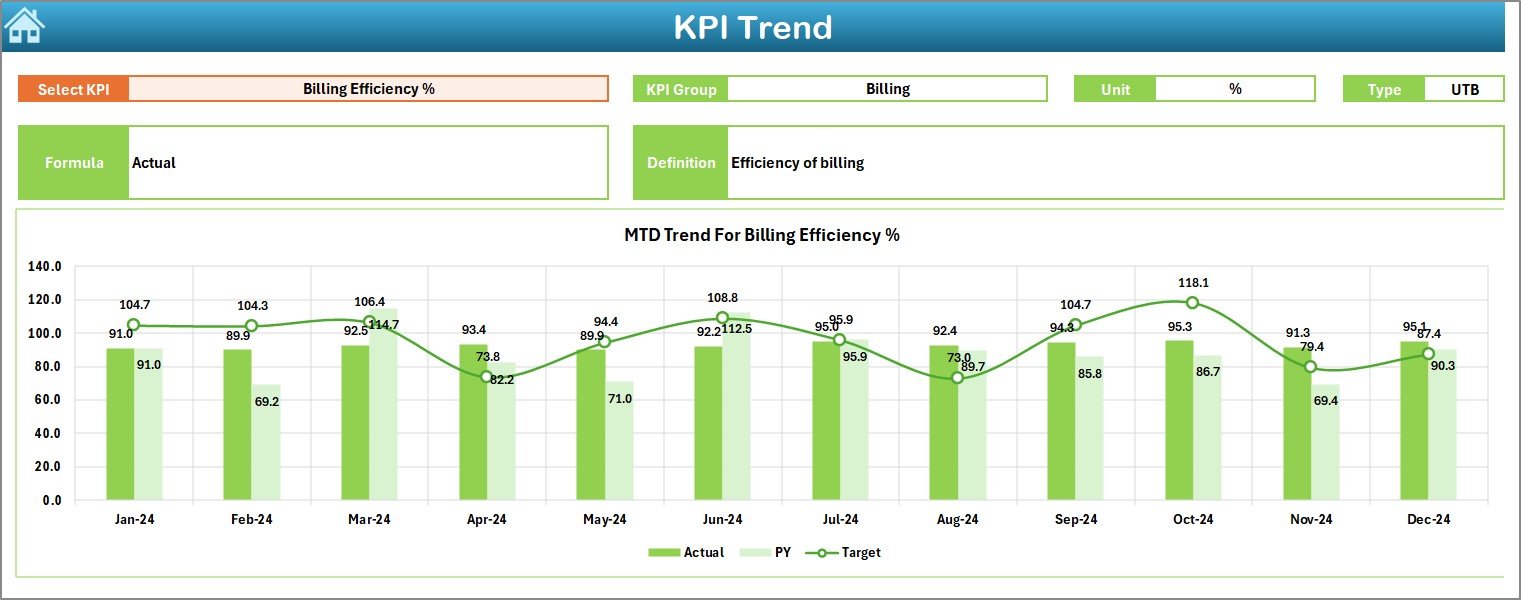
The KPI Trend Sheet allows long-term tracking of performance patterns.
Select the KPI from the dropdown (Cell C3) and instantly view:
KPI Group (Production, Revenue, Complaints, Maintenance, etc.)
Unit of Measurement (ML, %, litres, count)
KPI Type (UTB – Upper the Better, LTB – Lower the Better)
Formula for calculation
KPI Definition for clarity
Two powerful combo charts display:
MTD Trend: Actual vs Target vs Previous Year
YTD Trend: Actual vs Target vs Previous Year
These charts help managers detect leakages, study seasonality, monitor plant efficiency, and plan improvements.
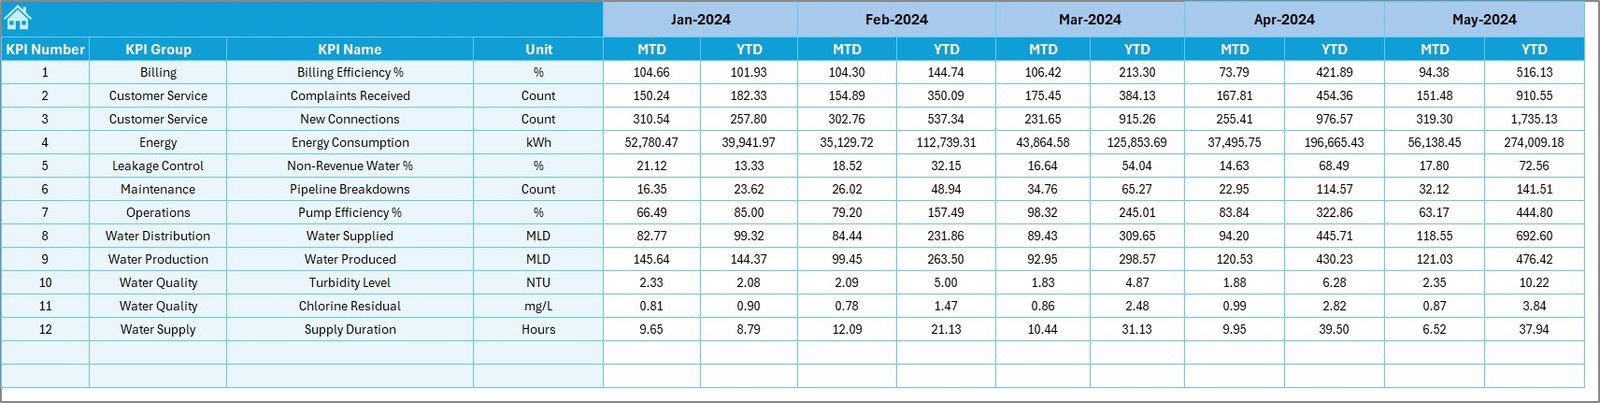
📝 Actual Numbers Input Sheet – Monthly Updates Made Easy
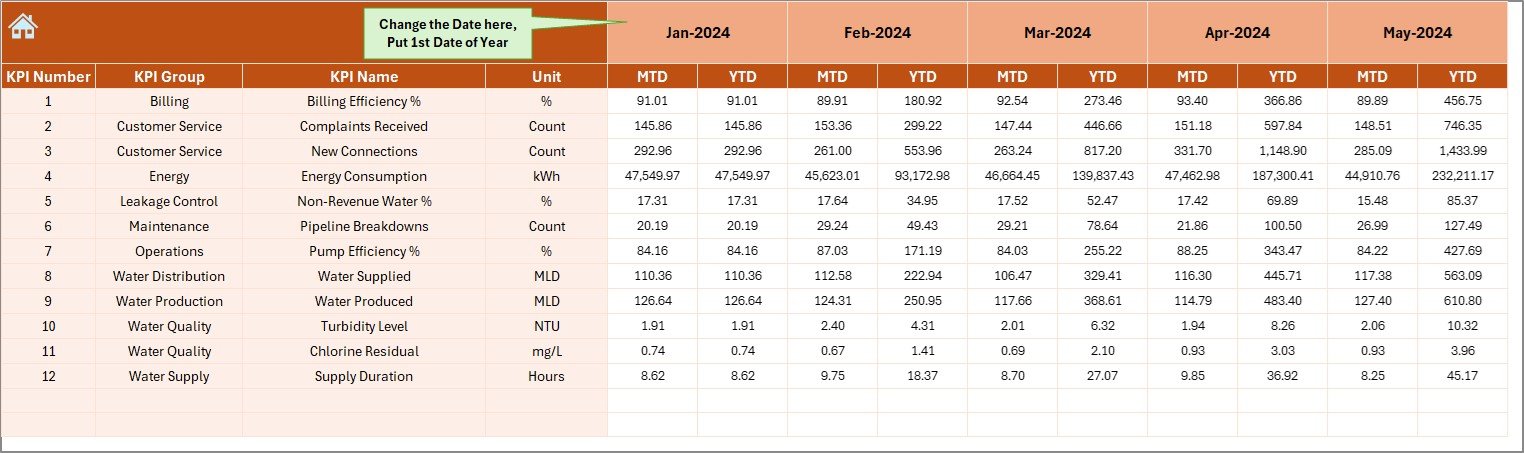
In this sheet, you enter:
KPI Name
Month
MTD Value
YTD Value
You can adjust the start month from Cell E1. This sheet ensures clean and structured data entry for accurate dashboard updates.
🎯 Target Sheet – Define Monthly & Yearly Benchmarks
Record:
Target MTD
Target YTD
KPI Name
Month
Once updated, the dashboard compares targets vs actuals automatically.
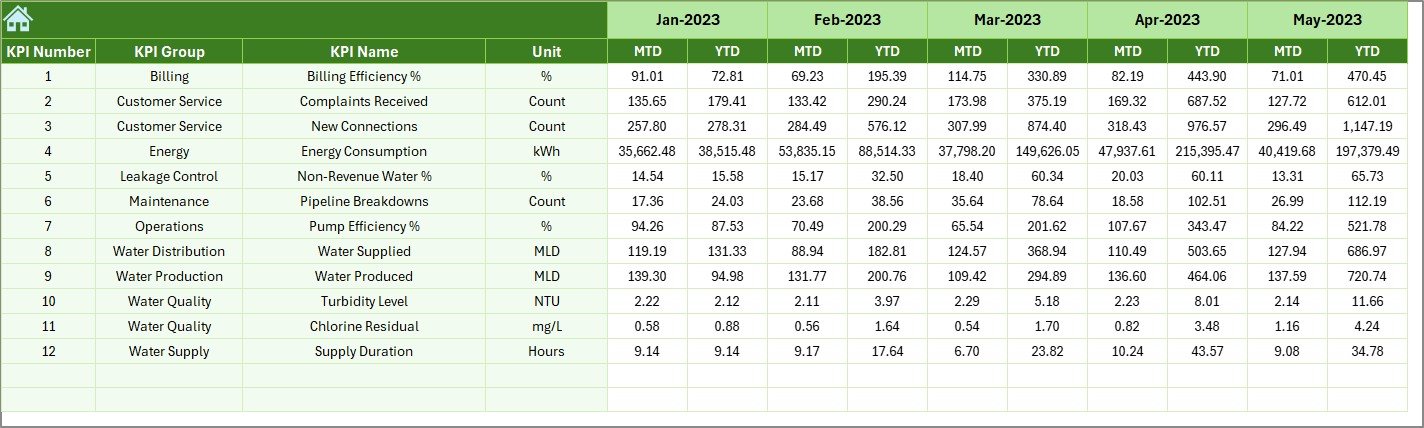
📚 Previous Year Numbers – Track Yearly Improvements
This sheet stores last year’s KPIs for:
MTD PY
YTD PY
This allows the dashboard to show CY vs PY comparisons instantly—key for analyzing long-term utility performance.
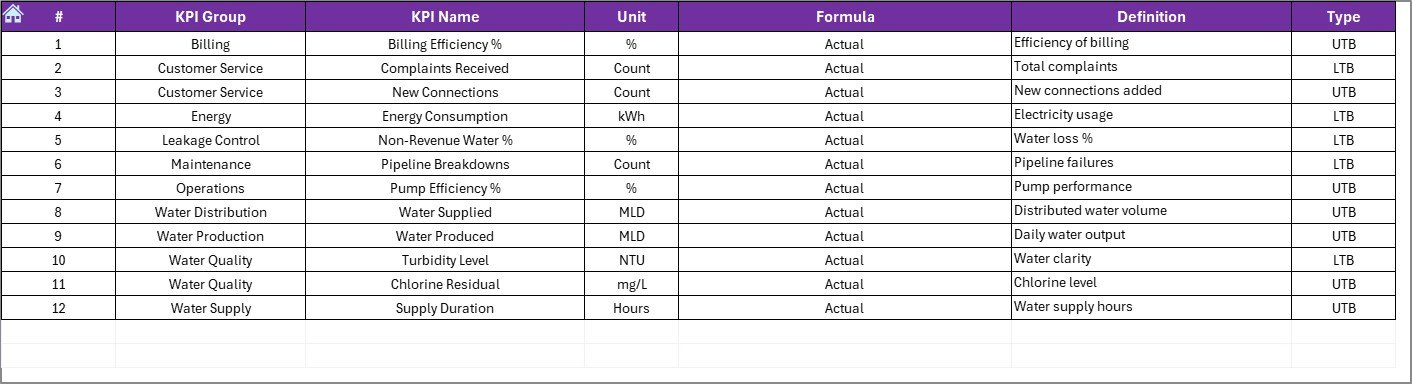
📘 KPI Definition Sheet – Crystal-Clear KPI Dictionary
Enter:
KPI Group
KPI Name
KPI Unit
KPI Type (LTB/UTB)
KPI Formula
KPI Definition
This ensures clarity, accuracy, and standardization across the organization.
🌟 Who Can Benefit from This Dashboard?
👷 Water Utility Engineers & Operators
Track production, distribution, treatment efficiency, and leakages.
🧪 Water Quality Teams
Monitor quality parameters and compliance KPIs.
💼 Finance & Revenue Teams
Analyze revenue collection efficiency, billing performance, and consumption patterns.
🏛️ Municipal Water Boards
Monitor supply issues, customer complaints, and system performance.
🛠️ Maintenance & Field Teams
Track downtime, repair efficiency, service requests, and preventive maintenance.
💡 Why This Dashboard is Essential for Water Utilities
📈 All KPIs in one place
🔍 Clear MTD, YTD & PY comparisons
🚨 Detect leakages, wastage & inefficiencies faster
🧮 Reduce manual reporting
🎯 Improve operational planning
🚀 Enhance customer satisfaction
💧 Strengthen supply reliability
🕒 Save hours every month with automation





















Reviews
There are no reviews yet.