

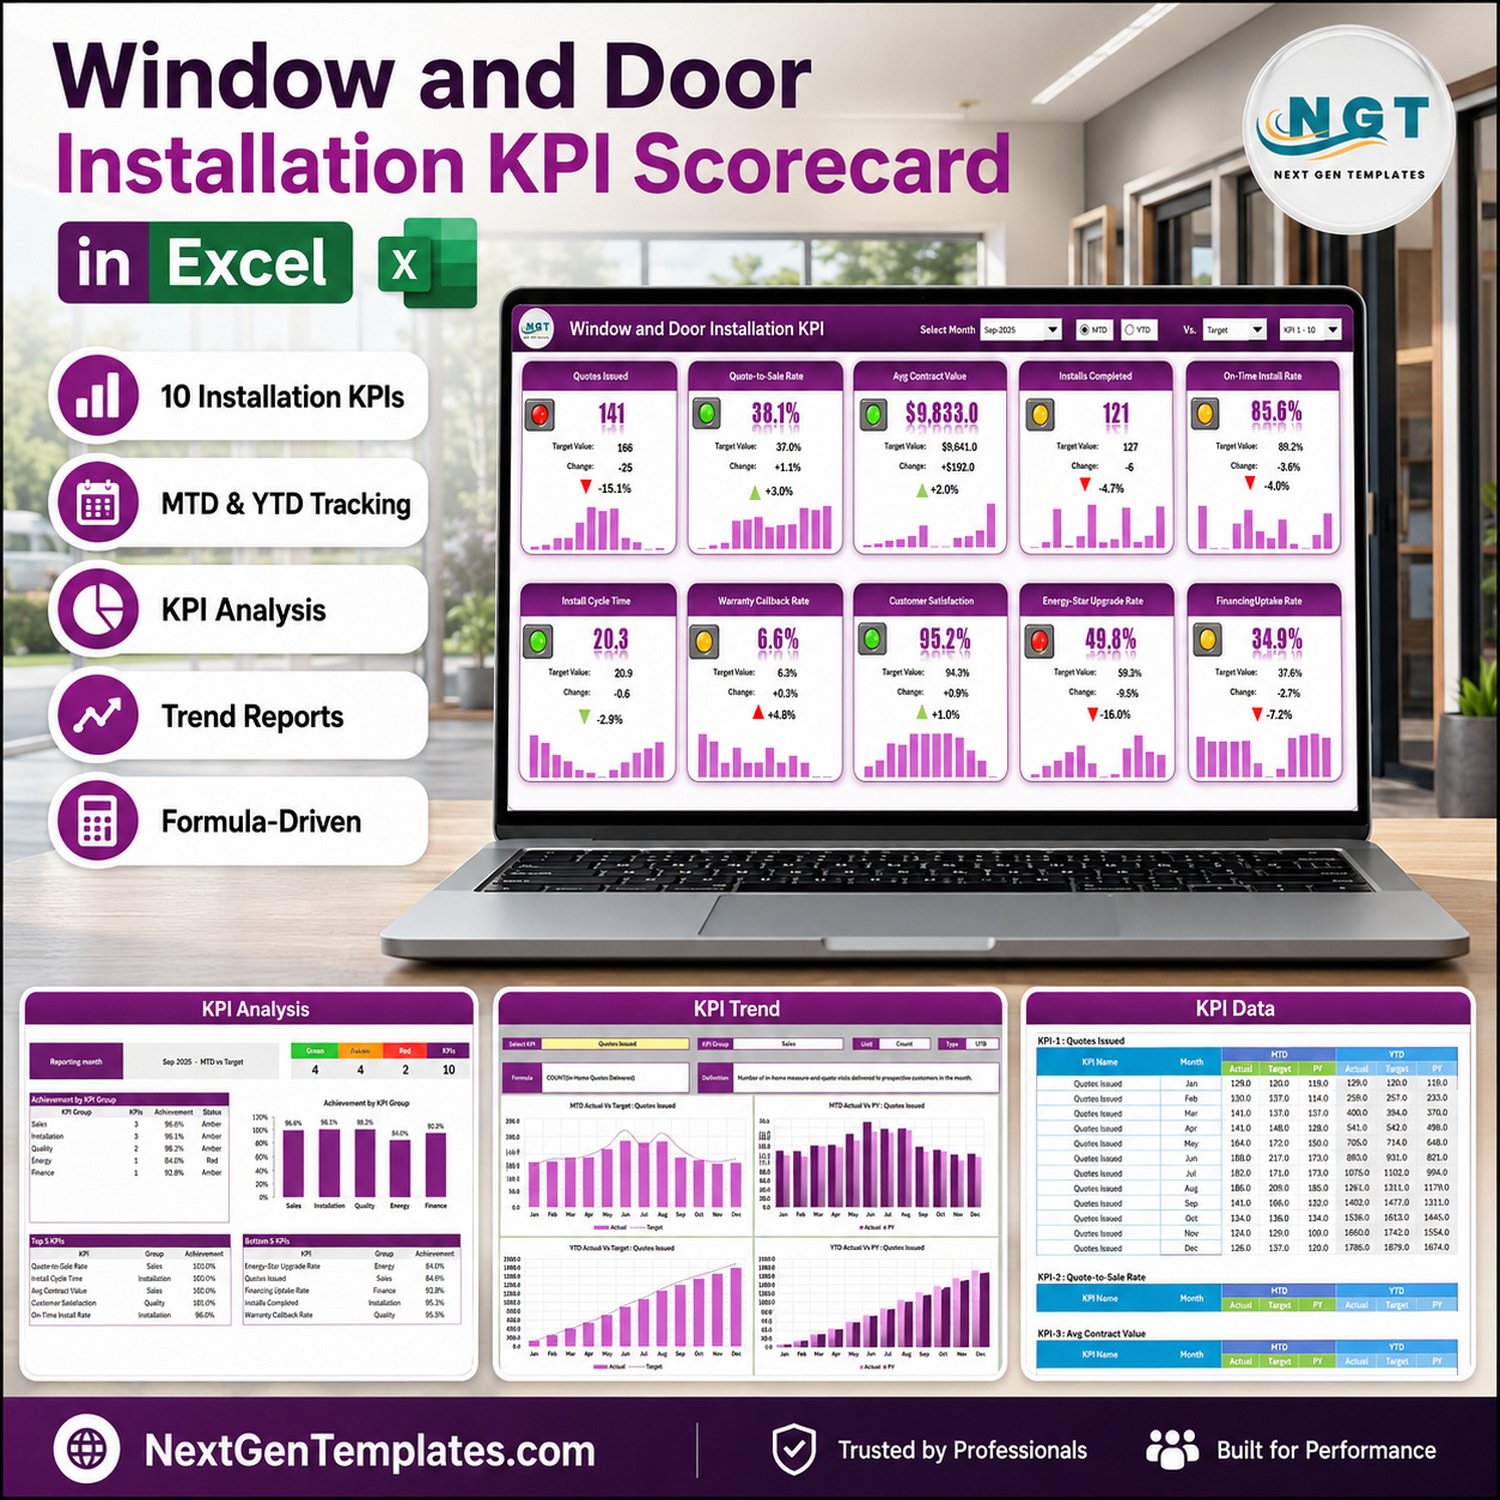


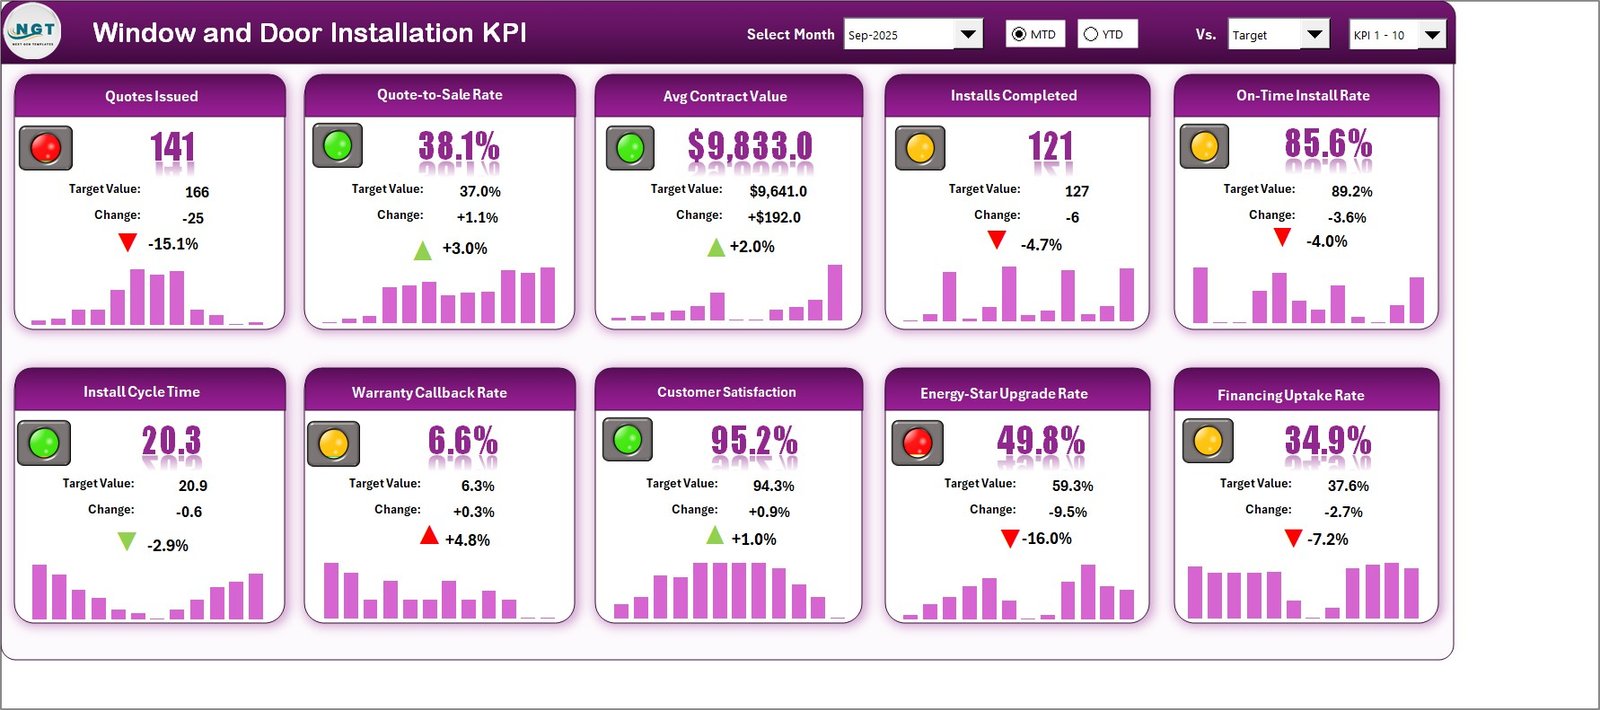
The Window and Door Installation KPI Scorecard in Excel is a one-page monthly report for a fenestration business – replacement windows, entry and patio doors, retrofit and new-construction installs. Ten installation KPIs sit on a single tile wall with a month picker, an MTD / YTD switch and traffic lights that already know which direction is good. It ships loaded with a full 2025 year of sample figures, so the file opens on a real month instead of an empty grid: September 2025 reads 4 Green, 4 Amber and 2 Red across five KPI groups.
Which product this is. NextGenTemplates ships three families whose names look almost identical, and this is exactly one of them. This is the Excel KPI Scorecard line – a month-picker tile wall for monthly reporting. It is not the slicer-driven Excel KPI Dashboard line, and it is not an analytical Excel Dashboard built over a transaction table. They answer different questions, and many contractors end up owning two of them.
Key Features of the Window and Door Installation KPI Scorecard in Excel
- Ten window and door KPIs on one page – quoting, installation delivery, quality, energy performance and finance, each on its own tile with value, target, change and traffic light.
- Month picker with an MTD / YTD switch – pick Sep-2025 from the header dropdown and every tile, both analysis pages and all four trend charts follow. The picker is index-driven, so it cannot fall out of step with the month labels on Input Data.
- Compare against Target, PY or Prior Month – a third header dropdown swaps the comparison basis for the whole page at once.
- Direction-aware traffic lights – eight Upper-the-Better KPIs and two Lower-the-Better (Install Cycle Time and Warranty Callback Rate). A falling cycle time scores green with a green down-arrow; a rising callback rate scores worse with a red up-arrow. No false greens.
- A 12-month sparkline on every tile – the shape of the year sits under each number, so a good month inside a bad trend is visible at a glance.
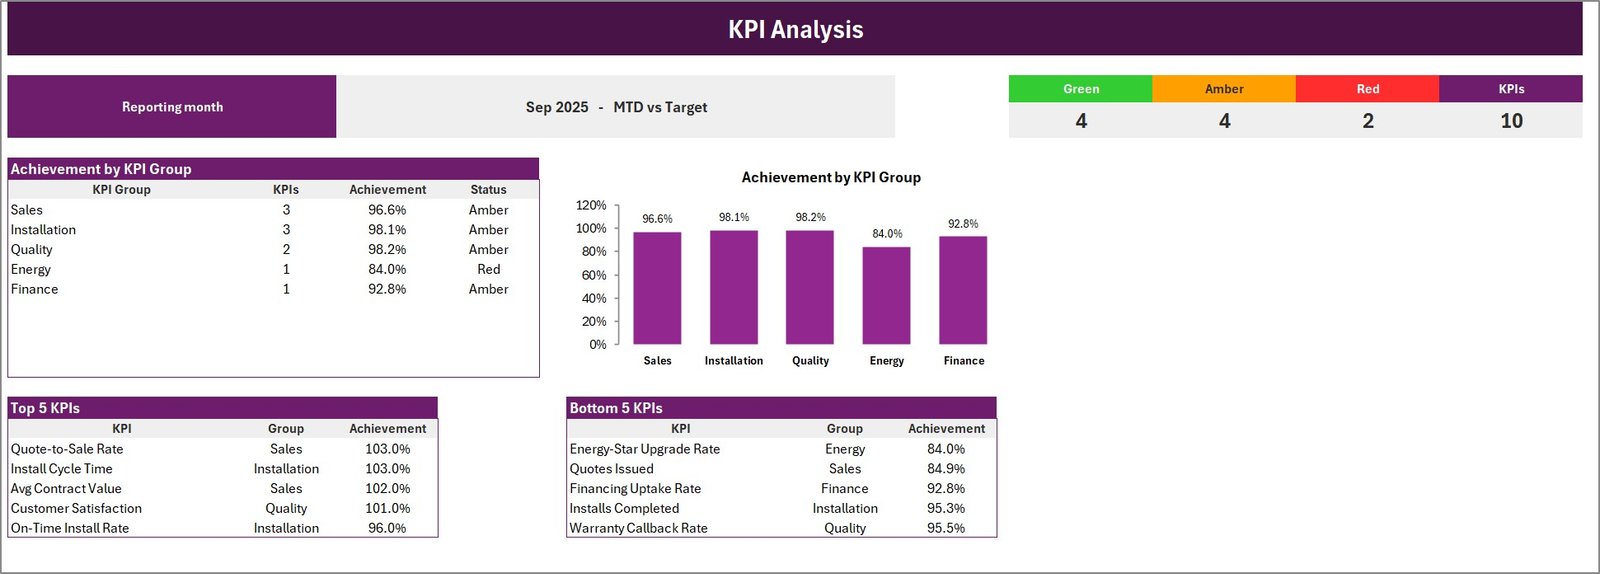
- KPI Analysis page – achievement by KPI group with a bar chart, RAG counts, and Top 5 / Bottom 5 tables ranked by achievement.
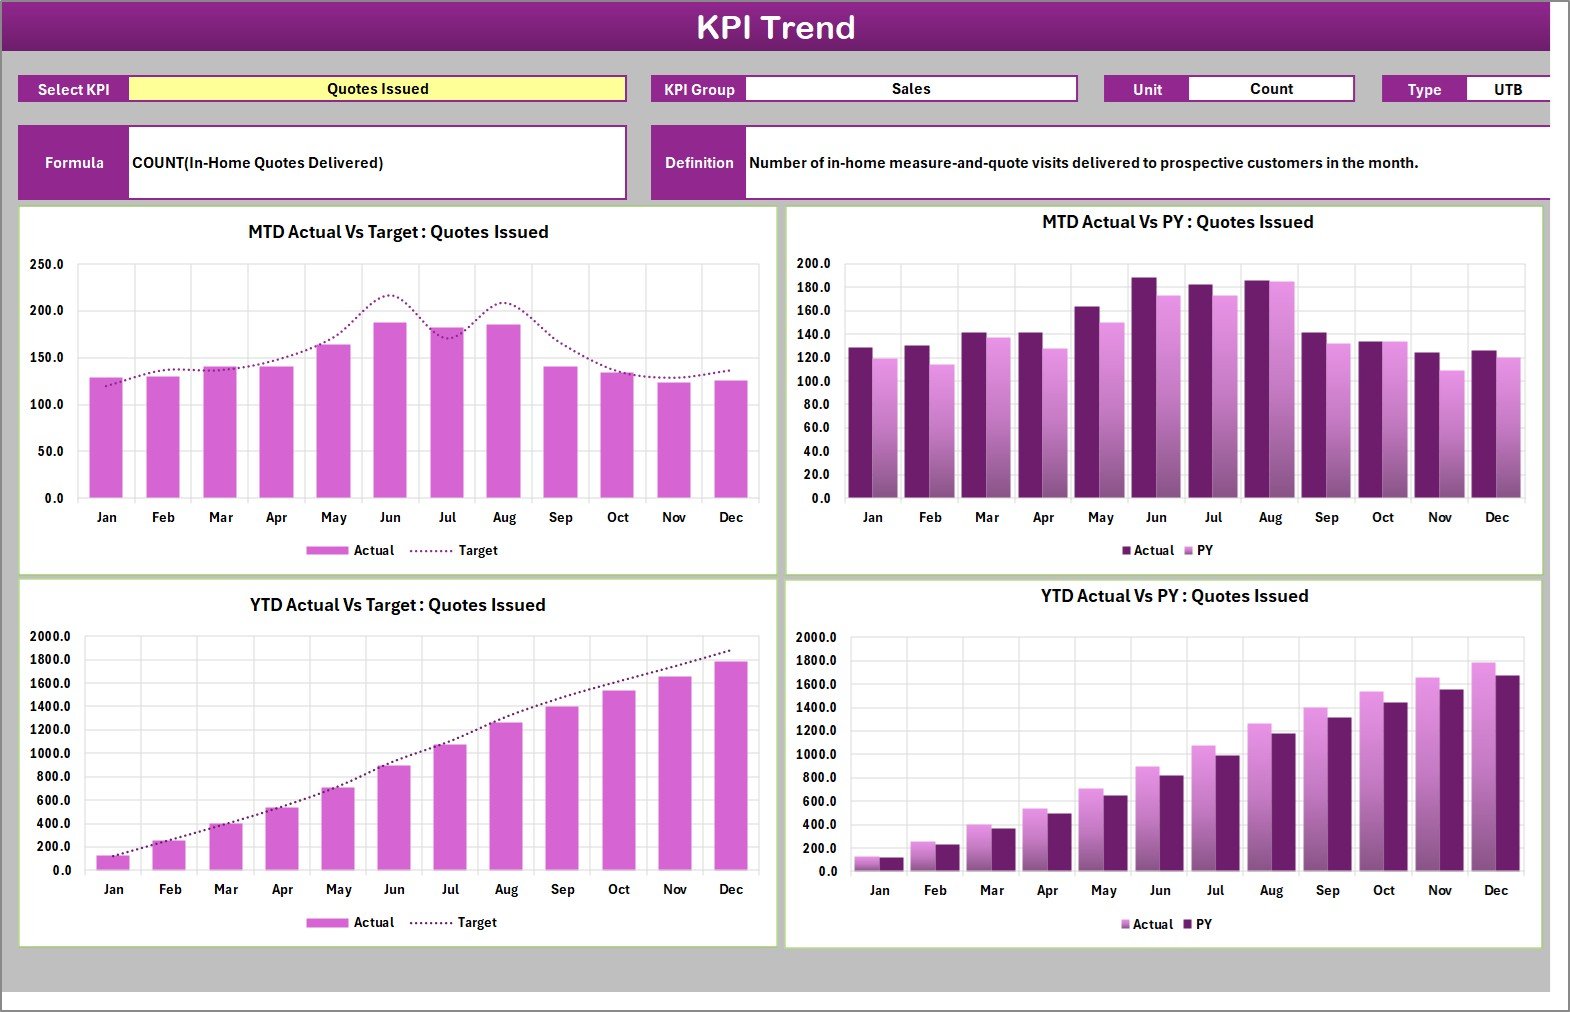
- KPI Trend page – pick one KPI and get four charts: MTD vs Target, MTD vs PY, YTD vs Target and YTD vs PY, with the KPI unit, formula, definition and direction printed above them.
- Rename every KPI – the workbook has room for 20 KPIs, ten already filled with window and door metrics; the Scorecard shows ten at a time and a header picker switches between KPI 1-10 and KPI 11-20.
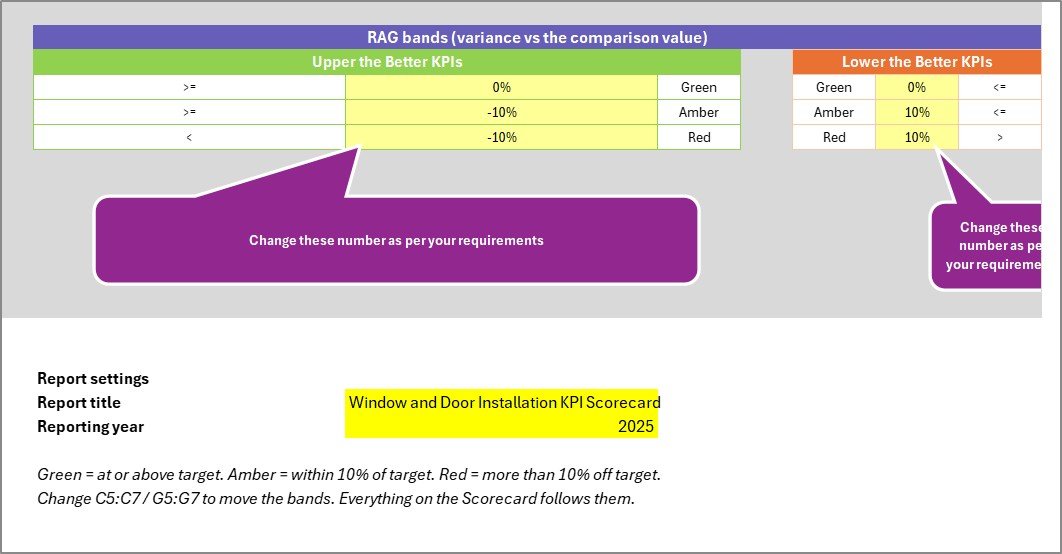
- Editable RAG bands – move the Amber and Red thresholds on one sheet and every page follows, separately for Upper-the-Better and Lower-the-Better metrics.
- 100% formulas, zero macros – no Power Query, no add-ins, nothing to enable. Opens on any Excel from 2016 onward.
- Instant download – the .xlsx plus the Excel KPI Scorecard user manual PDF in one ZIP.
The Ten Window and Door KPIs You Get Out of the Box
These are the ten that ship in the file, grouped exactly as the KPI Definition sheet groups them. The September 2025 figures below are the sample data, and they are what the screenshots show.
| # | KPI | Group | Unit | Direction | Sep-2025 actual vs target |
|---|---|---|---|---|---|
| 1 | Quotes Issued | Sales | Count | Upper the Better | 141 vs 166 – Red |
| 2 | Quote-to-Sale Rate | Sales | % | Upper the Better | 38.1% vs 37.0% – Green |
| 3 | Avg Contract Value | Sales | USD | Upper the Better | $9,833 vs $9,641 – Green |
| 4 | Installs Completed | Installation | Count | Upper the Better | 121 vs 127 – Amber |
| 5 | On-Time Install Rate | Installation | % | Upper the Better | 85.6% vs 89.2% – Amber |
| 6 | Install Cycle Time | Installation | Days | Lower the Better | 20.3 vs 20.9 – Green |
| 7 | Warranty Callback Rate | Quality | % | Lower the Better | 6.6% vs 6.3% – Amber |
| 8 | Customer Satisfaction | Quality | % | Upper the Better | 95.2% vs 94.3% – Green |
| 9 | Energy-Star Upgrade Rate | Energy | % | Upper the Better | 49.8% vs 59.3% – Red |
| 10 | Financing Uptake Rate | Finance | % | Upper the Better | 34.9% vs 37.6% – Amber |
Every one of those names, groups, units, formulas and direction flags lives on the KPI Definition sheet and is yours to edit. Rename Energy-Star Upgrade Rate to “Triple-Glazed Share” and every page repoints to the new name, because the whole workbook looks a KPI up by name rather than by position.
What Is Inside the Window and Door Installation KPI Scorecard in Excel
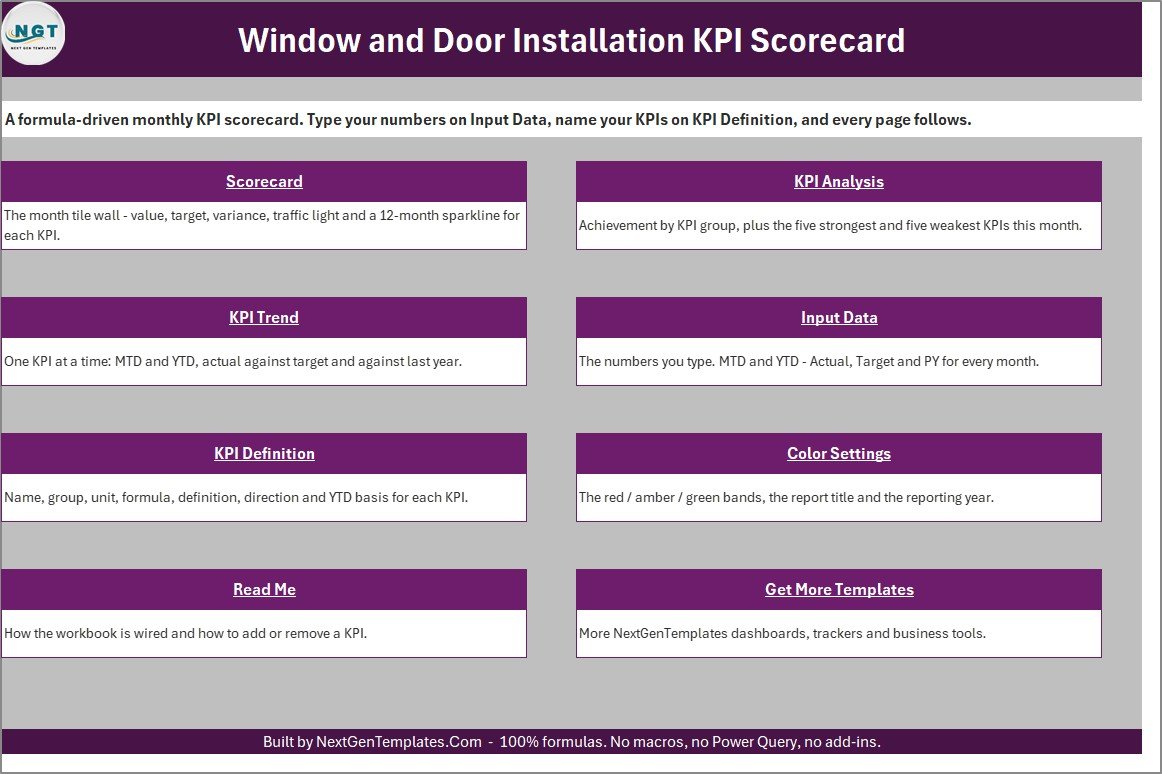
- Home – a navigation page with a labelled link to each of the other eight sheets.
- Scorecard – the ten-tile wall with the month, MTD/YTD, comparison and KPI-set pickers in the header band.
- KPI Analysis – Sep 2025, MTD vs Target, reads Green 4, Amber 4, Red 2 out of 10 KPIs. Achievement by group: Sales 96.6% (3 KPIs), Installation 98.1% (3), Quality 98.2% (2), Energy 84.0% (1), Finance 92.8% (1). Top 5 is led by Quote-to-Sale Rate and Install Cycle Time at 103.0%; Bottom 5 is led by Energy-Star Upgrade Rate at 84.0%.
- KPI Trend – one KPI at a time across four charts, with unit, type, formula and definition shown above them.
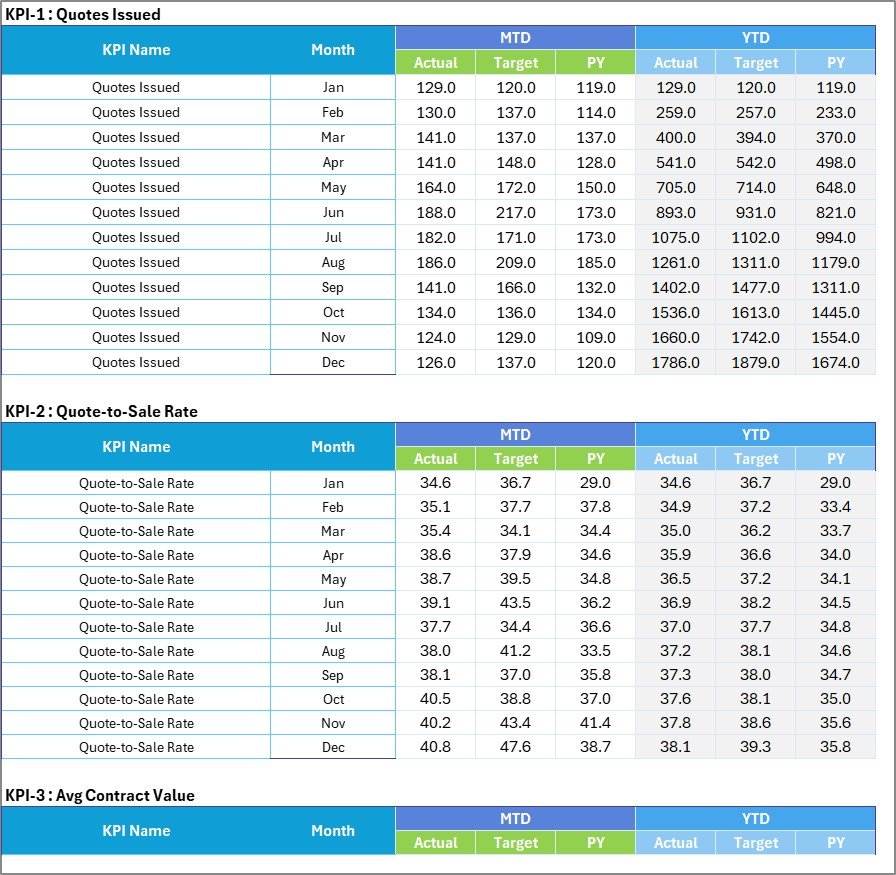
- Input Data – twenty numbered blocks, one per KPI slot, twelve months each, with MTD and YTD columns for Actual, Target and PY. This is the sheet you type on.
- KPI Definition – name, group, unit, formula, definition, direction and YTD basis for each KPI, plus a Check column that flags a duplicate KPI name.
- Color Settings – the RAG bands for both directions, the report title and the reporting year.
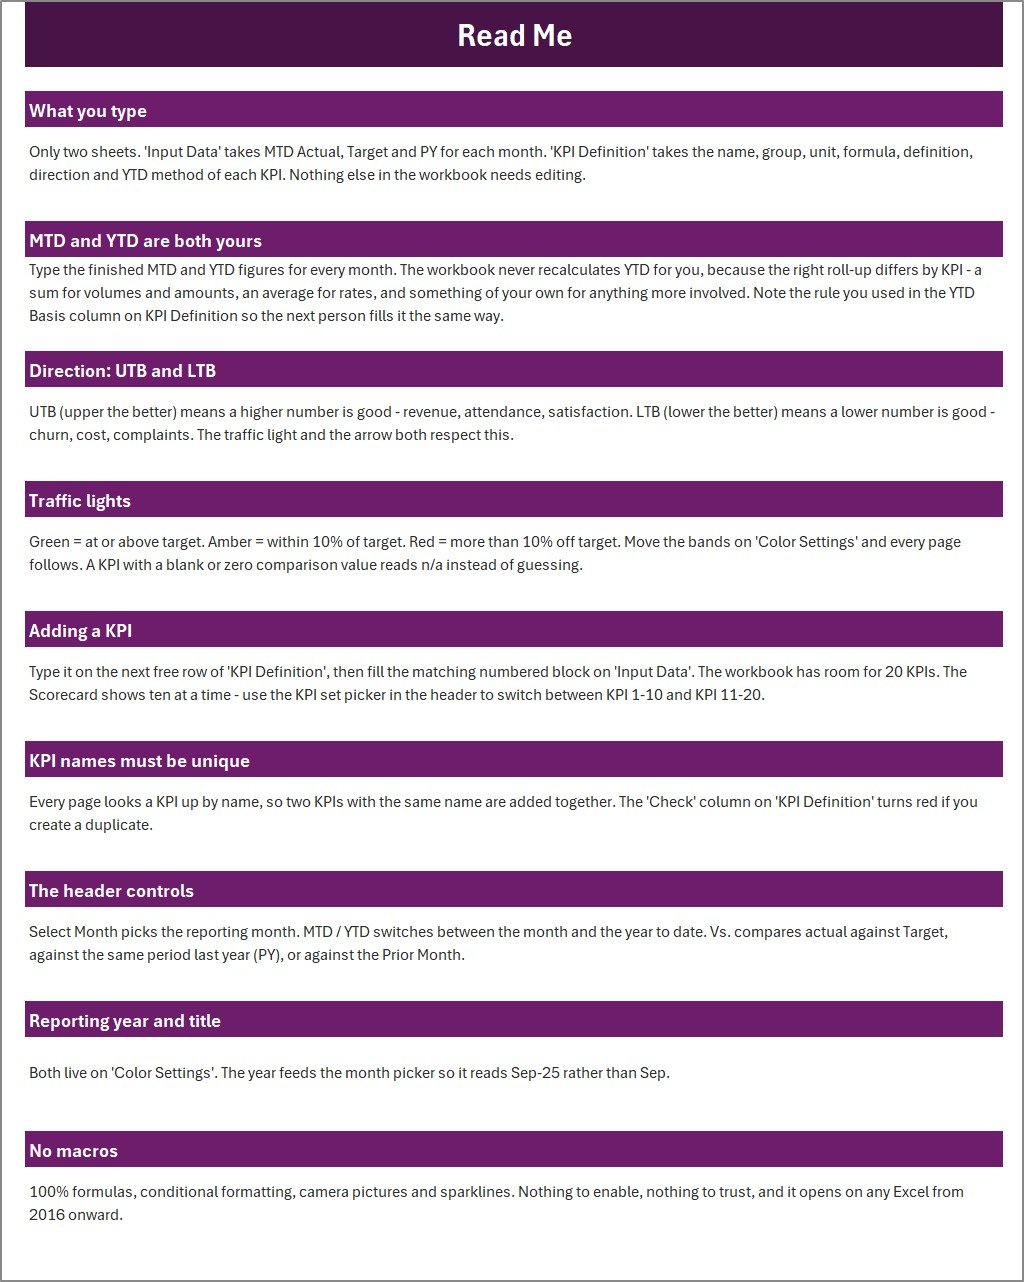
- Read Me – nine short sections on how the workbook is wired, including how to add a KPI and why KPI names must be unique.
- Get More Templates – the rest of the NextGenTemplates catalogue.
Excel Scorecard vs. Google Sheets vs. Paid Contractor SaaS – Where the Window and Door Installation KPI Scorecard in Excel Fits
| This Excel Scorecard | Google Sheets edition | Paid contractor SaaS | |
|---|---|---|---|
| Price | One-off 15.99 (9.99 on sale) | One-off, lower | 60-300+ per user per month |
| Works offline | Yes | No | No |
| Share by link | No – it is a file | Yes | Yes |
| Setup time | Minutes – type your numbers | Minutes | Weeks, plus onboarding fees |
| Reads your job data automatically | No – you type the monthly figures | No | Yes, if you live inside that system |
| Rename or replace every KPI | Yes, all 20 slots | Yes | Usually a paid customisation |
| Macros / add-ins required | None | None | N/A |
| You own the file forever | Yes | Yes | No – access ends with the subscription |
Who This Template Is For – and Who It Is Not For
It is for window and door replacement companies, fenestration installers, glazing and patio-door specialists, retrofit and weatherisation crews, dealer networks reporting up to a manufacturer, and the office manager or owner who has to produce one monthly performance page for a partner, a lender or a franchise head office.
It is not for anyone who wants a live feed from a CRM or field-service app. This is a reporting template. You – or whoever runs your month-end – type the finished monthly numbers on Input Data, and the workbook does the comparison, the ranking and the colour. It does not connect to Buildertrend, JobNimbus, improveit 360, Leap, Salesforce or QuickBooks, and it does not import anything.
How to Use the Window and Door Installation KPI Scorecard in Excel
- Unzip the download and open the .xlsx. There are no macros to enable.
- On Color Settings, set the report title and the reporting year. The year feeds the month picker.
- On KPI Definition, rename the ten KPIs to your own, or leave them as they are. Set each one group, unit, formula text, definition, direction (UTB or LTB) and YTD basis.
- On Input Data, type MTD Actual, Target and PY for each month, and the YTD figures alongside. YTD is yours to type – the workbook does not roll it up for you, because the right roll-up differs by KPI (a sum for volumes, an average for rates).
- Go to Scorecard, pick your month, and choose MTD or YTD and the comparison basis.
- Adjust the Amber and Red bands on Color Settings if 10% is not your tolerance.
- Read KPI Analysis for the group roll-up and the Top 5 / Bottom 5, and KPI Trend for the twelve-month picture of any single KPI.
Real-World Use Cases
- Monthly owner review. One page that answers “did we quote enough, did we close enough, did we install on time, and did it come back”.
- Dealer reporting to a manufacturer. Energy-Star Upgrade Rate and Avg Contract Value in the same view as install volume.
- Sales-manager coaching. Quote-to-Sale Rate against target, with the twelve-month sparkline showing whether a bad month is a blip.
- Installation scheduling review. On-Time Install Rate and Install Cycle Time side by side – the second explains the first.
- Warranty and rework control. Warranty Callback Rate as a Lower-the-Better KPI, so a rising number colours red rather than green.
- Finance partner reporting. Financing Uptake Rate tracked monthly against target for a lender relationship.
Honest Notes About This File
Everything below was checked in the shipped workbook rather than assumed.
- The header band on the Scorecard page prints the report title clipped to “Window and Door Installation KPI” – the word “Scorecard” does not fit the header cell width. The full title is stored correctly on Color Settings and is yours to shorten.
- Both callouts on the Color Settings page read “Change these number as per your requirements” rather than “numbers”, and the right-hand callout runs past the printable area in the page export.
- The Read Me says the month picker reads “Sep-25”; it actually renders the full “Sep-2025”.
- YTD is typed, not calculated. That is deliberate and the Read Me says so, but it is the one thing people expect the file to do for them.
Frequently Asked Questions
Does this connect to Buildertrend, JobNimbus, Leap or QuickBooks?
No. It is a reporting template. You type your finished monthly figures on Input Data and the workbook does the comparison, ranking and colouring. There is no import, no sync and no API.
Are macros required?
No. It is 100% formulas, conditional formatting, camera pictures and sparklines. It is an .xlsx, not an .xlsm, so there is nothing to enable and no security prompt.
Can I change the KPI names to my own?
Yes – all of them. Type your own on KPI Definition and fill the matching numbered block on Input Data. Every page looks a KPI up by name, and a Check column warns you if you create a duplicate.
Does it handle Lower-the-Better metrics properly?
Yes. Install Cycle Time and Warranty Callback Rate ship as LTB. In the sample month the cycle time falls from 20.9 to 20.3 and scores green with a green down-arrow, while the callback rate rises from 6.3% to 6.6% and scores amber with a red up-arrow. Set any KPI to UTB or LTB from a dropdown.
Does it calculate year-to-date for me?
No, and that is on purpose. You type the YTD figures alongside MTD, because the correct roll-up differs by KPI – a sum for Quotes Issued and Installs Completed, an average for rates like On-Time Install Rate. Note the rule you used in the YTD Basis column so the next person fills it the same way.
How many KPIs can it hold?
Twenty. Ten are filled with window and door metrics; Input Data runs to row 319 with twenty numbered blocks. The Scorecard shows ten at a time and a header picker switches between KPI 1-10 and KPI 11-20.
Which Excel versions does it work on?
Excel 2016 and later on Windows, and Microsoft 365. It uses camera pictures and sparklines, so it is a desktop-Excel file rather than an Excel-for-web one.
Is this the same as your Excel KPI Dashboard?
No. This is the KPI Scorecard line – a month-picker tile wall built for monthly reporting. The Excel KPI Dashboard line is a different, slicer-driven product at a higher price, and the analytical Excel Dashboard line is a third thing again, built over a transaction table. Similar names, different products.
Does it prove compliance with an energy-rebate or building-code program?
No. Energy-Star Upgrade Rate is one of the ten KPIs and it is a percentage you calculate and type. The workbook holds no homeowner records, no permit or inspection data and no product certification, files nothing with any program, and satisfies no code, warranty-registration or rebate requirement.
Is there a Google Sheets version?
Yes – the Window and Door Installation KPI Scorecard in Google Sheets is on sale now. It is the browser-based edition of the same scorecard, shareable by link. The two editions are built by different production lines and do not necessarily carry an identical KPI list, so check the Google Sheets listing KPI table if the exact ten matter to you.
About the Author
Built by PK – Microsoft Certified Professional with 15+ years of Excel, Google Sheets, and Power BI experience. Founder of NextGenTemplates, reaching 300K+ subscribers across YouTube channels. Every template is hand-built and tested before release.
Explore Related Templates
Same scorecard, other trades: Septic Tank Service KPI Scorecard in Excel, Fencing Contractor KPI Scorecard in Excel, Paving Contractor KPI Scorecard in Excel, Insulation Contractor KPI Scorecard in Excel, Concrete Contractor KPI Scorecard in Excel, Drywall Contractor KPI Scorecard in Excel, Carpentry Workshop KPI Scorecard in Excel and Roofing Contractor KPI Scorecard in Excel. Step up to the interactive line with the Excel KPI Dashboard family, or browse every KPI Dashboard template and the full MS Excel catalogue.
Prefer Google Sheets? The Window and Door Installation KPI Scorecard in Google Sheets is the browser-based edition of this scorecard and is already on sale. A Garage Door Service KPI Scorecard in Excel is being prepared alongside this one and is not on sale yet.
Buy once, own it forever. Instant download, the user manual PDF included in the ZIP, and free bug fixes for this file. Questions before you buy? Email [email protected]. Window and Door Installation KPI Scorecard in Excel.
Last updated: 6 September 2026.
Watch the demo video:
Compatibility and Requirements
- Works in Microsoft Excel desktop (Excel 2016 or later, or Microsoft 365).
- The Scorecard sheet uses conditional formatting for the green, amber and red traffic lights. Microsoft explains the feature in Use conditional formatting to highlight information in Excel.


































Reviews
There are no reviews yet.