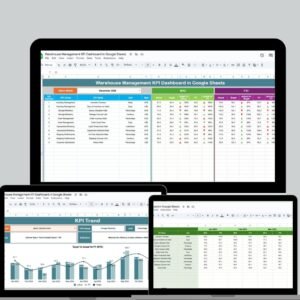
Managing warehouse operations efficiently is crucial for businesses, and this Warehouse Management KPI Dashboard in Google Sheets is designed to simplify the process. It tracks key performance metrics in real-time, enabling seamless decision-making and data-driven improvements. Here’s a breakdown of the powerful features:
-
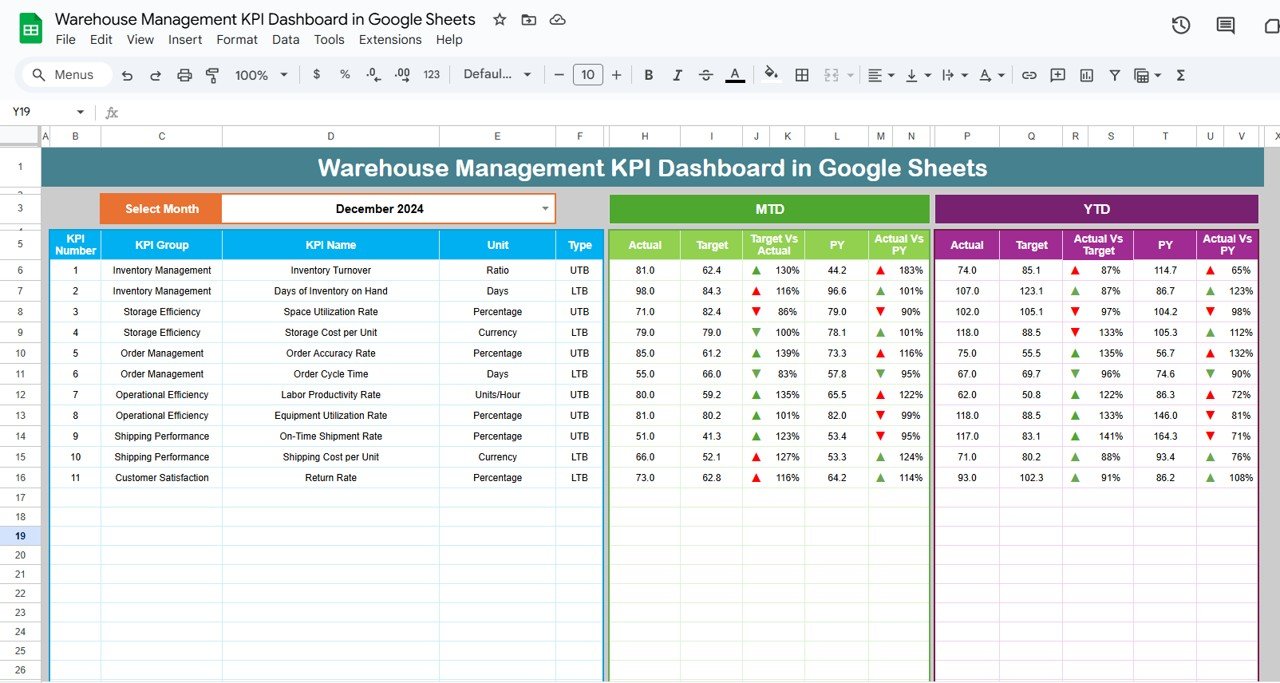
Dynamic Month Selection: Easily switch between months using the dropdown in cell D3 to view updated performance data instantly.
-
Real-Time Data Updates: Google Sheets ensures all data is automatically updated, allowing your team to stay informed at all times.
-
Comprehensive KPI Tracking: Track a wide range of KPIs such as inventory turnover, order picking accuracy, and labor productivity across multiple time periods (MTD and YTD).
-
Previous Year Comparison: Analyze your progress by comparing data with previous year’s performance.
-
Conditional Formatting: Instantly visualize performance with color-coded up and down arrows, making it easier to spot areas needing attention.
What’s Inside the Warehouse Management KPI Dashboard 📊
The template consists of six comprehensive worksheets that are key to managing warehouse performance effectively:
-
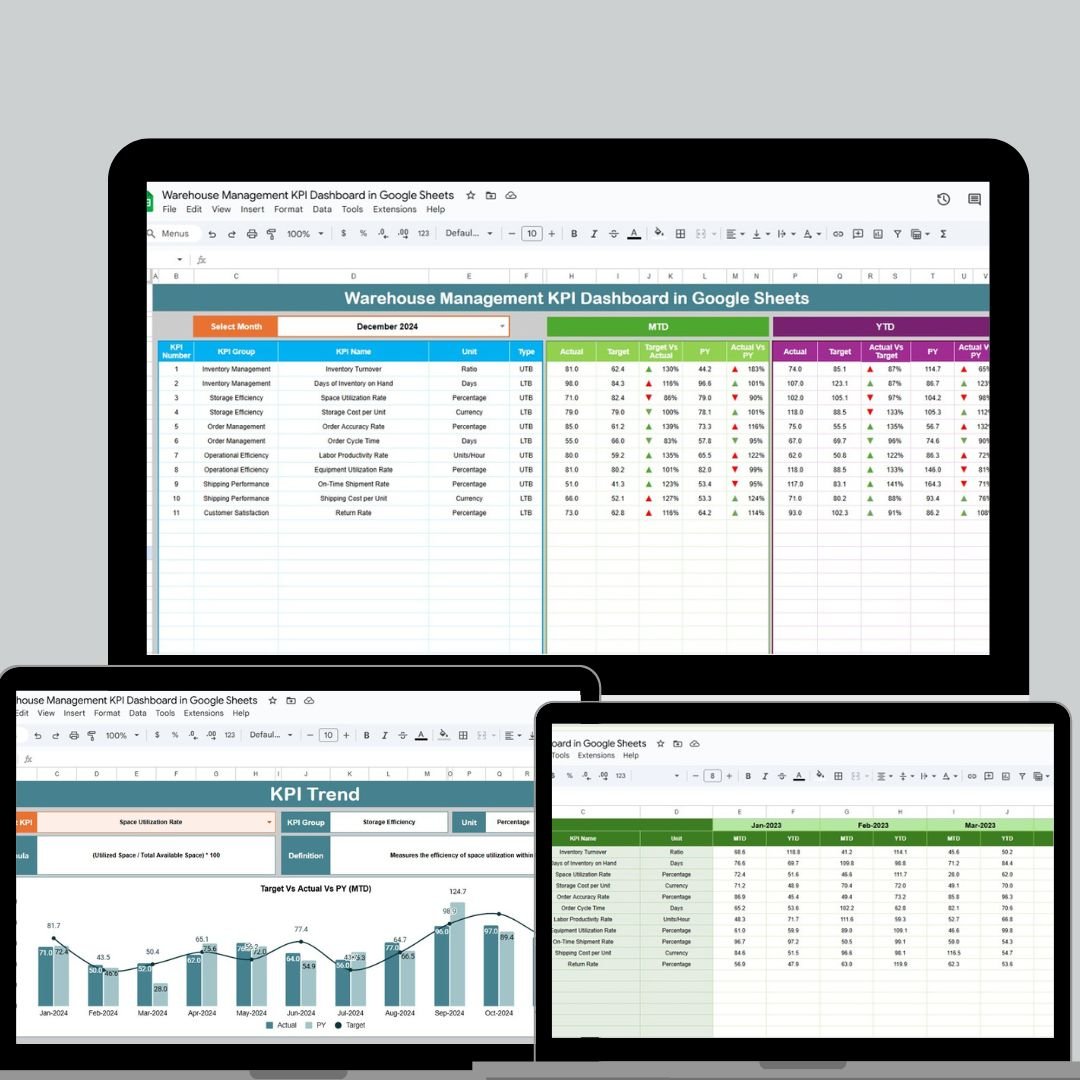
Dashboard Sheet Tab: The core of the dashboard, where all your KPIs are displayed, providing quick insights into your warehouse’s performance.
-
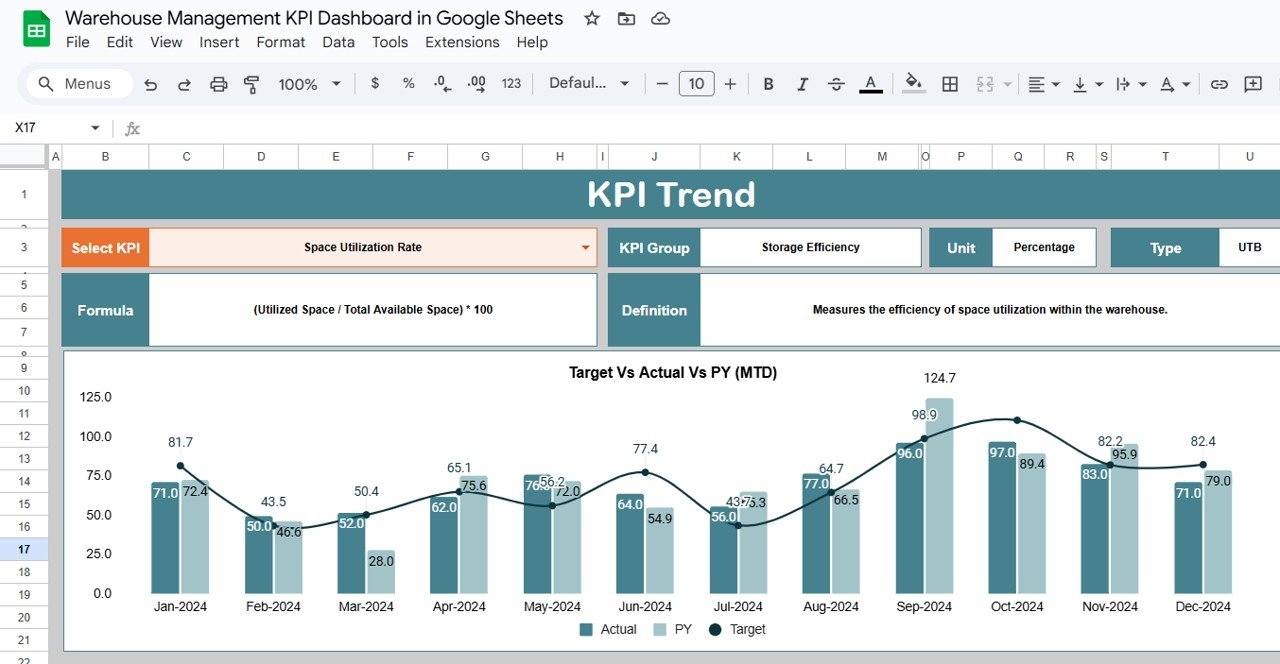
KPI Trend Sheet Tab: Track the historical performance of each KPI with time-based trends.
-
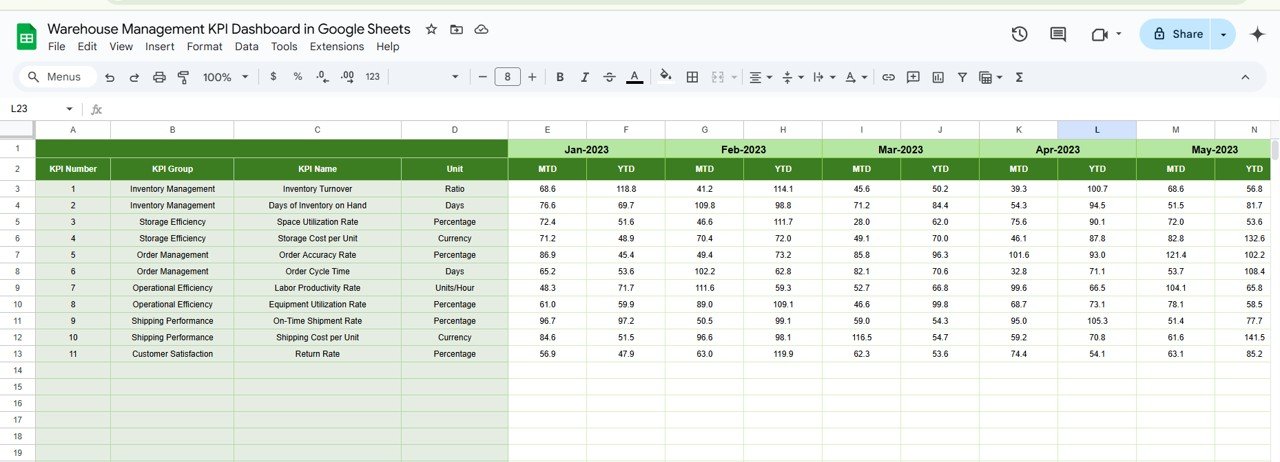
Actual Number Sheet Tab: A place to input your actual data for both MTD and YTD, ensuring up-to-date performance tracking.
-
Target Sheet Tab: Set and compare performance targets for each KPI, providing clear benchmarks for your operations.
-
Previous Year Number Sheet Tab: Maintain historical data to track long-term performance trends and growth.
-
KPI Definition Sheet Tab: Detailed definitions of each KPI, including the formula used for calculations and a clear explanation of what each metric measures.
How to Use the Warehouse Management KPI Dashboard 🛠️
Using the Warehouse Management KPI Dashboard is simple and intuitive. Here’s how you can make the most of it:
-
Set Up the Dashboard: After downloading the template, input your specific warehouse data into the corresponding sheets (Actual Numbers, Target Data, etc.).
-
Select a Month: Use the dropdown in cell D3 to select the desired month. The entire dashboard will update accordingly, showing the relevant data.
-
Enter Data: Regularly update your MTD and YTD values in the Actual Number Sheet Tab and Target Sheet Tab to keep the dashboard current.
-
Review Performance: Use the visual arrows and KPI comparisons to quickly assess whether your warehouse is meeting targets.
-
Analyze Trends: Use the KPI Trend Sheet Tab to monitor the historical changes in key metrics, identifying areas of improvement or regression.
Who Can Benefit from This Warehouse Management KPI Dashboard? 🏢
This KPI Dashboard is ideal for:
-
Warehouse Managers: Track and optimize daily operations with real-time data.
-
Logistics Teams: Monitor KPIs related to order fulfillment, inventory accuracy, and cost management.
-
Operations Analysts: Use the dashboard for deep data analysis, improving productivity, and reducing operational costs.
-
Supply Chain Managers: Assess the performance of your warehouse operations as part of the broader supply chain management process.
-
Business Owners: Make informed decisions based on key metrics and ensure that the warehouse is running at peak efficiency.
This dashboard is essential for anyone looking to improve warehouse management, from small businesses to large-scale operations.
Click here to read the Detailed blog post 📚
Visit our YouTube channel to learn step-by-step video tutorials
Youtube.com/@NeotechNavigators


















Reviews
There are no reviews yet.