


🚀 Streamline your Product Development KPI Dashboard in Google Sheets with real-time insights, powerful visualizations, and KPI tracking—all in one Google Sheets dashboard.
Whether you’re managing product timelines, quality assurance, or customer satisfaction, this dashboard helps you make data-driven decisions that fuel innovation and success.
Designed for agile product teams, R&D managers, and startups, the Product Development KPI Dashboard brings structure, visibility, and speed to your entire product development lifecycle.
✨ Key Features of Product Development KPI Dashboard
✅ All-in-One Dashboard View
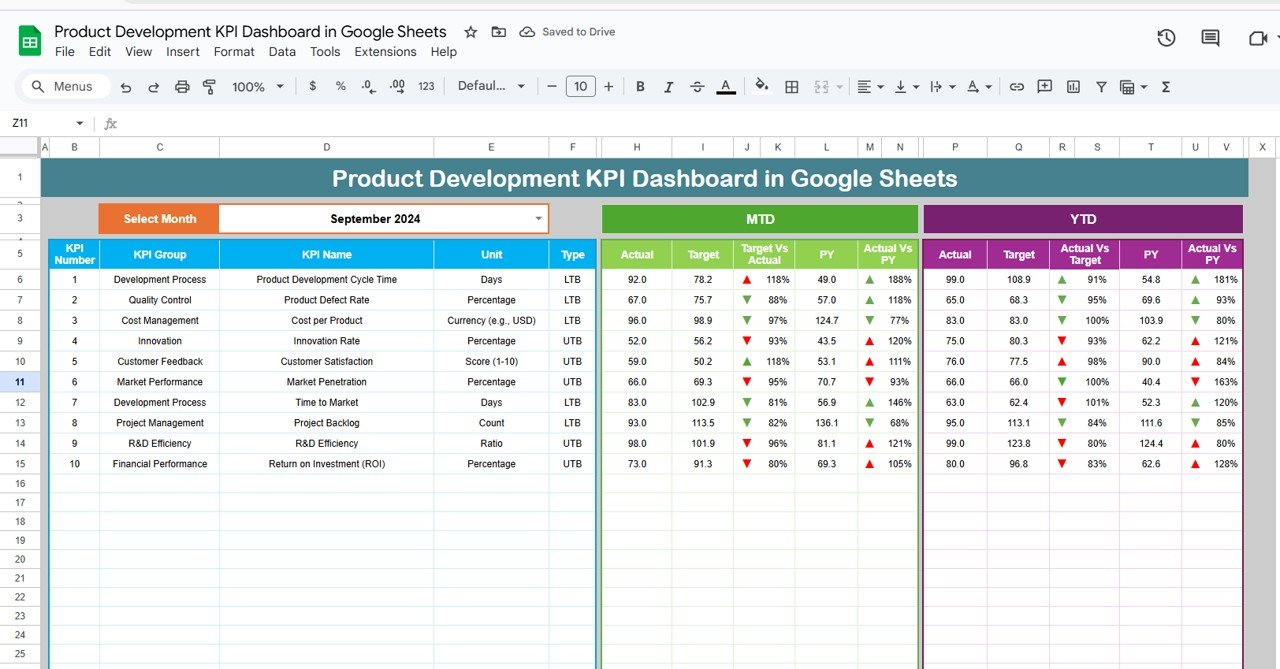
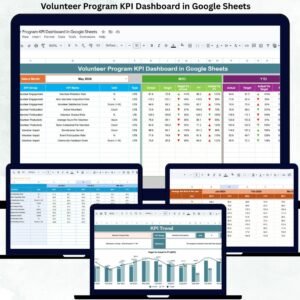
Stay on top of performance with a central dashboard showing:
-
Month Selection Dropdown to view MTD and YTD data
-
KPI Cards: Track Actual vs Target vs Previous Year metrics
-
Conditional Formatting: Visual arrows indicate trends at a glance
No guesswork—just clear progress updates. 📈
📂 What’s Inside the Product Development Dashboard?
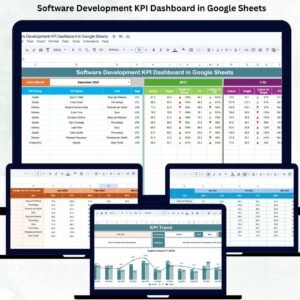
1️⃣ Dashboard Sheet Tab
Your KPI command center: View metrics across time periods and compare against benchmarks using built-in dropdowns and smart charts.
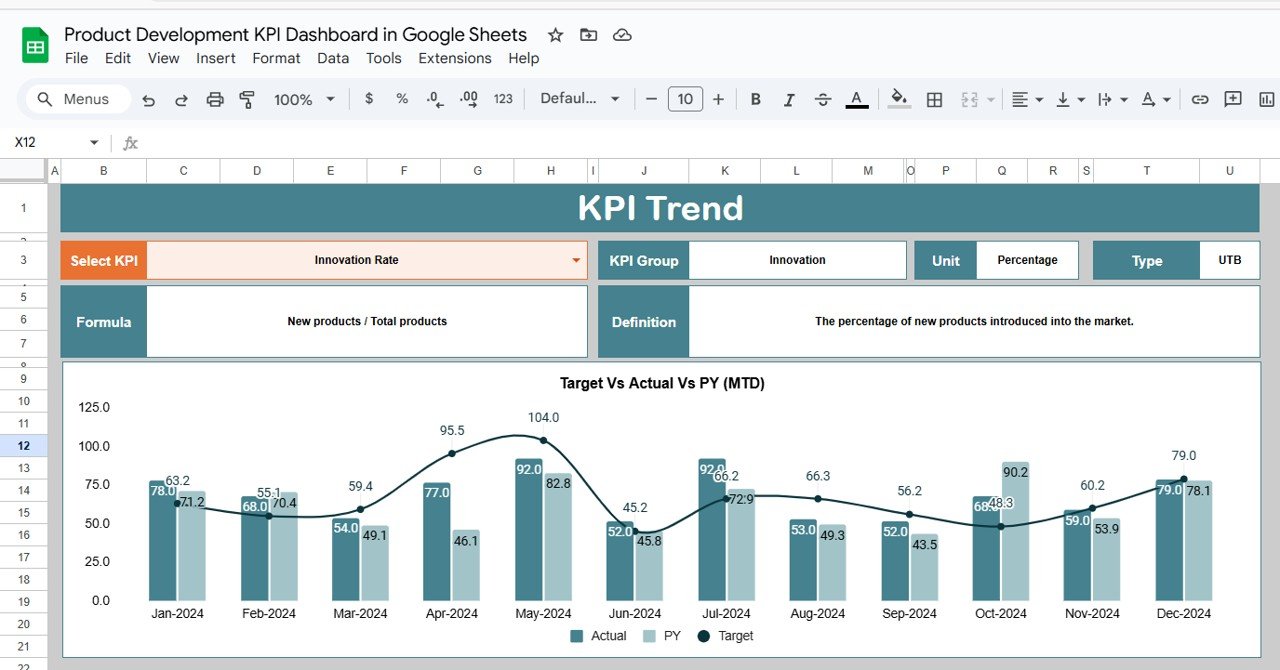
2️⃣ KPI Trend Sheet Tab
Track individual KPI performance over time. Select any metric from a dropdown and see detailed trends, formulas, and definitions.
3️⃣ Actual Numbers Sheet
Input real-time data for MTD (Month-To-Date) and YTD (Year-To-Date) KPIs to keep your dashboard updated.
4️⃣ Target Sheet
Define your monthly and YTD targets for each KPI. These numbers feed into the dashboard for instant comparison.
5️⃣ Previous Year Numbers
Log last year’s figures to analyze progress and spot performance trends.
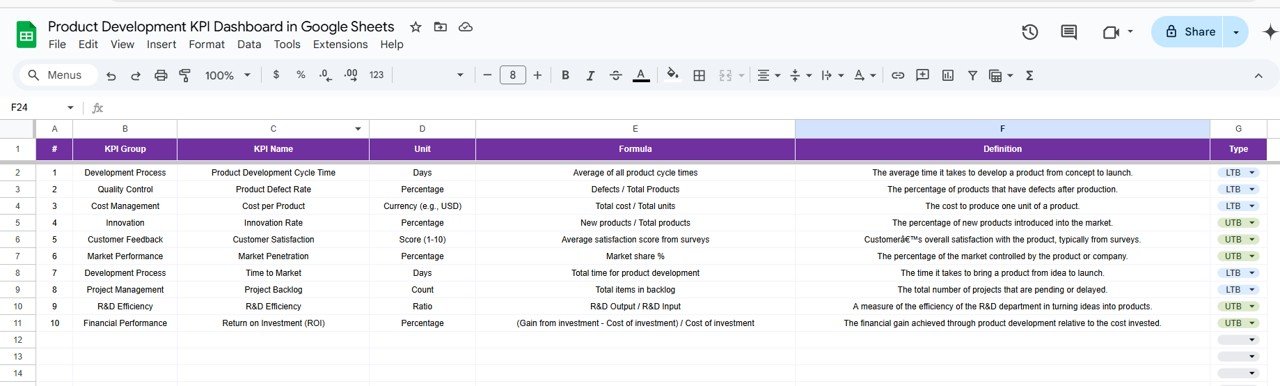
6️⃣ KPI Definition Sheet
Clarify your KPIs: View KPI names, units, type (LTB/UTB), and the formulas used to calculate them.
🛠️ How to Use the Product Development KPI Dashboard
-
Open the Google Sheet template and make a copy to your Drive
-
Enter Actual Data in the “Actual Numbers” sheet
-
Update Targets in the “Target Sheet”
-
View Results on the Dashboard and KPI Trend pages
-
Compare Historical Performance using the Previous Year tab
-
Customize KPIs as needed from the Definition tab
You don’t need coding or formulas—the template does the math and visuals for you. ✅
🎯 Who Can Benefit from This Dashboard?
-
💡 Product Managers: Track launches, lead times, and innovation goals
-
🧪 R&D Teams: Monitor progress, feedback, and development cost
-
🧑💻 Startups & Tech Teams: Stay agile with fast data feedback
-
📊 Executives & Stakeholders: Get big-picture KPI summaries
-
📦 Manufacturing/Product-Based Businesses: Ensure timely, high-quality delivery
🔍 Why Use This Google Sheets Dashboard?
✨ Comprehensive KPI Coverage
Includes metrics like Time to Market, Development Cost per Product, and Customer Satisfaction.
✨ 100% Customizable
Add new KPIs, adjust layout, or connect to other tools—no technical help needed.
✨ Live Data, Real Insights
Track actuals and targets in real time, with arrows showing progress or decline.
✨ Accessible Anywhere
Built in Google Sheets—access from any device, collaborate with your team live.
💡 Best Practices
-
✅ Update data monthly or weekly for best results
-
✅ Align KPIs with your business strategy
-
✅ Share the dashboard across departments
-
✅ Use conditional formatting to highlight underperformance
-
✅ Set stretch goals—but keep them realistic and measurable
📎 Click here to read the detailed blog post
Watch the step-by-step video Demo:


Reviews
There are no reviews yet.