

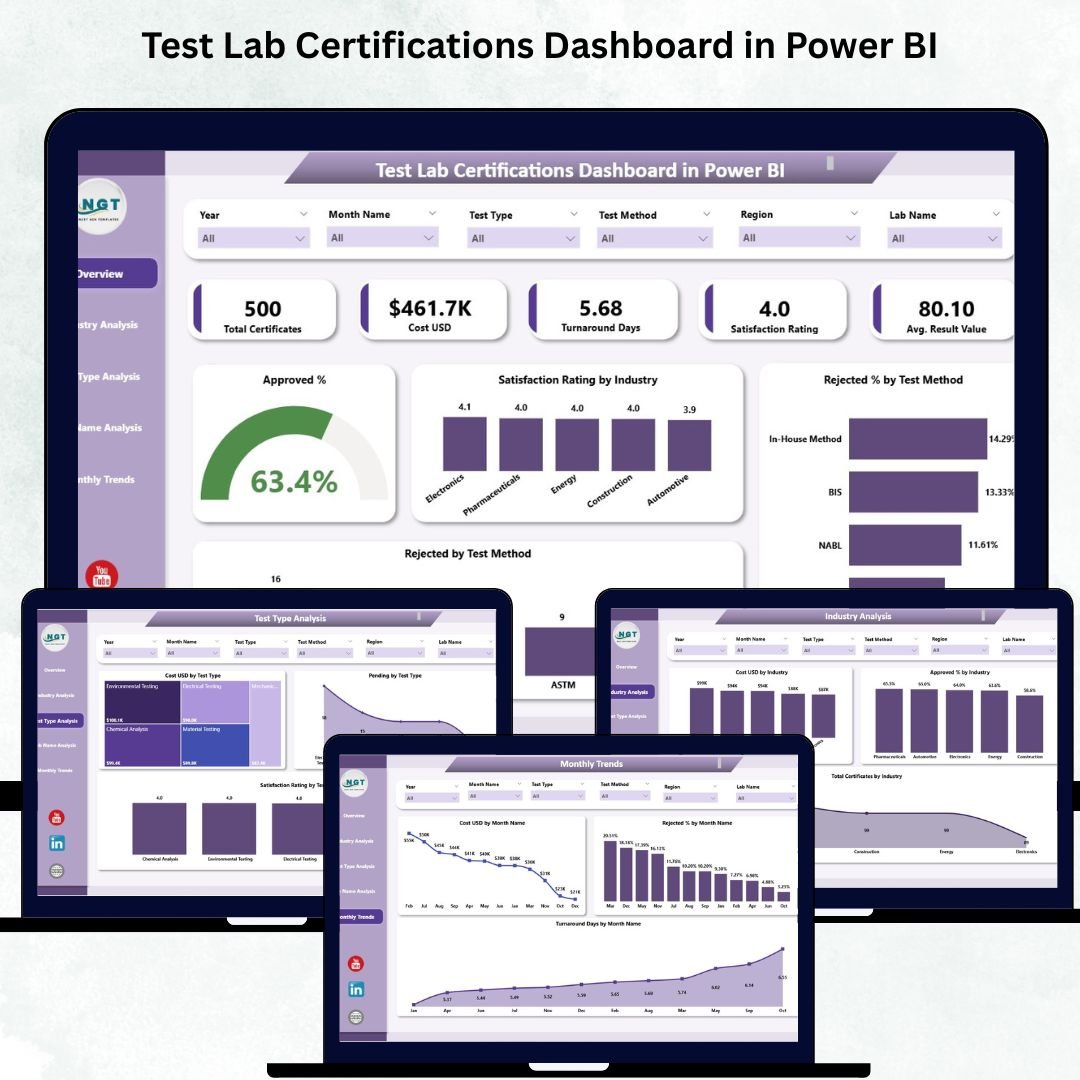



In today’s competitive environment, organizations rely heavily on test laboratories to certify materials, products, equipment, and processes. These certifications ensure reliability, safety, and compliance with global standards. However, when certification data is scattered across spreadsheets, teams struggle to monitor approval rates, test costs, rejection reasons, turnaround time, and satisfaction scores. This leads to slow decisions, repeated test failures, and operational inefficiencies.
The Test Lab Certifications Dashboard in Power BI solves all these challenges with a clean, interactive, and real-time reporting system. It brings all your test certification metrics into one powerful dashboard, enabling teams to understand trends instantly, monitor KPIs visually, and take corrective action early. Whether you manage multiple labs, test types, industries, or client requests, this dashboard becomes your centralized command center for certification performance.
⭐ Key Features of the Test Lab Certifications Dashboard in Power BI
✨ Centralized KPI Monitoring – Track approval %, costs, turnaround days & satisfaction
📊 Interactive Visuals & Slicers – Filter insights by industry, lab, test type & month
📈 Industry, Method & Lab Analysis – Compare performance across categories
🎯 Rejection & Approval Insights – Identify issues and root causes instantly
⚡ Excel-Driven Data Refresh – Update your file and refresh Power BI in seconds
📉 Monthly Trends Page – Study long-term trends for continuous improvement
📘 Beginner-Friendly Interface – No coding or advanced skills required
This dashboard eliminates manual reporting, speeds up decision-making, and improves transparency across your certification process.
📦 What’s Inside the Test Lab Certifications Dashboard in Power BI
The dashboard includes five dynamic pages, each designed to give you a complete picture of your certification operations.
🔹 1. Overview Page – Your High-Level Summary
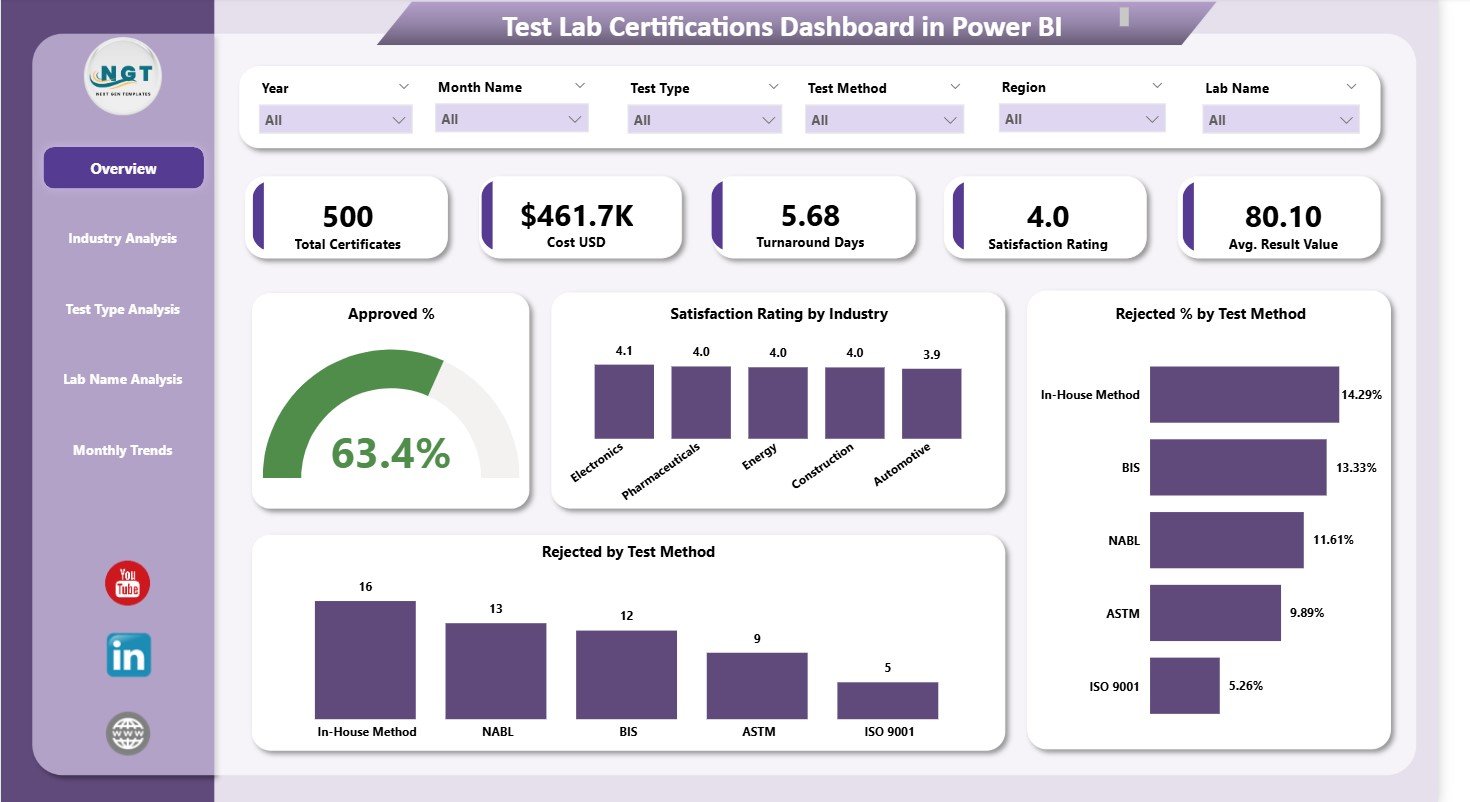
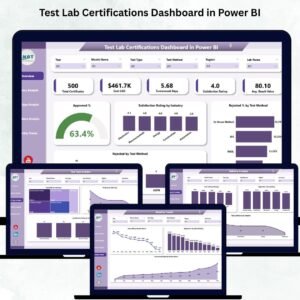
This is the main dashboard page where you get an instant snapshot of your certification workflow.
You will find:
🎛️ Smart Slicers
Filter by month, industry, lab, test type, or method.
📌 Six Essential KPI Cards
Total Certificates
Approved Certificates
Rejected Certificates
Approval Percentage
Satisfaction Rating
Average Turnaround Days
These cards help you assess performance within seconds.
📊 Four Powerful Charts
Approved % Chart – Shows how many tests pass successfully.
Satisfaction Rating by Industry – Understand client perception across sectors.
Rejected % by Test Method – Detect methods causing repeated failures.
Rejected by Test Method – Identify which test categories require corrective action.
The Overview Page consolidates your entire certification cycle into a single, interactive visual report.
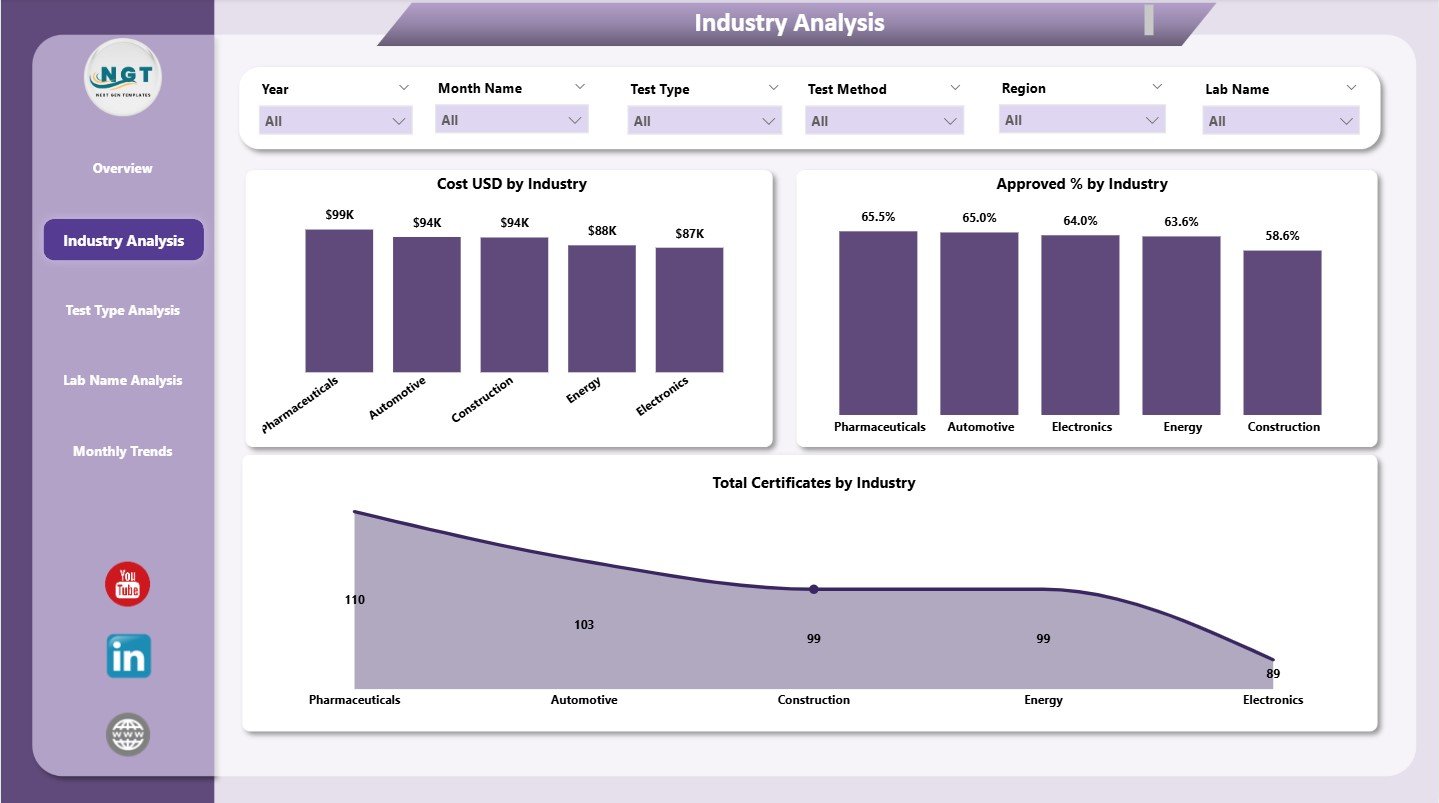
🔹 2. Industry Analysis Page – Evaluate Sector-Wise Performance
This page helps you understand how each industry performs in terms of cost, approval, and volume.
Key charts include:
📌 Cost (USD) by Industry – Track the testing cost distribution
📌 Approved % by Industry – Identify industries with stable or declining quality
📌 Total Certificates by Industry – Measure industry demand and test frequency
This page is extremely useful for R&D teams, quality managers, and operational leaders.
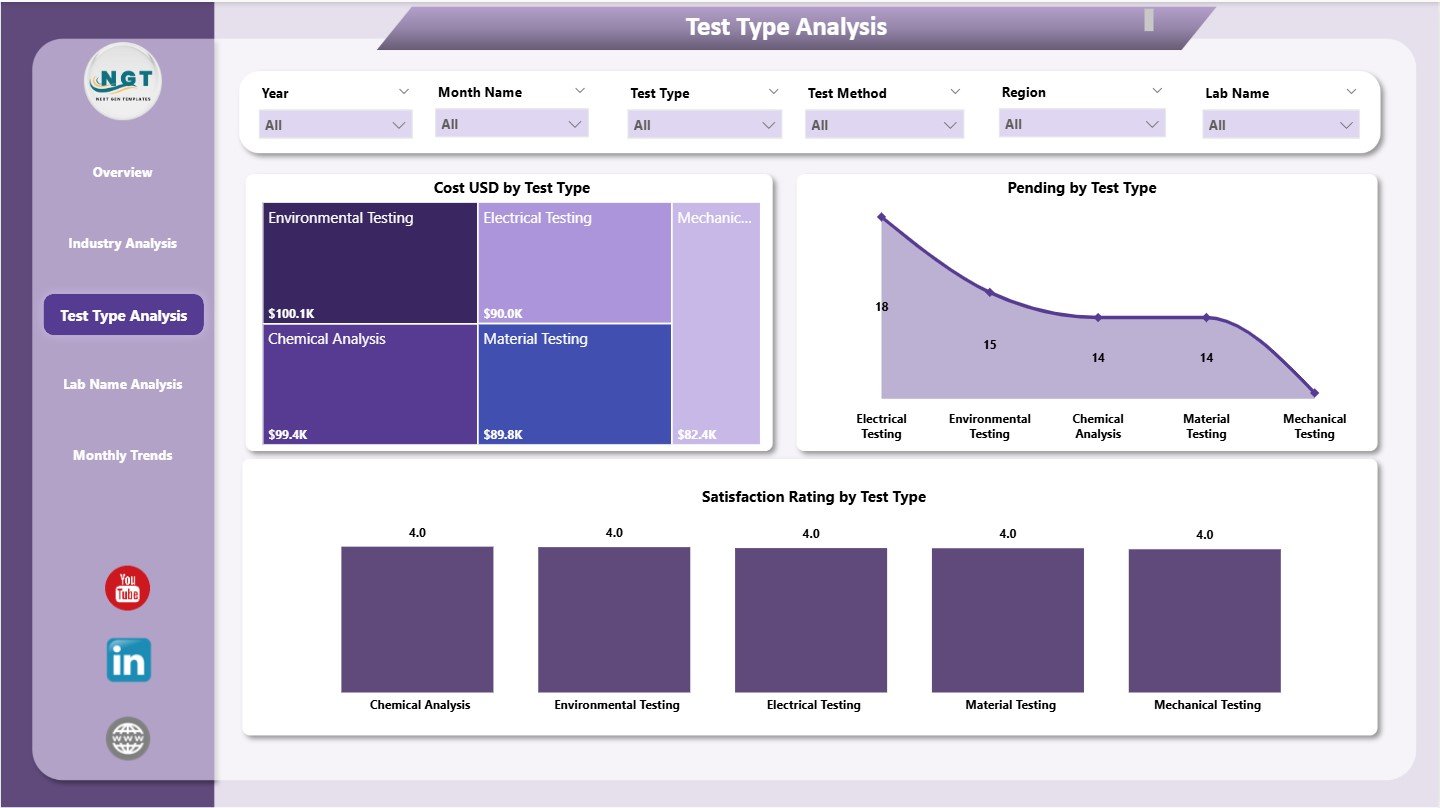
🔹 3. Test Type Analysis Page – Deep Dive into Test Categories
Every test type behaves differently — cost, time, rejection, and satisfaction vary widely. This page highlights these differences.
Key charts include:
📈 Cost (USD) by Test Type – See where resources are most utilized
⏳ Pending Certificates by Test Type – Spot bottlenecks and delays
⭐ Satisfaction Rating by Test Type – Understand customer experience
This helps teams optimize methods, allocate resources better, and improve test quality.
🔹 4. Lab Name Analysis Page – Evaluate Multiple Test Labs
If your organization works with multiple labs, this page becomes essential.
You get three comparative visuals:
💲 Cost (USD) by Lab Name – Identify high-cost vs efficient labs
⏱️ Turnaround Days by Lab Name – Monitor speed & efficiency
😊 Satisfaction Rating by Lab Name – Track client sentiment
These insights help leaders decide where to improve training, speed up processes, or reassign workloads.
🔹 5. Monthly Trends Page – Monitor Performance Over Time
This page reveals long-term behavior of your test certifications.
It includes:
📊 Cost (USD) by Month – Understand spending patterns
📉 Rejected % by Month – Detect recurring dips in quality
⏳ Turnaround Days by Month – Measure improvement or delays
Monthly trends support budgeting, workload planning, and quality improvement strategies.
⭐ How to Use the Test Lab Certifications Dashboard in Power BI
Using this dashboard is extremely simple:
Update your Excel source file
Refresh Power BI
Use slicers to filter results
Review KPI cards & charts
Explore Industry, Test Type & Lab pages
Analyze rejection & trend patterns
Make informed decisions quickly
Everything updates automatically — no manual formatting or calculations.
⭐ Who Can Benefit from This Dashboard?
This dashboard is ideal for:
🧪 Test Laboratories
🏭 Manufacturing Units
🔬 R&D Teams
🛡️ Quality Assurance Departments
📑 Compliance & Regulatory Teams
🧪 Multi-Lab Operations
Anyone involved in testing, certification, or quality monitoring will find this dashboard invaluable.
⭐ How This Dashboard Improves Your Decision-Making
With real-time insights, your organization can:
✔ Improve approval percentage
✔ Reduce test rejections
✔ Control test costs
✔ Improve turnaround time
✔ Boost customer satisfaction
✔ Strengthen lab performance
✔ Build transparency across teams
The dashboard transforms your certification data into action.






























Reviews
There are no reviews yet.