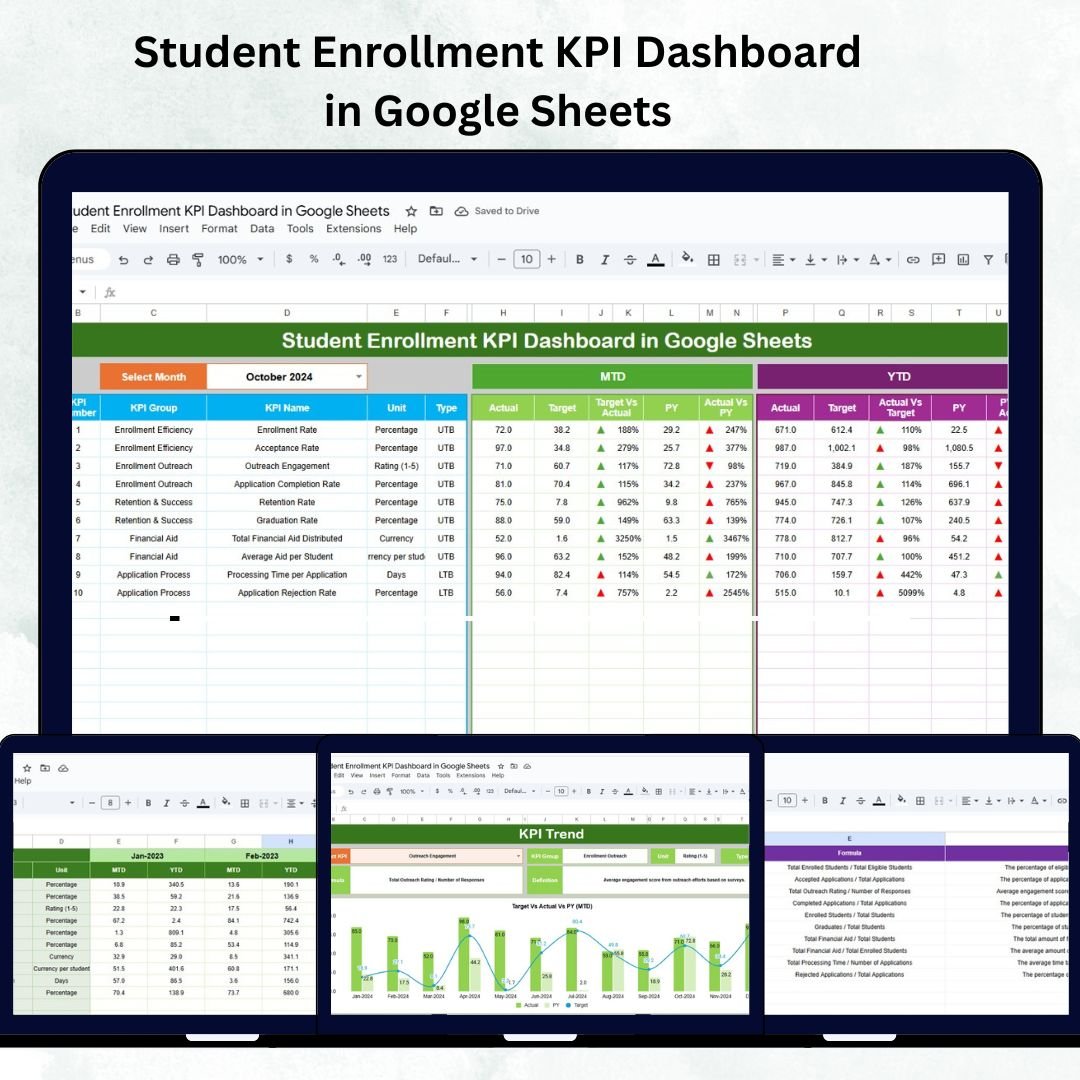
Managing student enrollment efficiently is vital for the success of any educational institution. From monitoring application trends to analyzing conversion rates, institutions require real-time data insights to make informed decisions. The Student Enrollment KPI Dashboard in Google Sheets provides a ready-to-use, fully automated solution to visualize, analyze, and track every key metric related to student enrollment — all in one centralized dashboard.
Built for schools, colleges, and universities, this Google Sheets dashboard enables administrators to assess enrollment performance, retention rates, and marketing outcomes, ensuring continuous improvement in academic planning and admissions management.
🎯 What Is a Student Enrollment KPI Dashboard in Google Sheets?
The Student Enrollment KPI Dashboard is an interactive, data-driven reporting tool that consolidates all enrollment-related information into an intuitive visual interface. It simplifies performance tracking by automating comparisons between actual results, targets, and historical data.
This Google Sheets solution helps teams:
✅ Collaborate across departments in real time
✅ Monitor monthly (MTD) and yearly (YTD) performance
✅ Identify trends and areas for improvement
✅ Generate visual insights for strategic planning
With automatic updates, dynamic charts, and drop-down filters, this dashboard eliminates the need for complex software while delivering professional-level analytics.
🔑 Key Features of the Student Enrollment KPI Dashboard
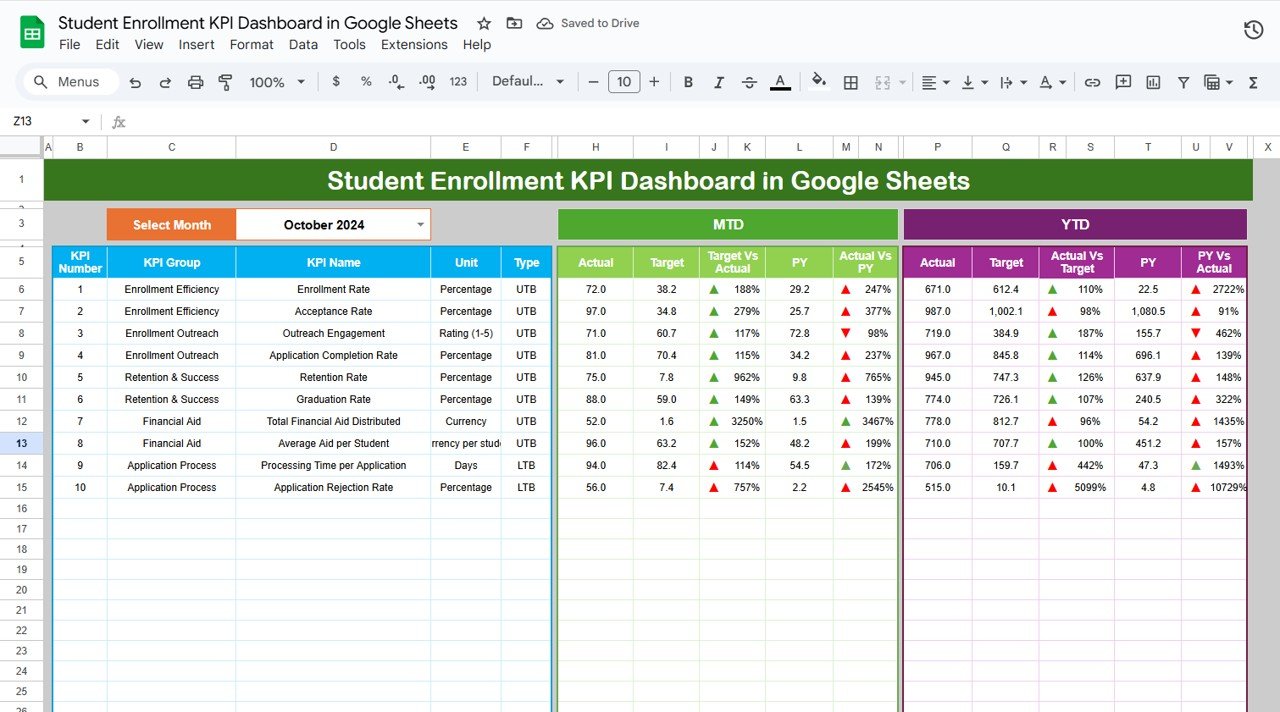
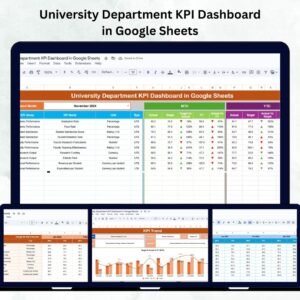
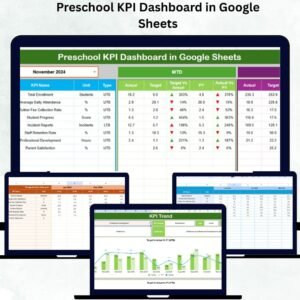
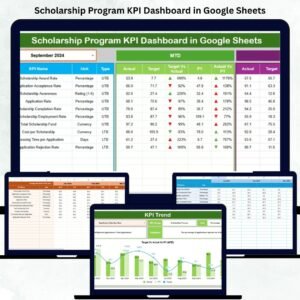
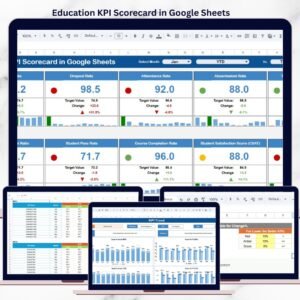
🧭 1. Dashboard Sheet Tab – Central Overview
This is the main page where all institutional KPIs are summarized visually.
Features Include:
-
📅 Month Selector (Cell D3): Choose any month to dynamically view results.
-
📊 MTD & YTD KPIs: Automatically calculates Month-to-Date and Year-to-Date performance.
-
📈 Previous Year Comparisons: Track progress vs. last year’s results (CY vs PY).
-
✅ Conditional Formatting: Green/red arrows indicate whether performance meets or misses targets.
All data refreshes instantly, giving administrators a clear picture of the institution’s current performance and growth trajectory.
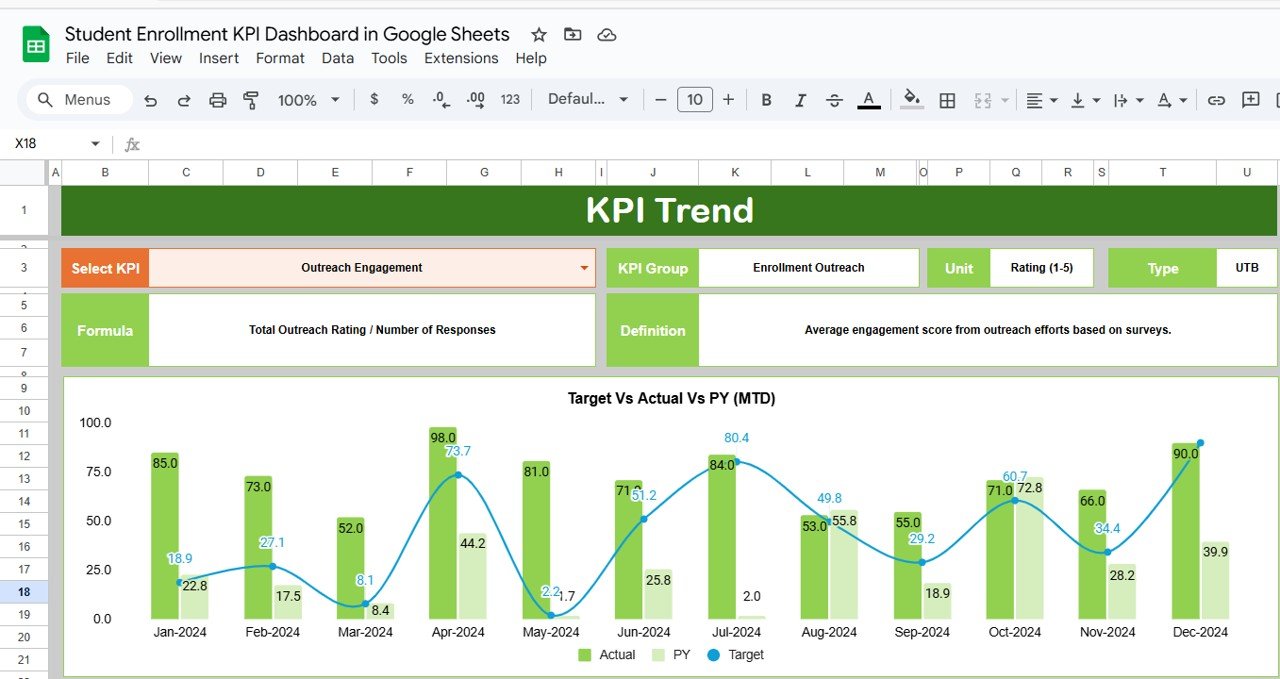
📈 2. KPI Trend Sheet Tab – Analyze Growth Patterns
This tab focuses on historical performance trends and long-term insights.
Highlights:
-
🎯 Dropdown in Cell C3: Select any KPI to view its trend over months.
-
🧩 KPI Details: Displays KPI group, unit, formula, and definition.
-
🔼 Performance Type: Indicates Upper-the-Better (UTB) or Lower-the-Better (LTB) KPIs.
-
📊 Trend Chart: Visualizes KPI movement month-over-month.
Perfect for identifying enrollment peaks, seasonal variations, and long-term progress.
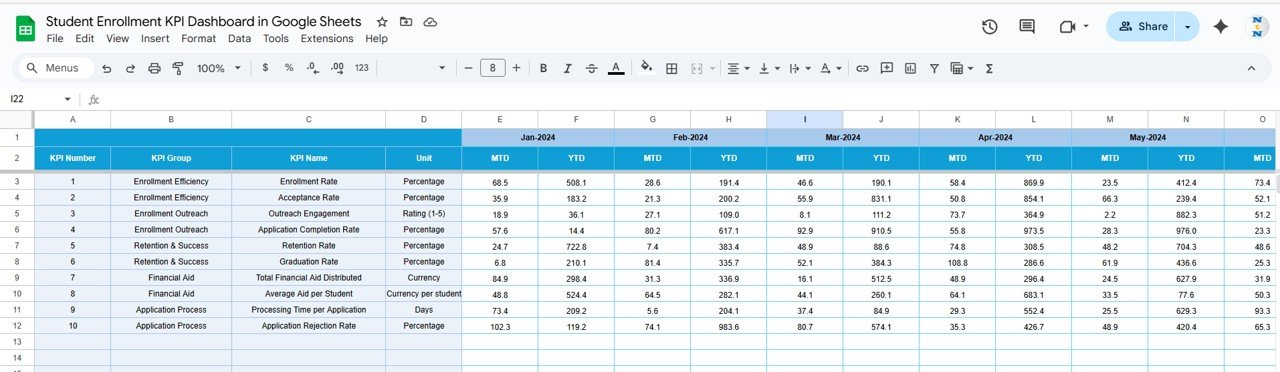
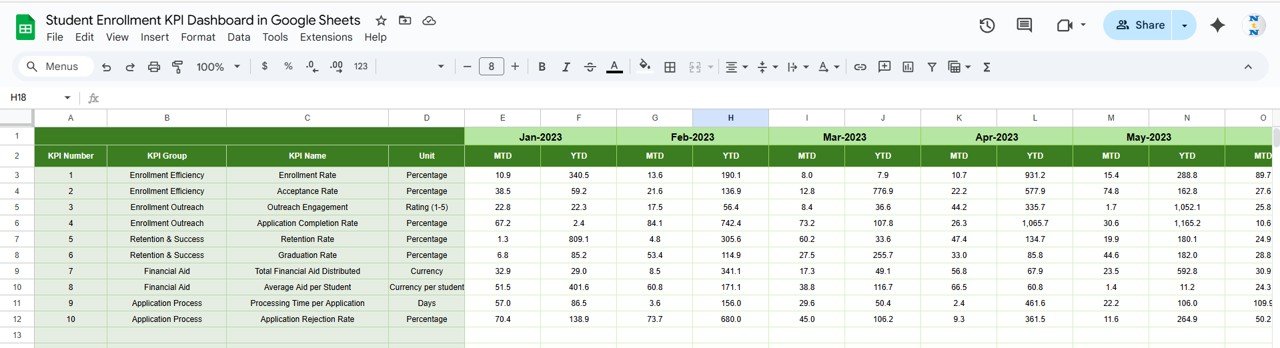
🧾 3. Actual Numbers Sheet Tab
Enter your institution’s monthly performance data here.
Functions:
-
Input MTD and YTD actuals.
-
The dashboard auto-refreshes based on the selected month (E1).
-
No manual recalculation needed — it’s fully automated.
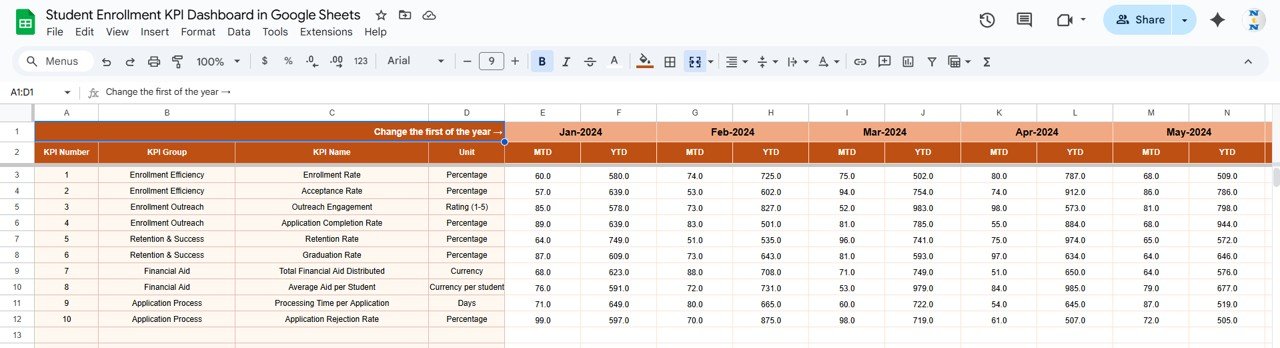
🎯 4. Target Sheet Tab
Set monthly and yearly goals for each KPI to measure against actual performance.
-
Compare MTD Target vs Actual for quick gap analysis.
-
Use YTD Target to track progress toward annual goals.
📅 5. Previous Year Numbers Sheet Tab
Input last year’s data for performance comparison and growth tracking.
Use This Sheet To:
-
Measure YoY growth rates automatically.
-
Identify recurring trends or problem areas.
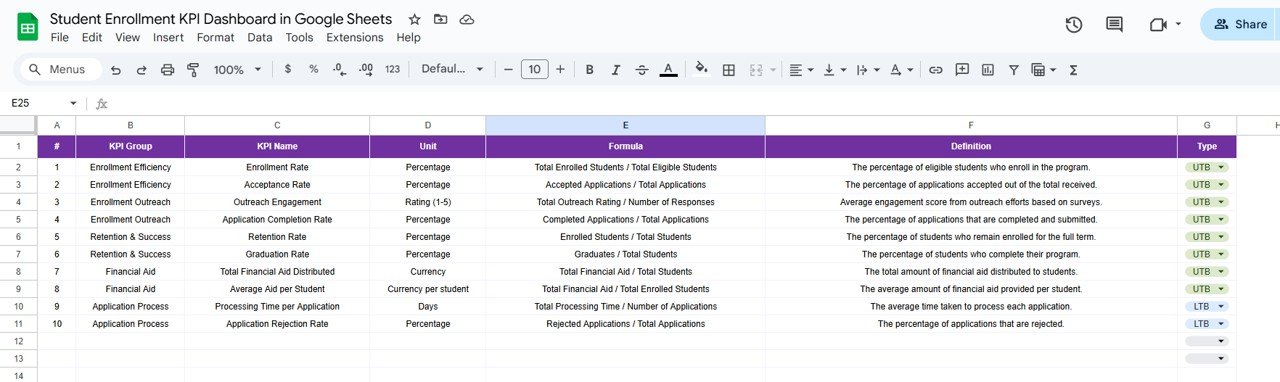
📘 6. KPI Definition Sheet Tab
Maintain clarity and consistency by documenting all KPI definitions.
Columns Include:
-
KPI Group (Admission, Retention, Academics, Finance)
-
KPI Name
-
Unit (%, $, Count, Score)
-
Formula
-
Definition
-
Type (UTB or LTB)
This ensures everyone understands the metrics being tracked and how they are calculated.
🌟 Advantages of Using the Student Enrollment KPI Dashboard
-
🎯 Centralized Tracking: Monitor all KPIs in one place.
-
🧮 Accurate Calculations: Automated formulas minimize manual errors.
-
🔁 Real-Time Updates: Dashboard reflects every data change instantly.
-
📈 Strategic Insights: Compare actuals vs. targets vs. previous year performance.
-
⚙️ Customizable: Add or remove KPIs to suit your institution’s reporting structure.
-
💡 Data Visualization: Dynamic charts make analysis easier and faster.
💡 Best Practices
✅ Update Monthly: Keep KPI data current for accurate insights.
✅ Set Realistic Goals: Align KPI targets with institutional strategy.
✅ Categorize Data: Separate by program type (UG, PG, Short-Term).
✅ Encourage Collaboration: Allow departments (Admissions, Academics, Finance) to update data in real time.
✅ Focus on Trends: Use the KPI Trend sheet to identify seasonal behavior and performance gaps.
🎓 How This Dashboard Benefits Educational Institutions
-
🧭 Improves enrollment efficiency and decision-making
-
📊 Tracks conversion, dropout, and satisfaction KPIs
-
💰 Supports scholarship planning and financial forecasting
-
🏫 Enhances transparency and inter-department collaboration
-
🚀 Enables data-backed strategic growth
🔗 Click here to read the detailed blog post
Watch the step-by-step video Demo:


Reviews
There are no reviews yet.