

Tracking educational performance across multiple KPIs can quickly become complex—especially when data is reported manually or spread across different files. Institutions often struggle to monitor enrollment trends, attendance, learning outcomes, faculty utilization, and student satisfaction in a single, consistent view. As a result, leadership decisions become reactive instead of data-driven.
That is exactly why the Education KPI Scorecard in Google Sheets is a powerful, ready-to-use performance management solution.
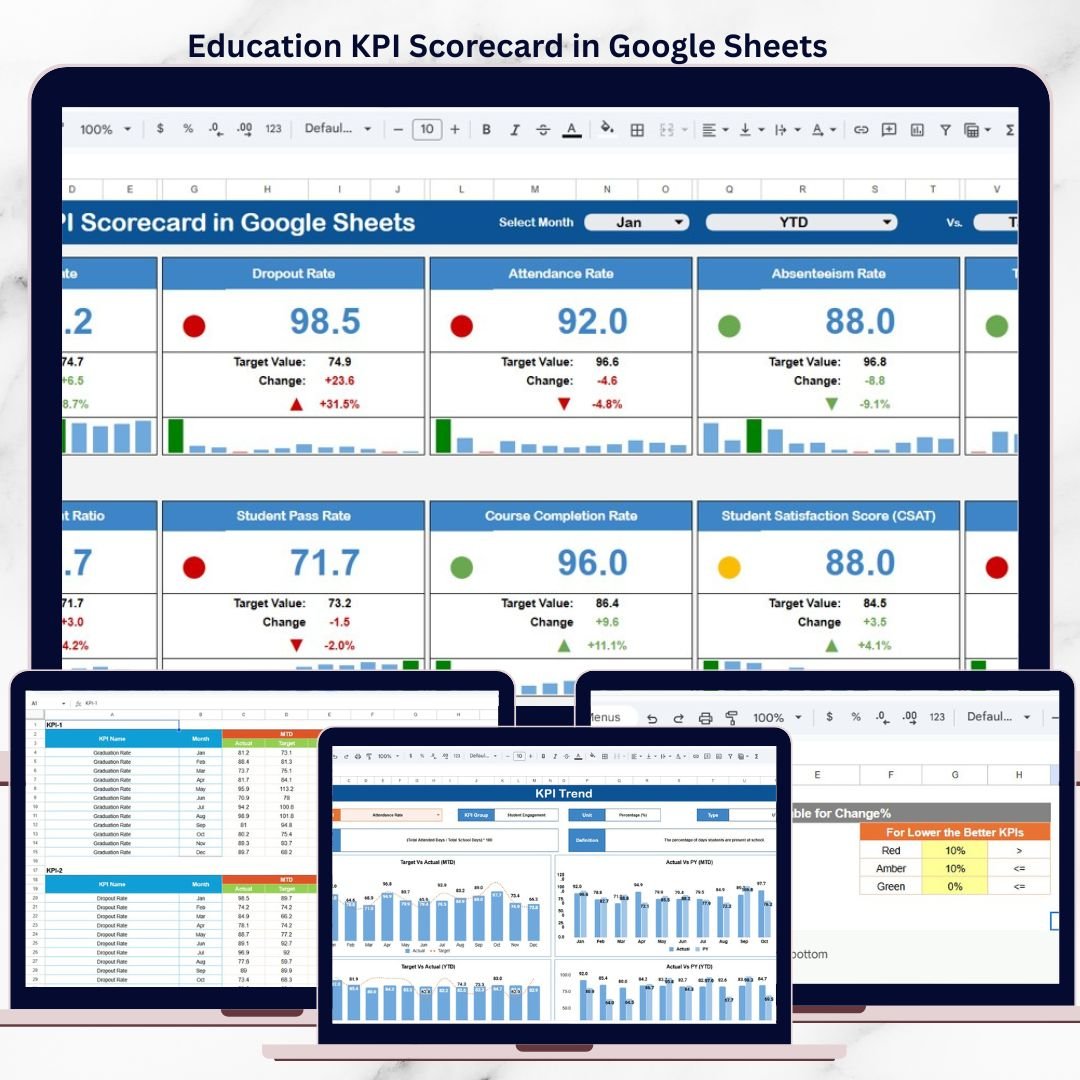
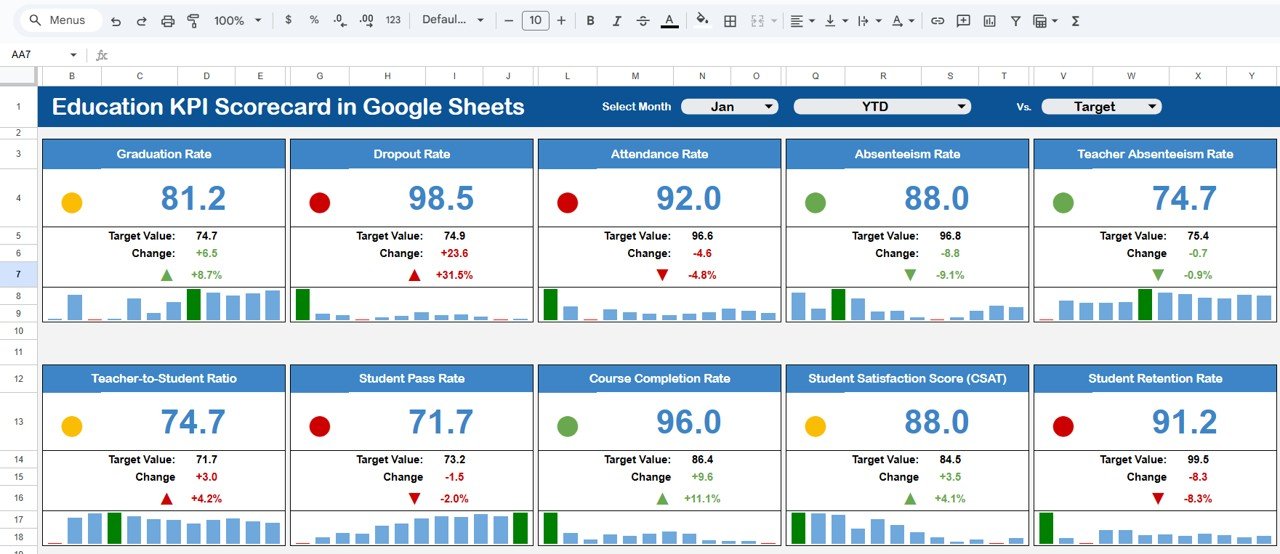
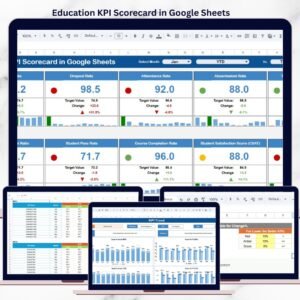
This professionally designed scorecard consolidates 10 critical education KPIs into one interactive and visual scorecard, allowing schools, colleges, universities, and training institutes to monitor performance monthly and yearly with ease. Instead of reviewing multiple reports, administrators can instantly assess performance health using traffic lights, trend arrows, and automated calculations.
Because the scorecard is built entirely in Google Sheets, it is cloud-based, easy to share, and fully customizable—without requiring advanced technical skills or expensive BI tools.
🎯 Key Features of the Education KPI Scorecard in Google Sheets
📊 10 Education KPIs in One Central Scorecard
Track the most important education performance metrics in a single view, such as:
-
Student Enrollment Performance
-
Attendance Rate
-
Course Completion Rate
-
Assessment Performance
-
Faculty Utilization
-
Student Satisfaction
-
Dropout Ratio
-
Training Effectiveness
-
Resource Utilization
-
Compliance / Accreditation KPIs
All KPIs are fully customizable based on your institution’s academic and operational goals.
📅 Dynamic Month Selector with MTD & YTD View
A built-in Month Dropdown allows users to switch reporting periods instantly.
When the month changes:
-
All KPI values update automatically
-
MTD (Month-to-Date) and YTD (Year-to-Date) views refresh
-
Traffic-light indicators adjust dynamically
-
Percentage change arrows reflect performance trends
This ensures consistent and reliable monthly and yearly performance tracking.
🚦 Traffic Lights & Trend Indicators
Each KPI includes:
-
Green / Amber / Red traffic-light colors for performance status
-
Up & Down arrows to show improvement or decline
-
Percentage variance indicators
Decision-makers can identify underperforming areas at a glance—without deep analysis.
📂 What’s Inside the Education KPI Scorecard
📌 Scorecard / Dashboard Sheet
This is the main performance view used for reviews and meetings.
It displays:
-
KPI Name
-
Actual values
-
Target comparison
-
Percentage variance
-
Traffic-light indicators
-
MTD & YTD toggle
Ideal for principals, administrators, and leadership teams.
📈 KPI Trend Sheet
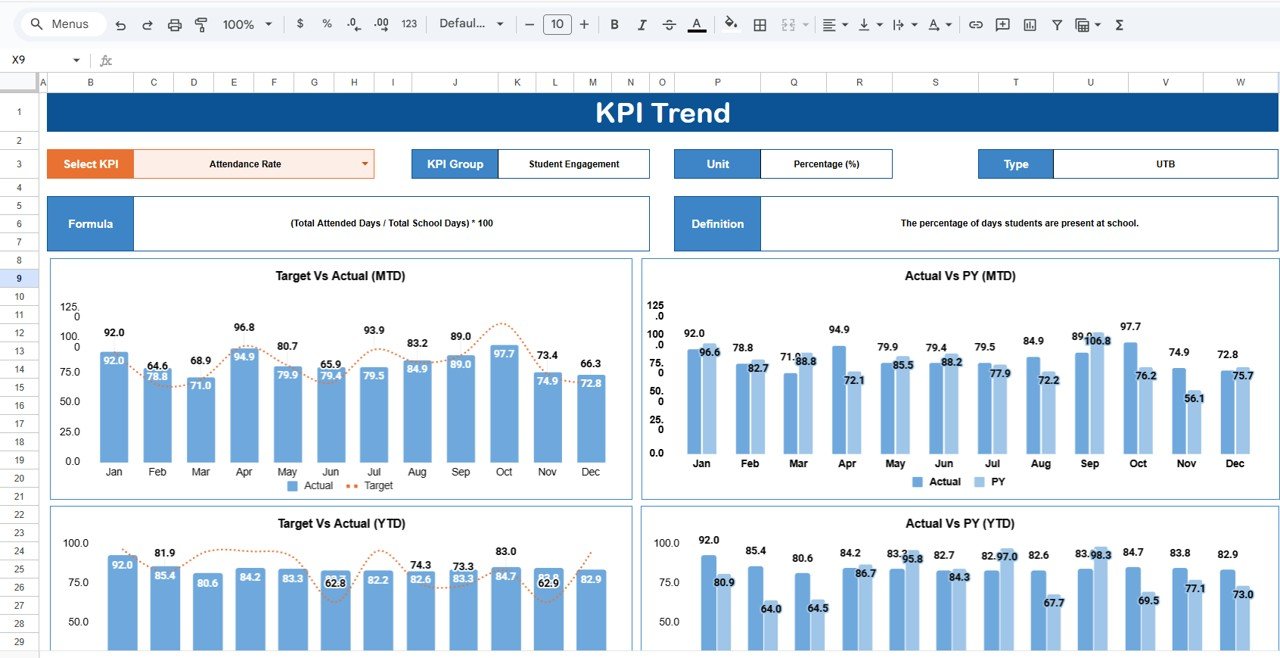
The Trend Sheet provides detailed KPI behavior over time.
How it works:
-
Select a KPI from the dropdown in Cell C3
-
Automatically displays:
-
KPI Group
-
KPI Unit
-
KPI Type (Lower the Better / Upper the Better)
-
KPI Formula
-
KPI Definition
-
This sheet supports root-cause analysis and performance reviews.
📚 KPI Definition Sheet
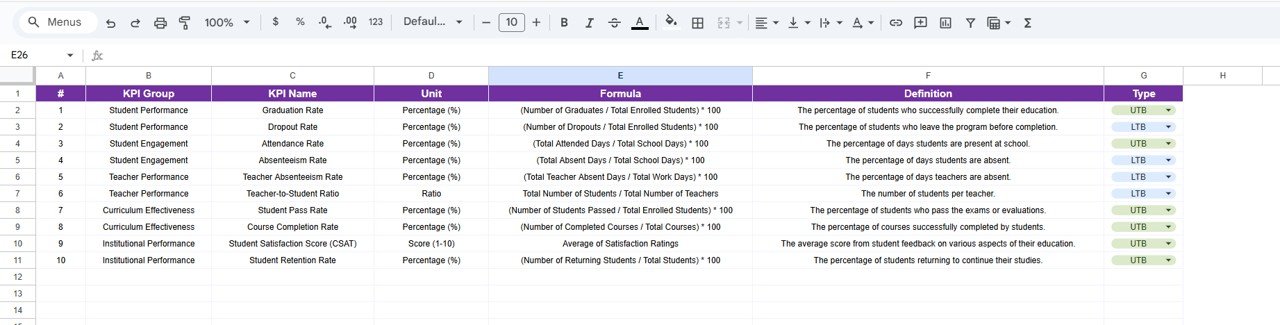
Acts as the KPI master reference.
It includes:
-
KPI Name
-
KPI Group
-
Unit of Measurement
-
KPI Formula
-
KPI Definition
This ensures clarity, consistency, and governance across all KPI calculations.
🧮 Data Input Sheet
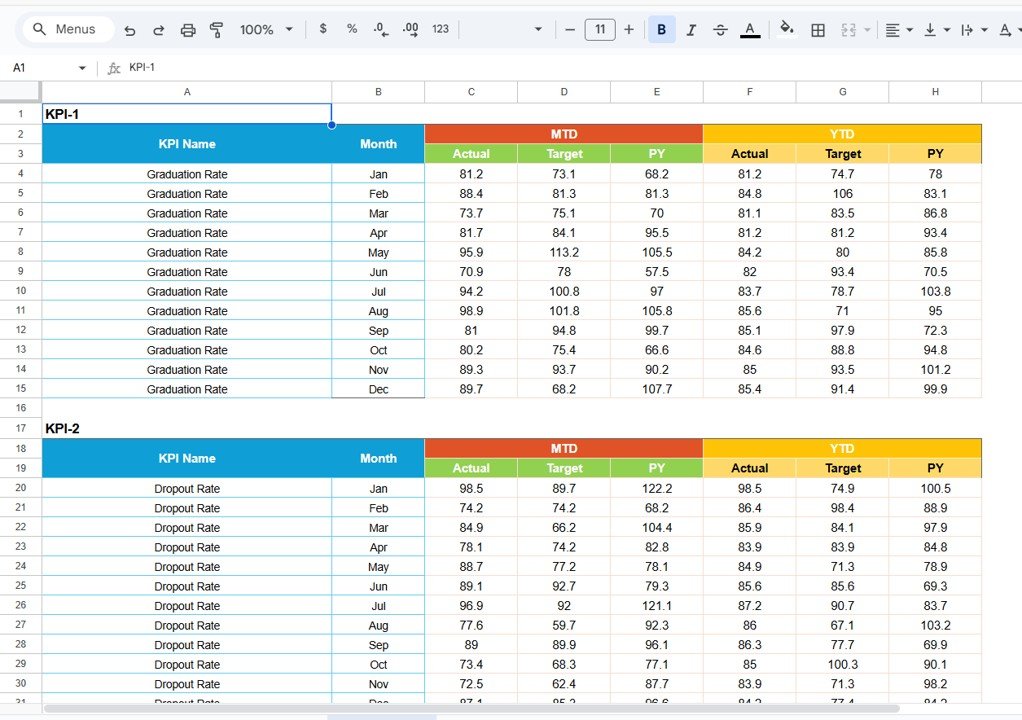
The Data Input Sheet is where actual KPI data is entered.
Key benefits:
-
Enter monthly actual values only
-
No formulas need to be modified
-
MTD and YTD values calculate automatically
-
All visuals update instantly
This makes the scorecard easy to use even for non-technical users.
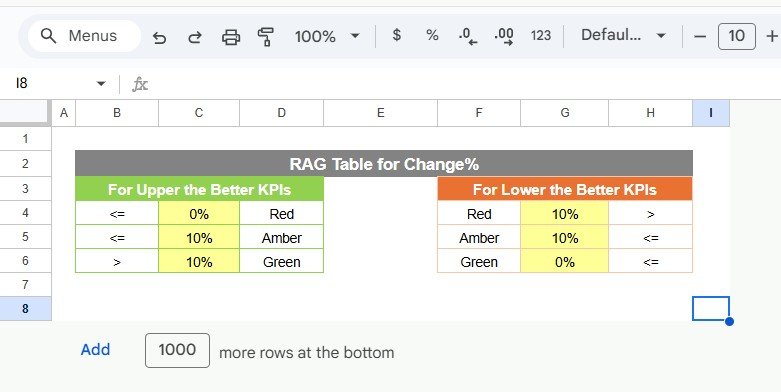
🎨 Colour Settings Sheet
This optional sheet allows you to:
-
Customize traffic-light thresholds
-
Adjust performance color rules
-
Align visuals with academic benchmarks
🏫 Who Can Benefit from This Education KPI Scorecard
-
🎓 Schools & Colleges
-
🏛 Universities & Academic Departments
-
📘 Training & Coaching Institutes
-
📊 Education Consultants
-
💡 EdTech Operations Teams
### Click here to read the Detailed blog post
Watch the step-by-step video tutorial:




Reviews
There are no reviews yet.