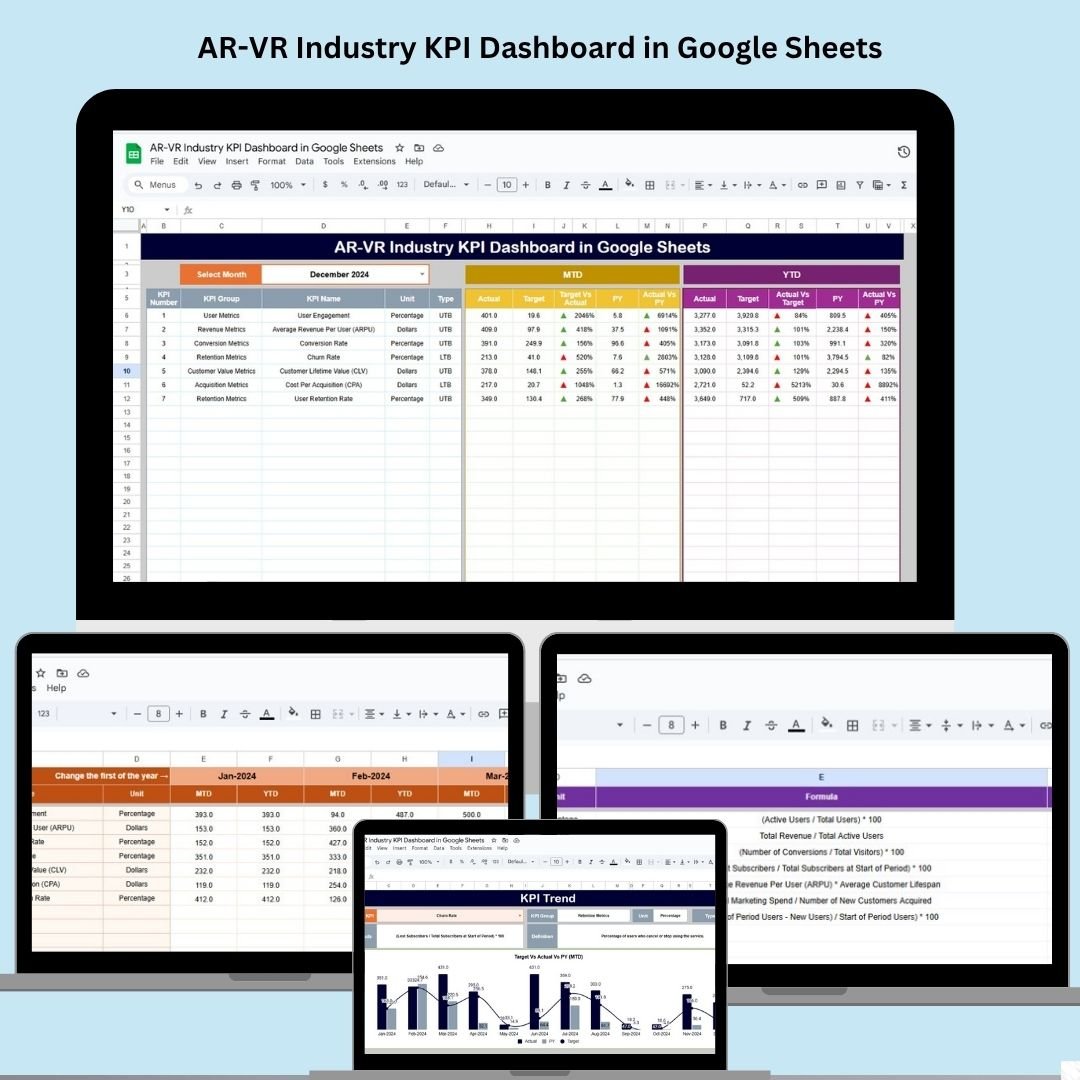
Track, measure, and optimize your augmented reality (AR) and virtual reality (VR) business performance with this powerful, fully customizable AR-VR Industry KPI Dashboard in Google Sheets. Designed specifically for AR-VR developers, marketers, and product teams, this dashboard delivers real-time insights on key performance indicators—without the cost or complexity of heavy-duty software.
Whether you’re launching immersive apps, managing user engagement, or analyzing content effectiveness, this dashboard gives you a clear picture of your operational health and strategic progress—all within the familiar and flexible Google Sheets platform.
✨ Key Features of AR-VR KPI Dashboard
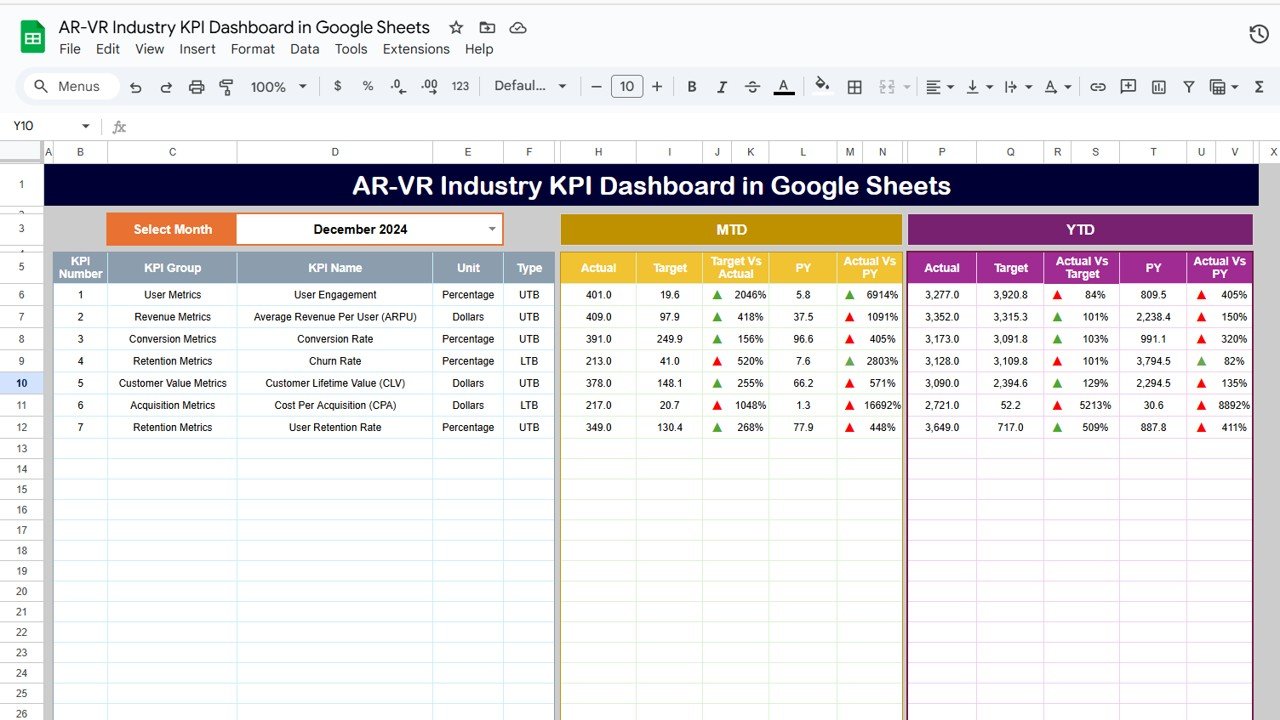
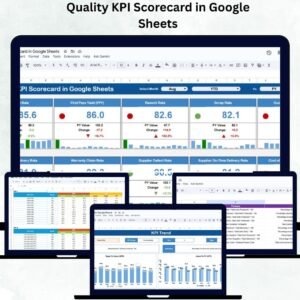
🗂️ 1. Dashboard Sheet – Visual Business Summary
-
📅 Month Selection (D3) – Switch between months to update the dashboard dynamically
-
📊 MTD and YTD views: Compare Actuals vs Targets vs Previous Year
-
✅ Conditional Formatting: Arrows show performance status at a glance
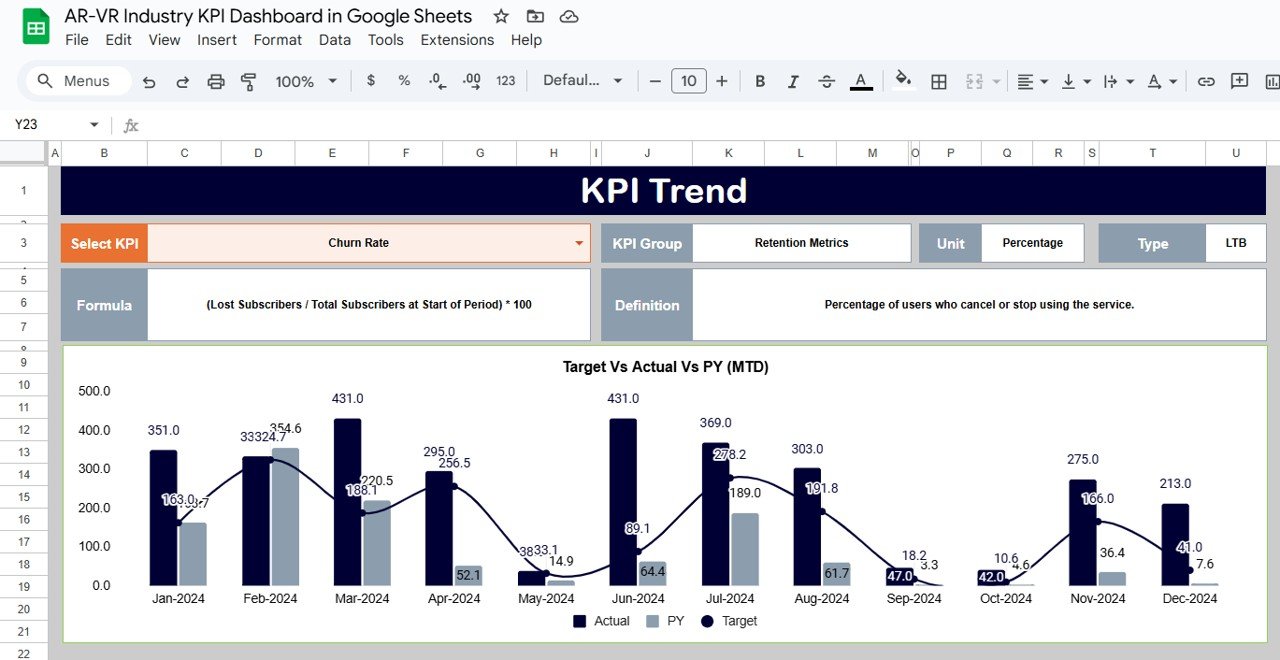
📈 2. KPI Trend Sheet – Visualize Progress Over Time
-
📍 Select KPIs from a dropdown menu
-
📊 Analyze month-over-month performance
-
🧠 Review KPI formula, type (UTB/LTB), unit, and definition for full context
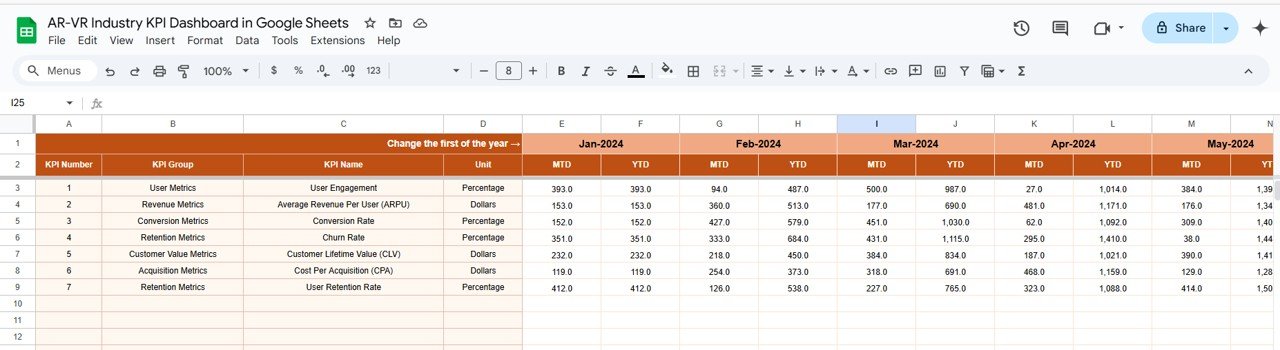
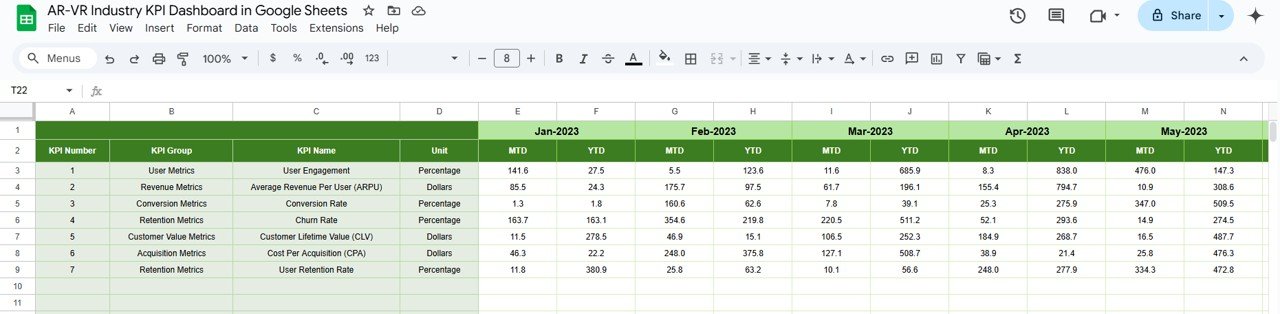
🧾 3. Actual Numbers Sheet – Real-Time Input Center
-
🔢 Input monthly MTD/YTD values
-
🗓️ Change starting month in cell E1 to align the entire dashboard view
🎯 4. Target Sheet – Define Your Monthly & Yearly Goals
-
Set KPI targets for MTD and YTD performance
-
Keep your team goal-focused and results-driven
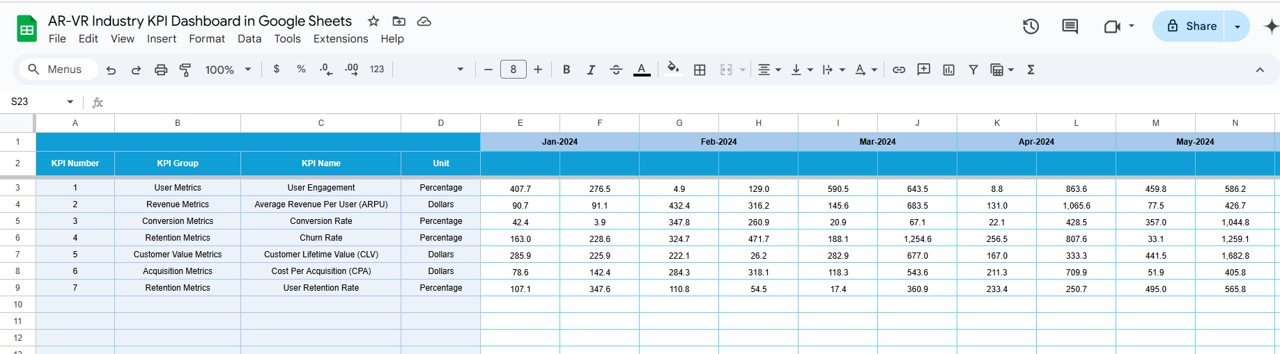
📊 5. Previous Year Sheet – Benchmark Against History
-
Enter last year’s values for each KPI
-
Analyze growth, trendlines, and performance gaps
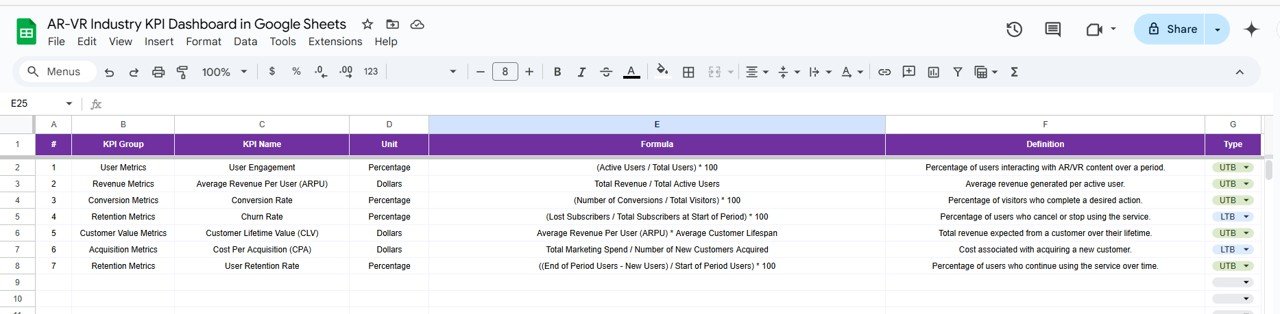
📘 6. KPI Definition Sheet – Know Your Metrics
-
Define KPI name, group (e.g., Financial, User Engagement), unit, type
-
📚 Clear explanations and formulas keep all users aligned
🛠️ How to Use the AR-VR KPI Dashboard
👉 Step 1: Enter Actual Performance Data
Use the Actual Numbers Sheet to input your real-world performance each month.
👉 Step 2: Set Clear Targets
Input targets in the Target Sheet to monitor MTD/YTD progress across all KPIs.
👉 Step 3: Compare to Previous Year
Use the Previous Year sheet to evaluate growth and spot long-term trends.
👉 Step 4: Select Month in Dashboard (D3)
See real-time updates of visual metrics and performance indicators.
👉 Step 5: Drill into Trends
Use the KPI Trend tab to monitor individual KPI movement over time and adapt strategy.
👥 Who Can Benefit from This Dashboard?
🎮 AR/VR Product Managers – Track engagement, performance, and user behavior
📈 Marketing Teams – Monitor lead generation, ROI, and cost per acquisition
💡 Founders & Startups – Align product performance with business goals
💻 Tech Developers – Visualize operational KPIs across app versions
🧠 Analysts & Consultants – Deliver high-level reports with live visuals
This dashboard is ideal for AR/VR companies, agencies, freelancers, and startups looking to track growth, user metrics, and profitability in one place.
🔧 Customize to Match Your Business
🧩 Add New KPIs – Simply insert new rows in the KPI Definition tab
🎨 Brand It – Update the theme colors or embed your company logo
⚠️ Conditional Formatting – Highlight red zones or low-performing KPIs
🔁 Extend Time Periods – Modify month ranges to suit your fiscal calendar
🔄 Integrate – Link with tools like Zapier, Google Analytics, or Looker Studio
✅ Click here to read the Detailed blog post
Watch the step-by-step video Demo:


Reviews
There are no reviews yet.