In today’s skill-driven world, vocational institutes must monitor performance with precision. Enrollment numbers, completion rates, trainer efficiency, and job placement data determine the true success of any program. 📊
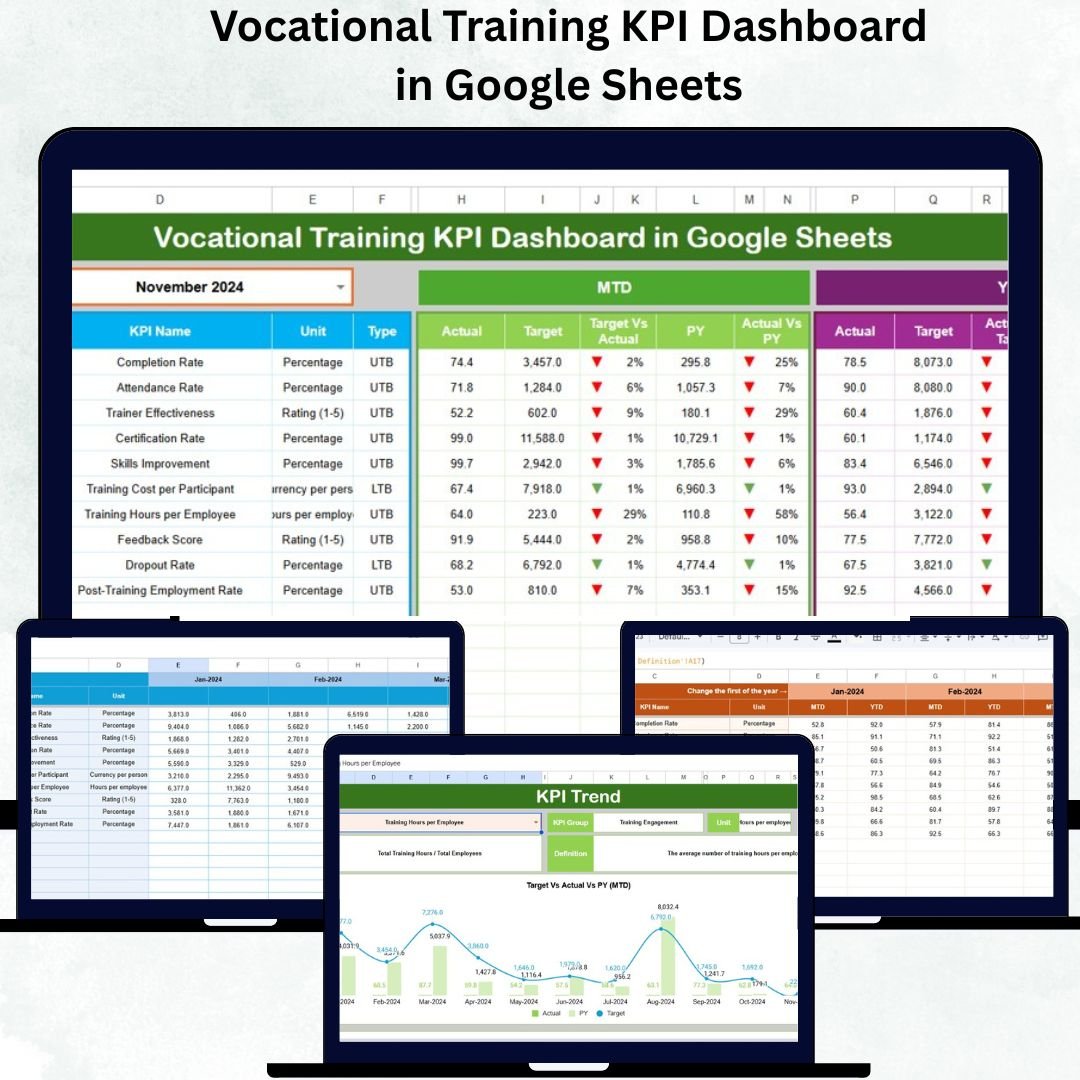
That’s why we created the Vocational Training KPI Dashboard in Google Sheets — a ready-to-use, interactive tool that transforms scattered data into crystal-clear insights. Whether you’re managing a training center, skill academy, or certification program, this dashboard helps you stay organized, informed, and performance-driven.
✨ Key Features of Vocational Training KPI Dashboard in Google Sheets
✅ Real-Time Analytics:
Instantly view Month-to-Date (MTD) and Year-to-Date (YTD) Actual, Target, and Previous Year (PY) performance.
📈 Interactive Dashboard:
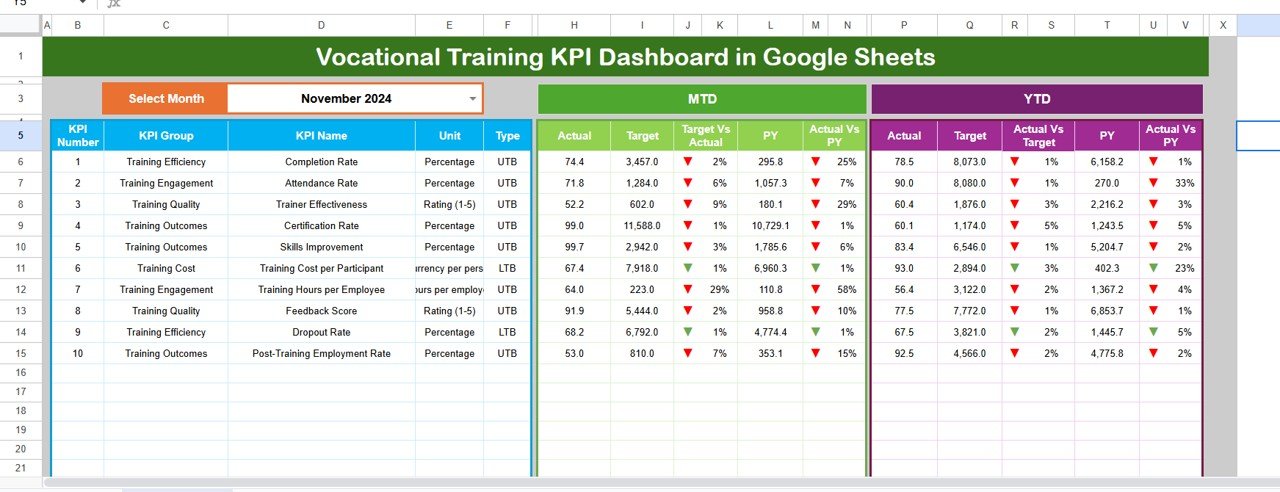
Use the month dropdown (cell D3) to switch between months and watch the visuals update automatically.
🎯 Performance Indicators:
Conditional formatting arrows (green/red) make it easy to spot areas of improvement and success.
📊 Data Visualization:
Dynamic charts show trends across student performance, trainer results, and placement achievements.
💡 Automation Built-In:
Smart formulas and references eliminate manual calculations and reduce human error.
☁️ Cloud Collaboration:
Since it’s hosted on Google Sheets, multiple users can view and edit simultaneously from anywhere.
🧩 Customizable KPIs:
Add or modify metrics in the KPI Definition sheet to match your institute’s unique requirements.
📂 What’s Inside the Vocational Training KPI Dashboard
1️⃣ Dashboard Sheet – The central control hub that displays summarized MTD and YTD data for all KPIs with up/down arrows for instant insights.
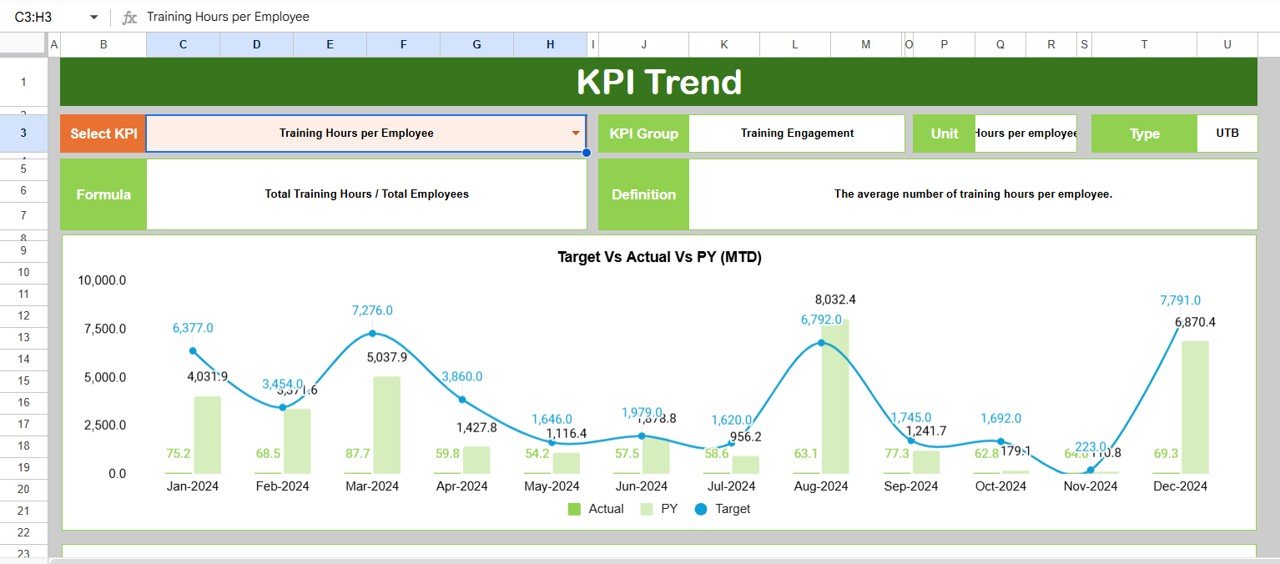
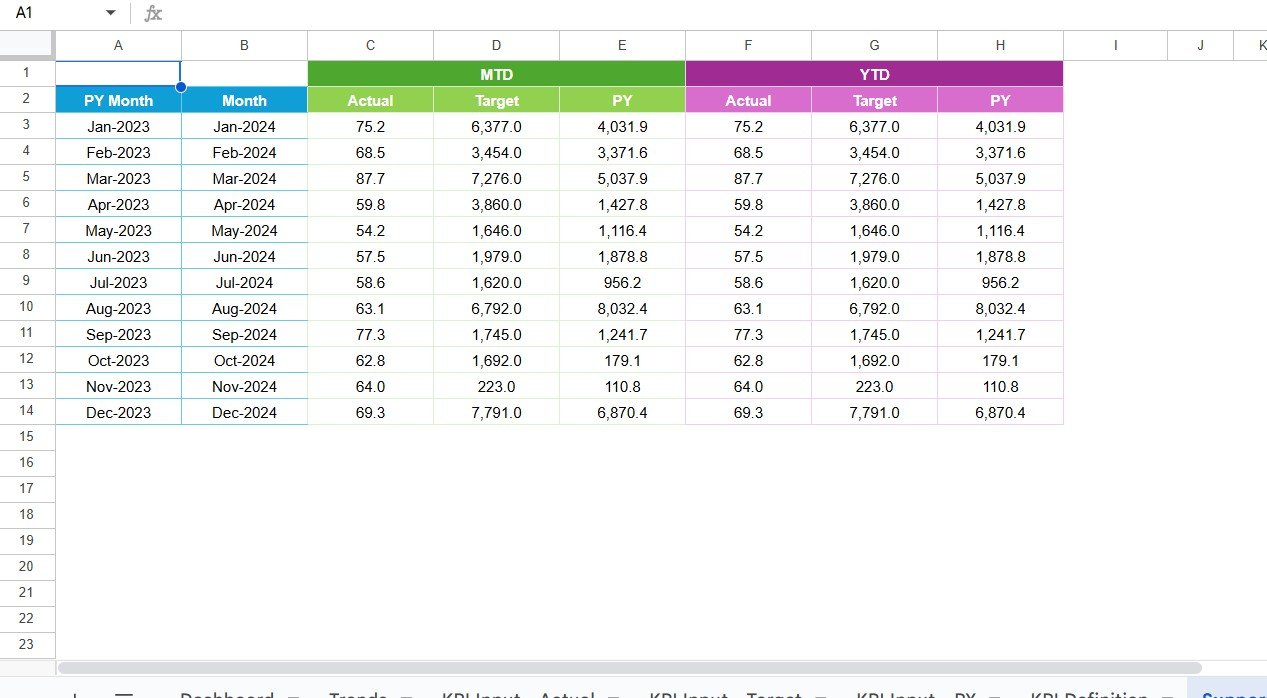
2️⃣ Trend Sheet – Select a KPI (via dropdown) and visualize Actual vs Target vs Previous Year trends to understand long-term progress.
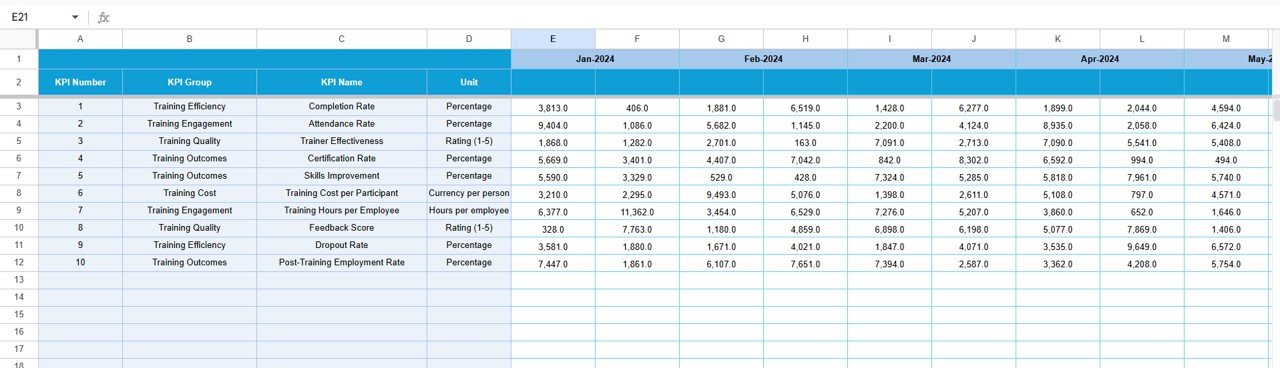
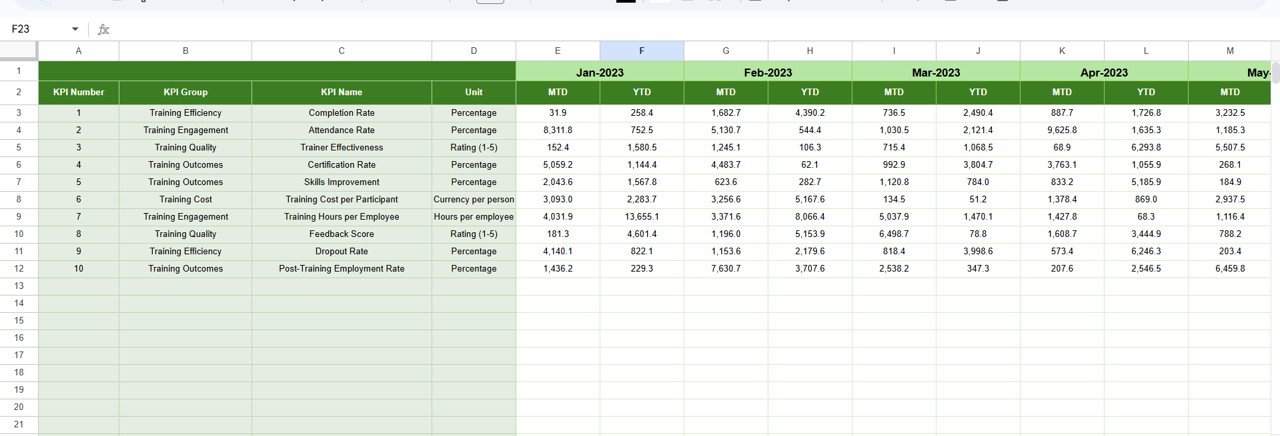
3️⃣ Actual Numbers Input Sheet – Input monthly MTD and YTD data; the system auto-updates charts and summaries.
4️⃣ Target Sheet – Set monthly and yearly goals for each KPI such as enrollment, trainer efficiency, and job placements.
5️⃣ Previous Year Sheet – Store historical records to compare performance year-over-year.
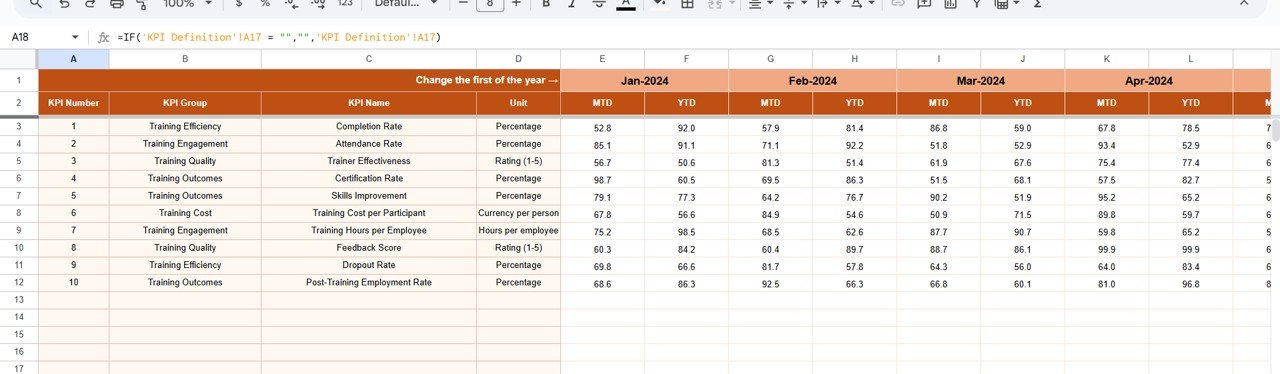
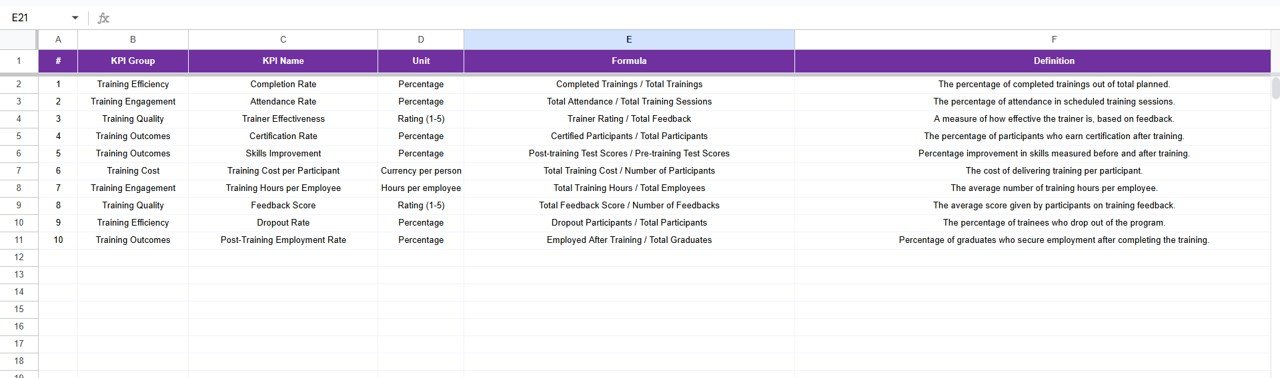
6️⃣ KPI Definition Sheet – View KPI groups, units, formulas, and definitions to ensure data consistency and transparency.
Each tab is linked seamlessly, ensuring every update reflects instantly across the dashboard.
🧭 How to Use the Vocational Training KPI Dashboard
1️⃣ Make a Copy: Open the file in Google Sheets and save your own version.
2️⃣ Set Base Month (Cell E1): Enter the first month of your academic or fiscal year.
3️⃣ Input Actual Data: Fill in MTD and YTD values in the “Actual Numbers” sheet.
4️⃣ Set Targets: Define monthly and annual goals in the “Target” sheet.
5️⃣ Enter Previous Year Data: Add last year’s numbers for growth comparisons.
6️⃣ Explore the Dashboard: Use the Month selector (D3) to visualize dynamic performance charts.
7️⃣ Review Trends: Analyze long-term KPI behavior in the “Trend” tab.
8️⃣ Customize KPIs: Update the “KPI Definition” sheet with your own metrics anytime.
Within minutes, you’ll turn static data into interactive, decision-making power. ⚡
👩🏫 Who Can Benefit from This Vocational Training KPI Dashboard
🎓 Vocational Training Institutes: Monitor enrollment, completion, and job placement in real-time.
🏫 Colleges & Technical Schools: Track trainer performance and student satisfaction.
💼 Corporate Training Departments: Measure course success rates and participation levels.
🌐 NGOs & Skill Programs: Evaluate outcomes of government or donor-funded training projects.
📊 Education Consultants: Present measurable results to clients and stakeholders.
🧑💻 Training Managers: Simplify monthly reporting and identify underperforming areas fast.
Click here to read the Detailed Blog Post
Watch the step-by-step video tutorial:
Visit our YouTube channel to learn step-by-step video tutorials


Reviews
There are no reviews yet.