


A Sports & Recreation KPI Dashboard in Power BI is the ultimate performance-monitoring solution for sports clubs, recreation centers, fitness studios, academies, gyms, and wellness organizations. These teams handle countless activities daily—program enrollments, facility usage, member participation, events, and financial management. Without a structured system, they struggle toSports & Recreation KPI Dashboard in Power BI understand trends, measure performance, or improve decision-making. This ready-to-use dashboard solves that problem instantly.
This powerful, visually rich dashboard converts raw Excel-based data into dynamic insights using Power BI. It provides Month-to-Date (MTD) and Year-to-Date (YTD) performance, previous year comparisons, target tracking, KPI definitions, and interactive trend analysis. With just a few clicks, teams can explore performance deeply, spot opportunities, fix issues, and stay aligned with organizational goals. Whether you’re managing memberships, budget, facilities, or program success, this dashboard gives complete clarity and confidence.
✨ Key Features of the Sports & Recreation KPI Dashboard in Power BI
This ready-made dashboard includes three intelligently designed pages, each created to deliver meaningful insights:Sports & Recreation KPI Dashboard in Power BI,
📌 Summary Page – Complete Performance Snapshot
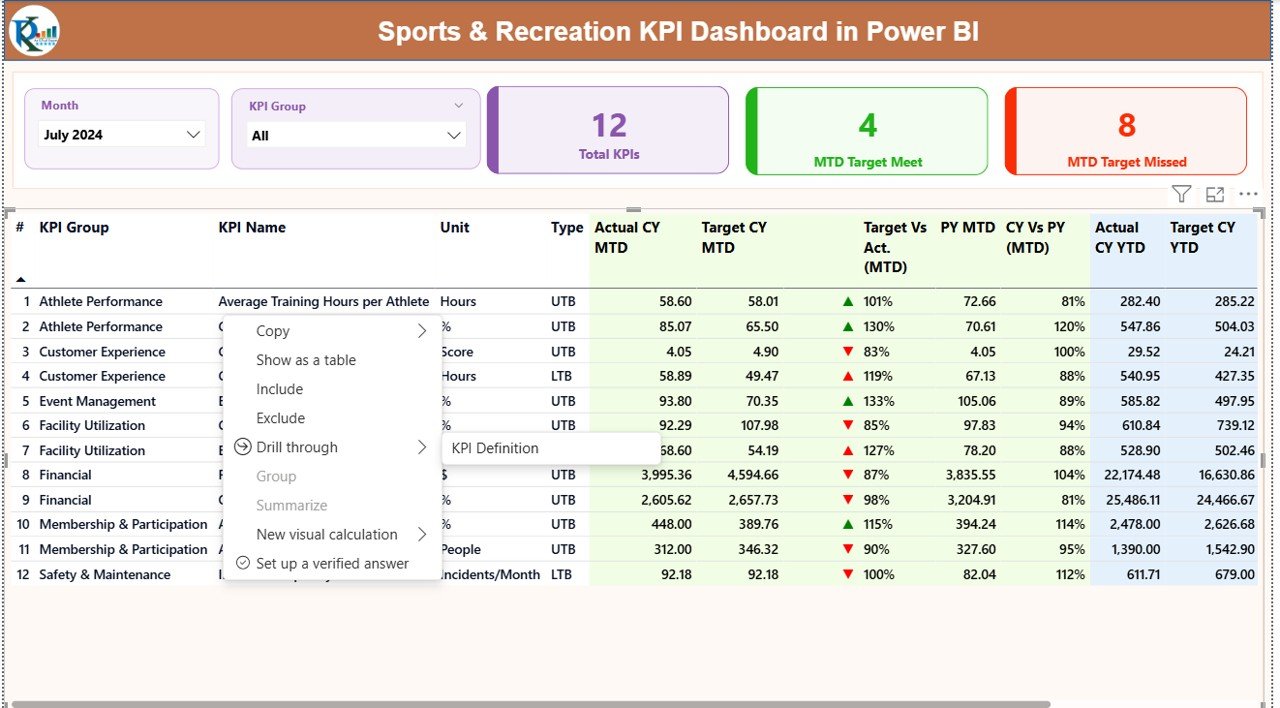
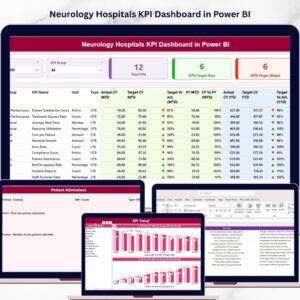
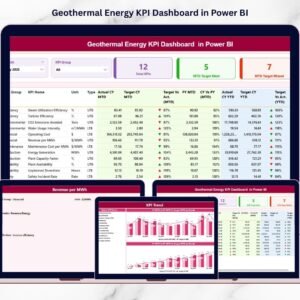
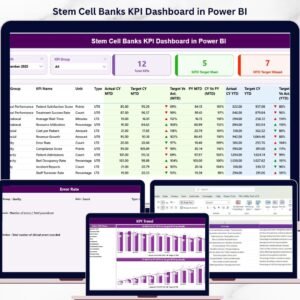
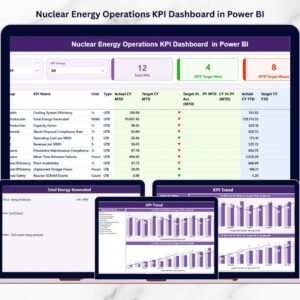
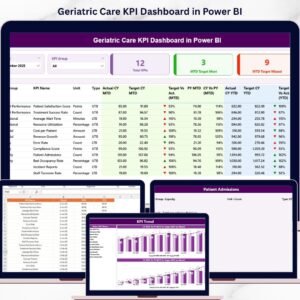
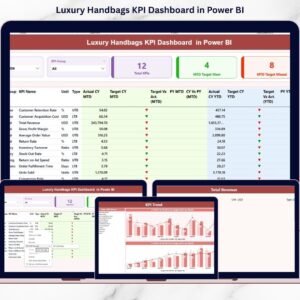
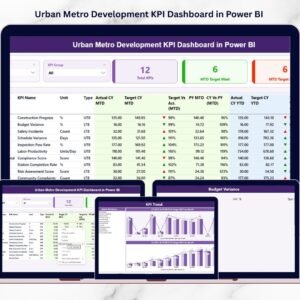
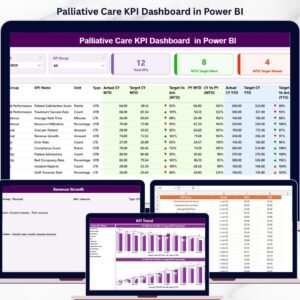
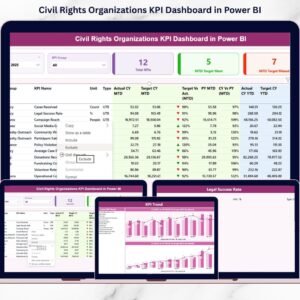
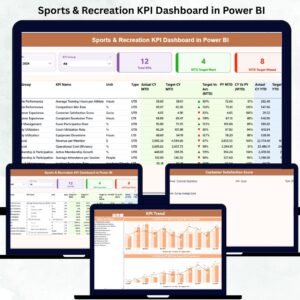
The Summary Page is your main command center. It includes:
Month Slicer & KPI Group Slicer for quick filtering
Performance Cards:
Total KPIs
MTD Target Met
MTD Target Missed
Comprehensive KPI Table showing:
KPI Name, Number, Group & Unit
MTD & YTD Actual vs. Target
Previous Year Values
Percentage Variations
Up/Down Arrow Indicators
This page helps leaders understand overall health at a glance.
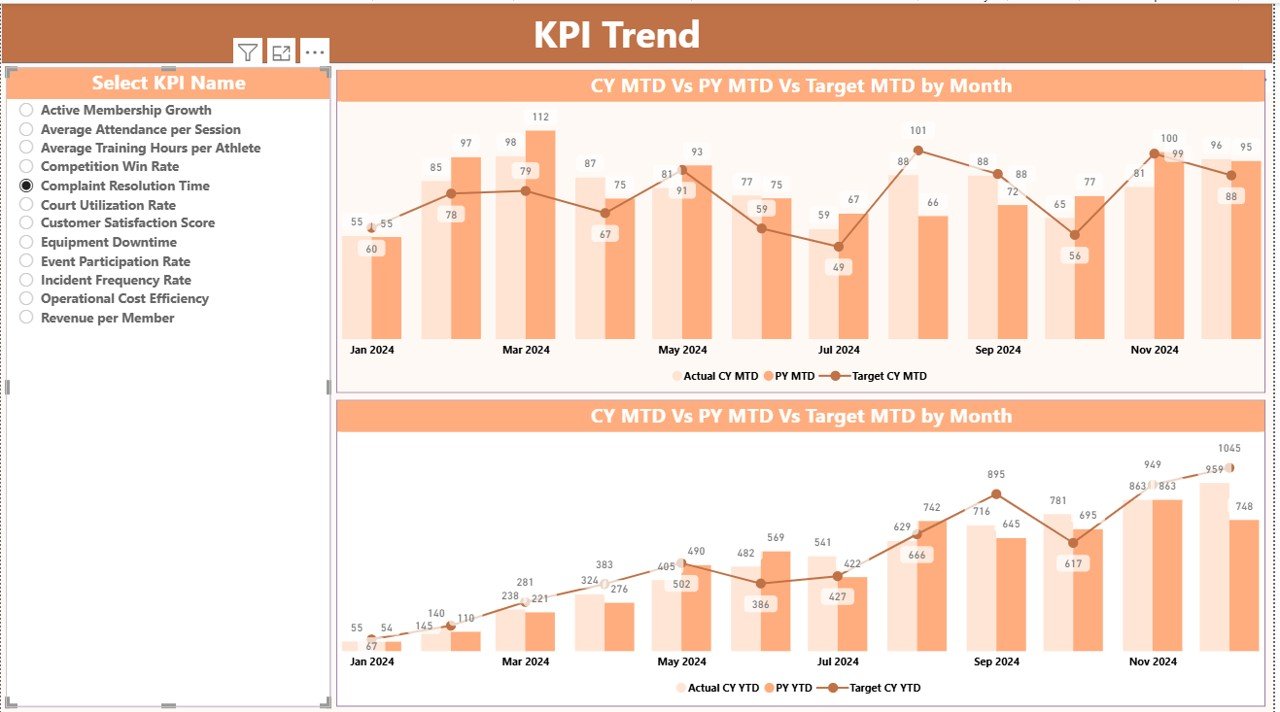
📊 KPI Trend Page – Track Progress Over Time
This page provides combo charts for:
MTD Trend
YTD Trend
Each chart compares:
✔ Current Year Actual
✔ Previous Year Actual
✔ Target Values
You can select any KPI using the slicer and instantly visualize performance direction.
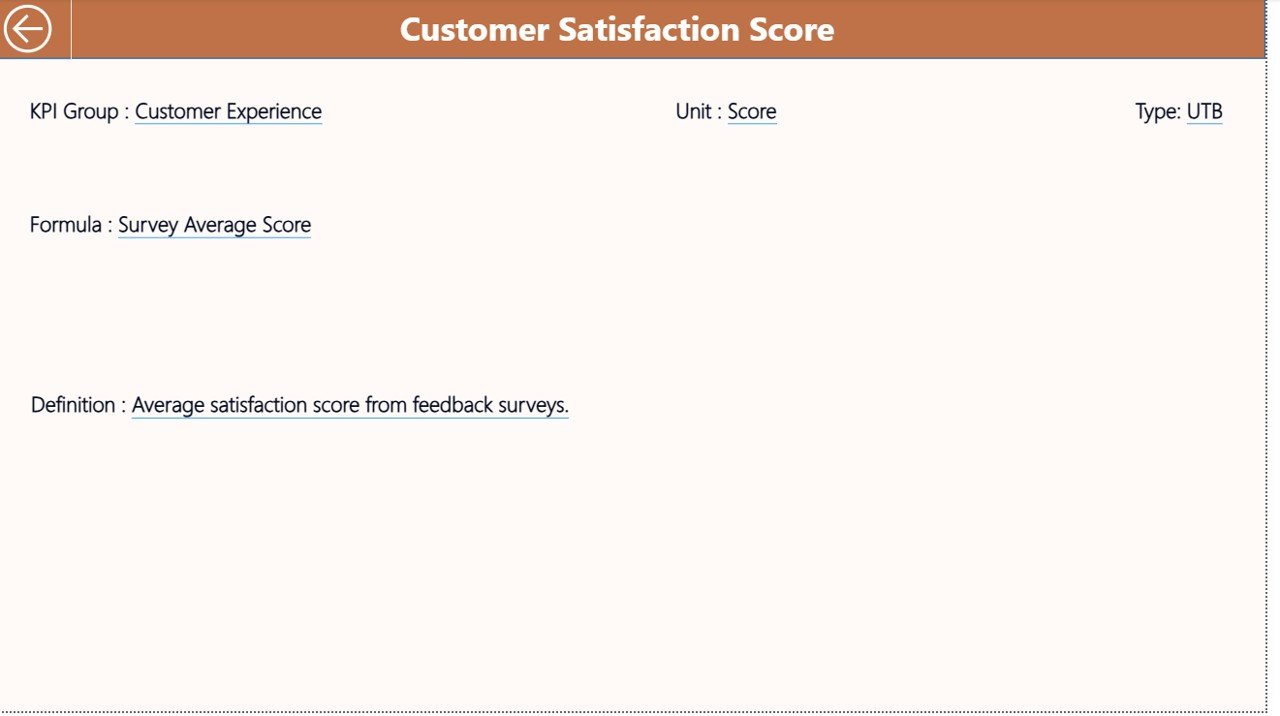
📘 KPI Definition Page – Drill-Down Insight
Right-click any KPI on the Summary Page, and you’ll access:
KPI Name
Formula
Definition
KPI Type (UTB or LTB)
A back button brings you back to the Summary Page easily.
📦 What’s Inside the Sports & Recreation KPI Dashboard in Power BI
This product includes:
Fully built Power BI Dashboard (3 Pages)
Excel Data Source File with three sheets:
Input_Actual → MTD/YTD actuals
Input_Target → Monthly target values
KPI Definition → All KPI metadata
Built-in MTD & YTD Calculations
Conditional Icons (▲ ▼) for instant evaluation
Interactive slicers, filters, and drill-throughs
Clean and simple data structure for easy updates
Everything is ready. You only replace the data, and the visuals refresh automatically.
🛠 How to Use the Sports & Recreation KPI Dashboard in Power BI
Using this dashboard is extremely simple:Sports & Recreation KPI Dashboard in Power BI
Open the Excel File
Enter or update KPI values in Input_Actual and Input_Target sheets
Refresh Power BI
Click “Refresh” and all visuals update instantly
Use Filters & Slicers
Explore data by months and KPI groups
Analyze Trends
Study MTD & YTD charts for improvement areas
Drill Through
Right-click on any KPI for formula and definition
Share Insights
Export reports or share Power BI views across your team
Within minutes, you get full visibility without manual calculations.
👥 Who Can Benefit from This Dashboard
This dashboard is perfect for:
🏅 Sports Directors
Track participation, member growth, program success, and performance trends.
🎽 Coaches & Trainers
Monitor attendance, session engagement, and training-related KPIs.
🏢 Operations Teams
Manage facility usage, peak hours, occupancy rate, and resource allocation.
💼 Finance Department
Track revenue, cost per participant, budget variance, and financial KPIs.
📊 Senior Management
Get a clear, combined view of all KPIs with MTD, YTD, and previous-year comparisons.
Whether you run a community sports center or a large multi-facility organization, this dashboard gives unmatched clarity, saves hours of reporting time, and supports smarter decision-making.

### Click here to read the Detailed blog post
Watch the step-by-step video tutorial:












Reviews
There are no reviews yet.