

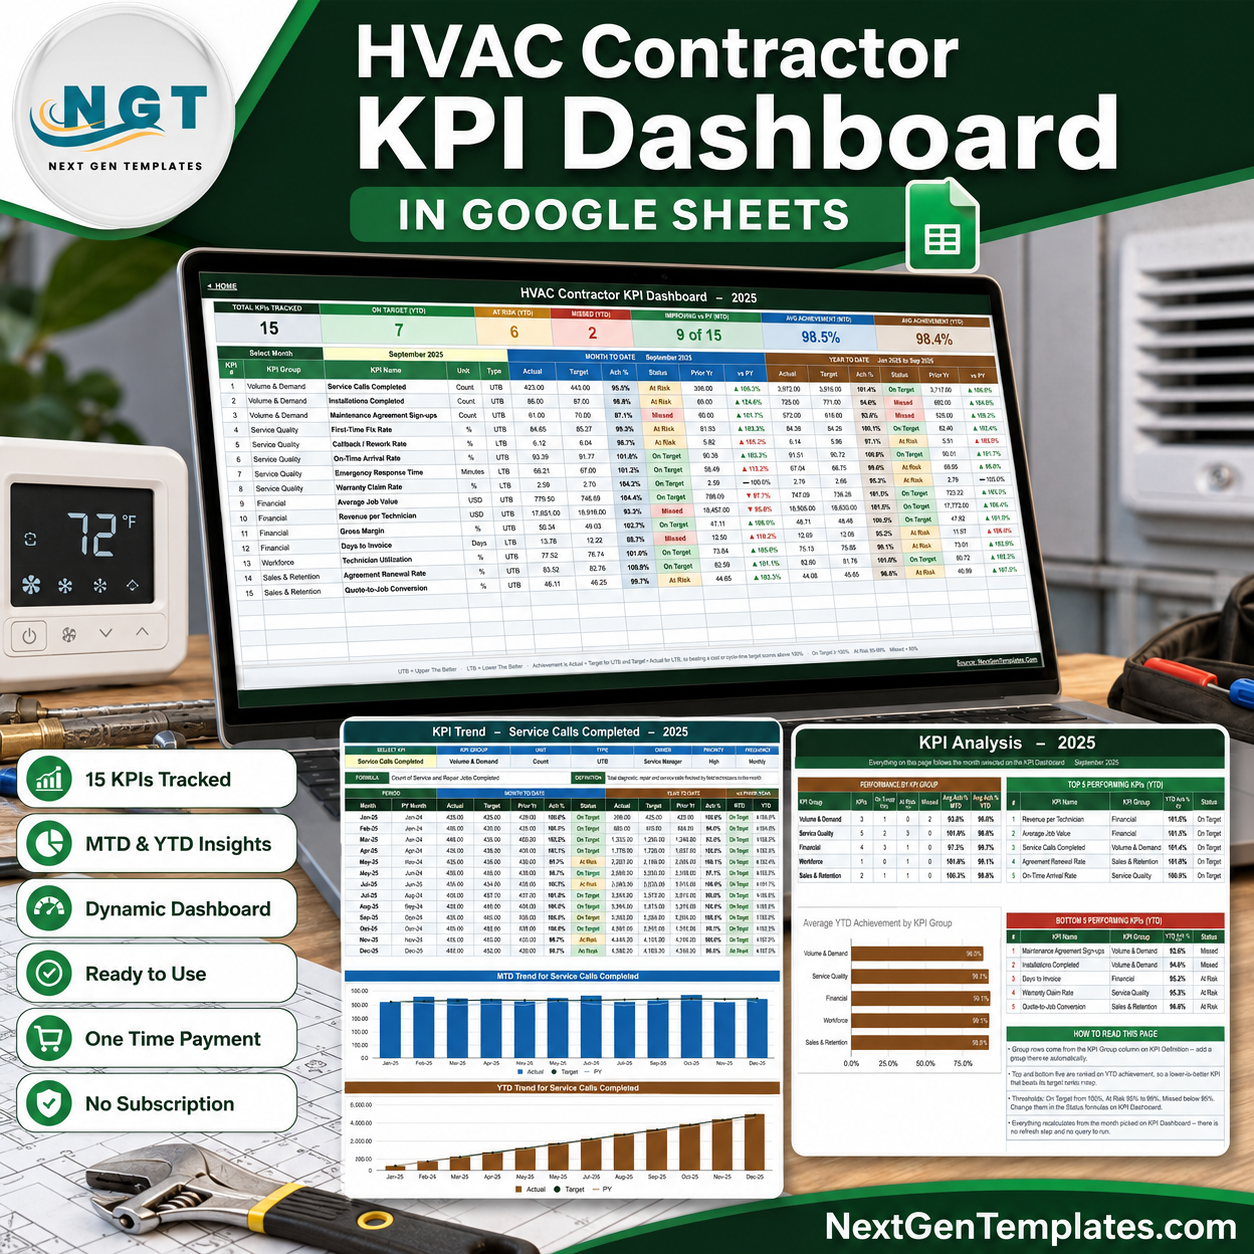
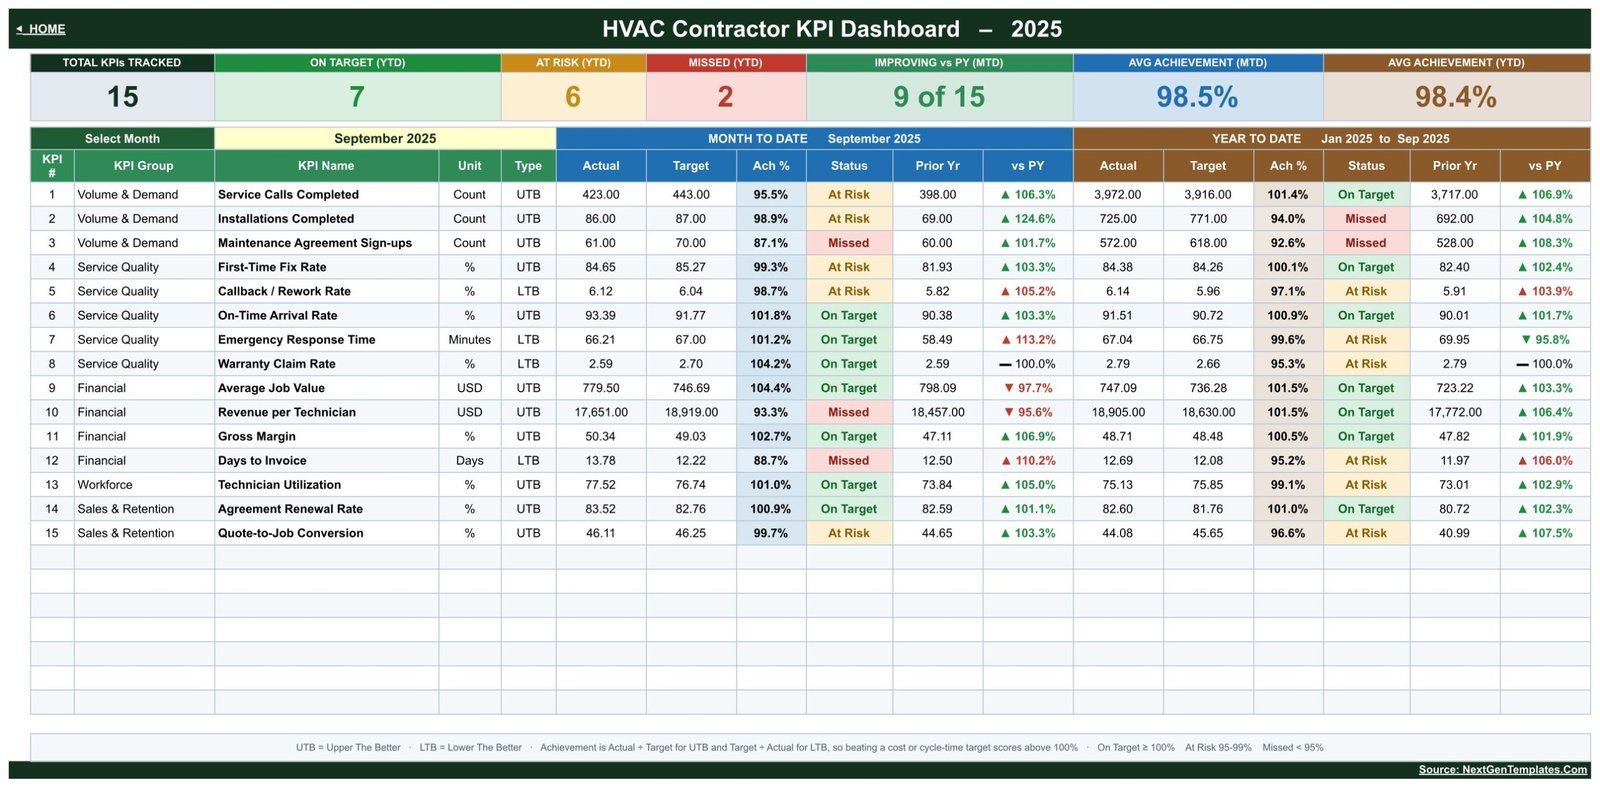
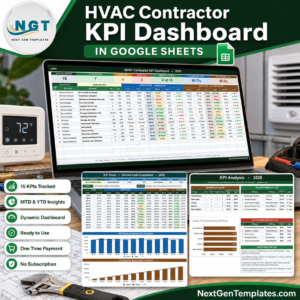
The HVAC Contractor KPI Dashboard in Google Sheets tracks 15 named HVAC KPIs across 5 business groups — Volume & Demand, Service Quality, Financial, Workforce, and Sales & Retention — with MTD and YTD achievement, prior-year comparison and traffic-light status on every single line. Pick a month from one dropdown and the whole workbook re-reads: the scorecard grid, the 12-month trend page and the group roll-up all follow it. Every number is a formula. There is nothing to install, no add-on, no Apps Script to authorise and no query to refresh. One payment, your own copy in your own Google Drive, yours to edit forever. Built and tested by NextGenTemplates before release.
Key Features of the HVAC Contractor KPI Dashboard in Google Sheets
- 15 HVAC KPIs, already written for you — Service Calls Completed, Installations Completed, Maintenance Agreement Sign-ups, First-Time Fix Rate, Callback / Rework Rate, On-Time Arrival Rate, Emergency Response Time, Warranty Claim Rate, Average Job Value, Revenue per Technician, Gross Margin, Days to Invoice, Technician Utilization, Agreement Renewal Rate and Quote-to-Job Conversion.
- One month picker drives everything — the Select Month dropdown on the KPI Dashboard page sets the reporting month for the scorecard, the KPI Analysis roll-up and the year-to-date window.
- MTD and YTD side by side — each KPI row carries Actual, Target, Achievement %, Status, Prior Year and vs PY for the month, then the same six columns again for the year to date.
- Upper-the-better and lower-the-better handled properly — Achievement is Actual ÷ Target for UTB metrics and Target ÷ Actual for LTB metrics, so beating a cost or cycle-time target such as Days to Invoice or Emergency Response Time scores above 100 % instead of looking like a miss.
- Traffic lights with visible thresholds — On Target from 100 %, At Risk 95 % to 99 %, Missed below 95 %. The thresholds live in the Status formulas on the KPI Dashboard sheet, so you can change them.
- Header strip of seven summary tiles — Total KPIs Tracked, On Target (YTD), At Risk (YTD), Missed (YTD), Improving vs PY (MTD), Avg Achievement (MTD) and Avg Achievement (YTD).
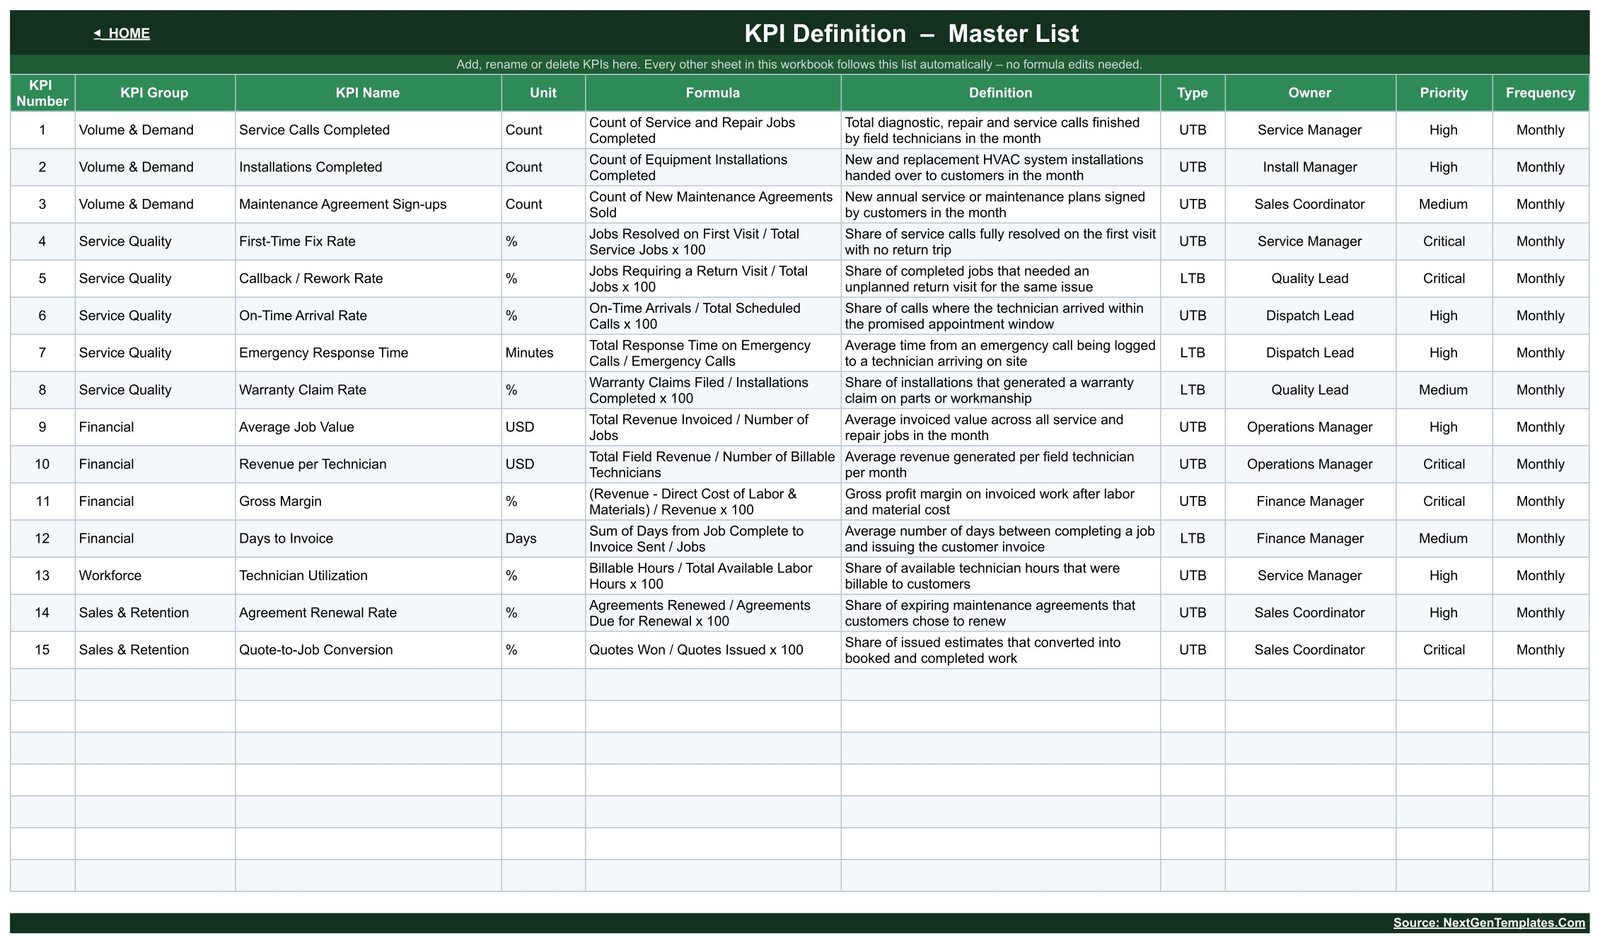
- Add or rename KPIs without touching a formula — the KPI Definition sheet is the master list; every other sheet follows it automatically.
- Formula-driven, zero setup — no add-ons, no macros, no connectors, no refresh step.
What’s Inside the HVAC Contractor KPI Dashboard in Google Sheets
Home — a navigation page with buttons to every sheet, a three-step “enter your data, pick a month, read the scorecard” guide, and the three coverage tiles (15 KPIs, MTD + YTD, 100 % formula-driven).
KPI Dashboard — the scorecard itself. One row per KPI with KPI #, KPI Group, KPI Name, Unit and Type, then the Month-to-Date block and the Year-to-Date block. The sample file opens on September 2025 showing 7 On Target, 6 At Risk and 2 Missed on the year, 9 of 15 improving against prior year, and average achievement of 98.5 % MTD and 98.4 % YTD.
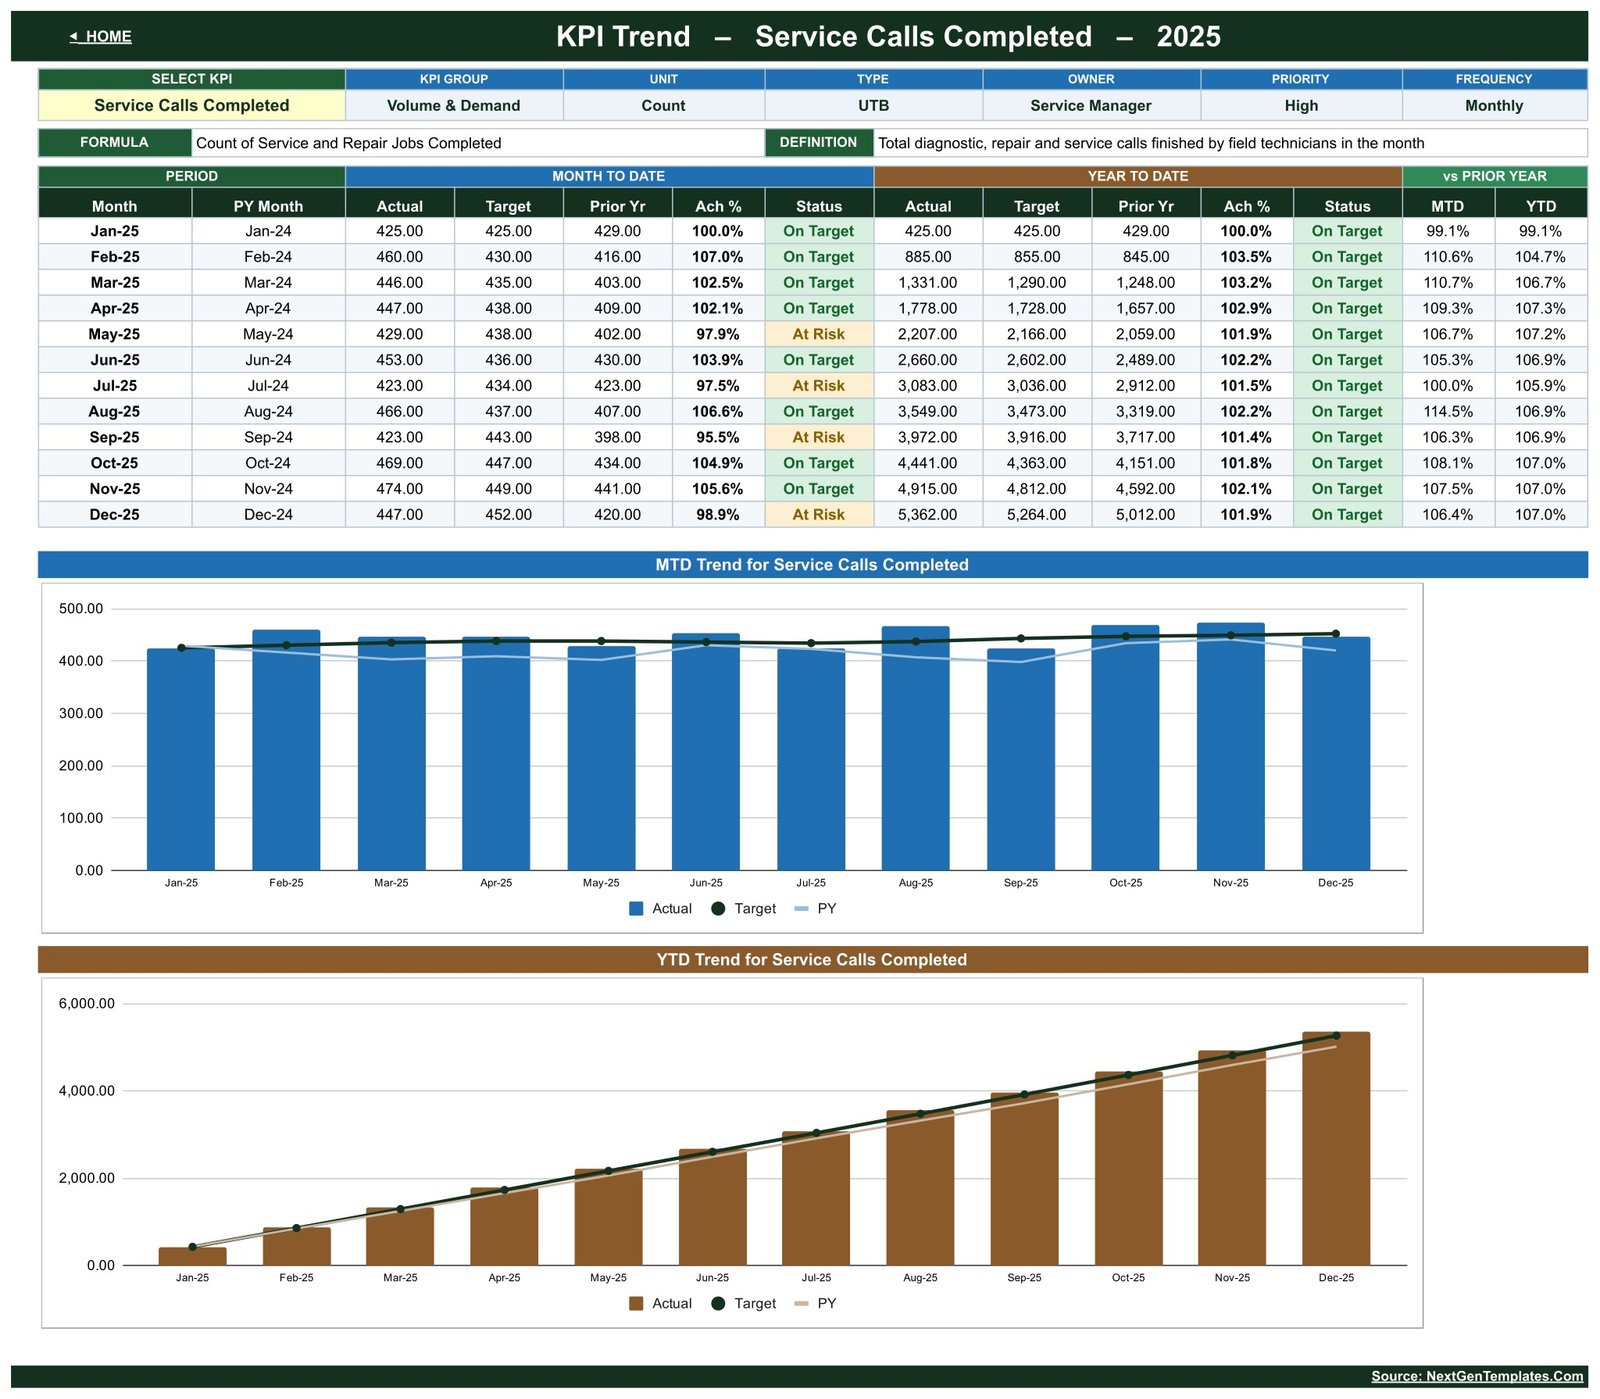
KPI Trend — pick any one KPI from the Select KPI dropdown and the page shows its group, unit, type, owner, priority, frequency, formula and definition, then twelve months of Actual, Target, Prior Yr, Achievement % and Status for both MTD and YTD, plus two charts: MTD Trend for [selected KPI] and YTD Trend for [selected KPI], each plotting Actual against Target and prior year.
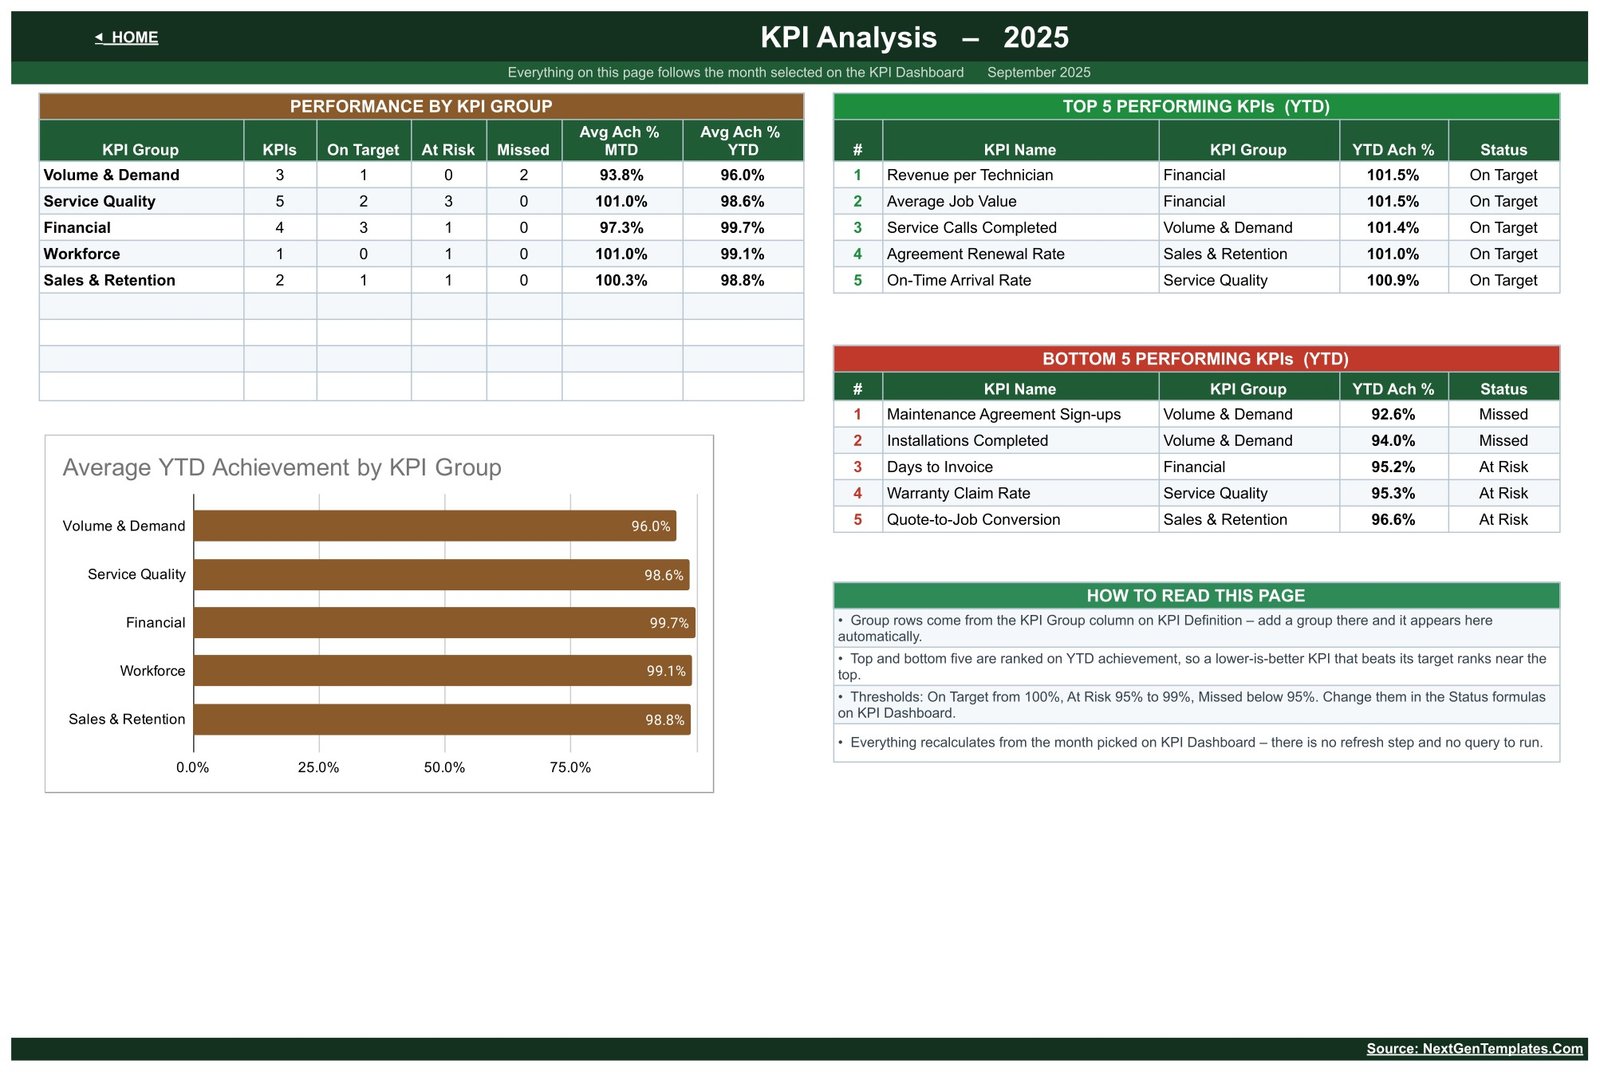
KPI Analysis — Performance by KPI Group (count of KPIs, On Target, At Risk, Missed and average MTD / YTD achievement per group), Top 5 and Bottom 5 Performing KPIs ranked on YTD achievement, an Average YTD Achievement by KPI Group bar chart, and a short “how to read this page” panel.
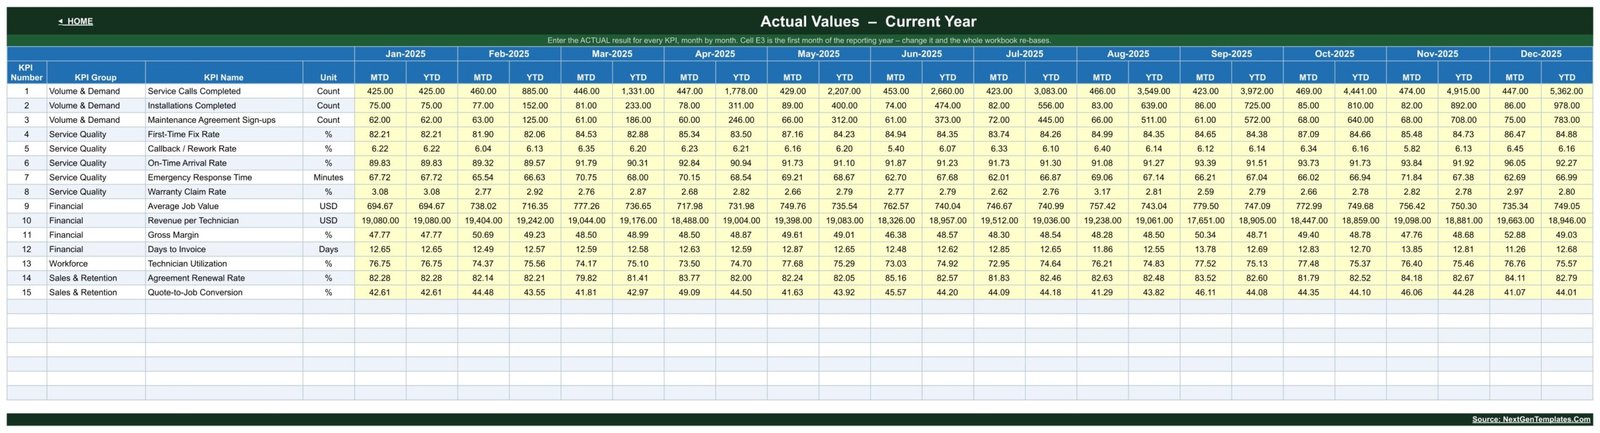
KPI Input – Actual, KPI Input – Target and KPI Input – PY — three matching entry sheets, month by month from January to December, with MTD and YTD columns per month. The yellow cells are the only ones you type in: this year’s result, this year’s target, last year’s result.
KPI Definition — the master list. KPI Number, KPI Group, KPI Name, Unit, Formula, Definition, Type (UTB / LTB), Owner, Priority and Frequency for all 15 KPIs, with owners already assigned to Service Manager, Install Manager, Dispatch Lead, Quality Lead, Operations Manager, Finance Manager and Sales Coordinator.
Read Me and Get More Templates round out the file.
HVAC Contractor KPI Dashboard vs. Excel vs. Paid Field-Service SaaS — Where This Fits
| This template (Google Sheets) | Building it yourself in Excel | Paid field-service SaaS | |
|---|---|---|---|
| Cost | One payment | Free software, days of your time | Per-technician monthly fee |
| Platform | Google Sheets, any browser | Desktop Excel | Vendor cloud |
| Setup time | Make a copy, type your numbers | Build every formula and chart | Onboarding and data migration |
| Real-time team collaboration | Yes, native Google Sheets sharing | Only via OneDrive co-authoring | Yes |
| Mobile access | Google Sheets mobile app | Excel mobile app | Vendor app |
| Customisable KPIs and fields | Yes — edit the KPI Definition sheet | Yes, if you write the formulas | Usually a fixed metric set |
| Share with a link | Yes | No | Seat-based |
| Year-1 cost at 5 users | The purchase price, once | Your build time | Recurring, multiplied by seats |
| Dispatching and job scheduling | No — this is reporting only | No | Yes |
| Prior-year comparison built in | Yes, MTD and YTD | Only if you build it | Varies |
Who This Template Is For — and Who It’s Not For
It is for owner-operators and general managers of residential or light-commercial HVAC firms who already have the numbers in a service system, an invoice ledger or a notebook and want one monthly page that says whether the business is on target; service managers who report to an owner or a board every month; and multi-branch contractors who want each branch reporting the same 15 KPIs on the same definitions.
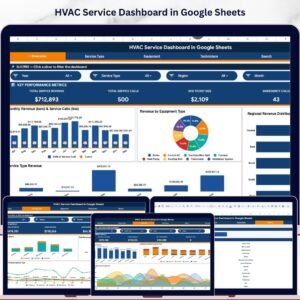
It is not for you if you want the sheet to pull data automatically. It does not connect to ServiceTitan, Housecall Pro, Jobber, QuickBooks or any dispatch system, and it does not import anything — you enter monthly figures by hand on the three input sheets. It is not a dispatch board, a job-costing engine, a scheduling calendar or an invoicing tool. It does not send alerts or notifications. And if you need daily or per-job granularity rather than monthly KPIs, an operational dashboard suits you better than a scorecard — see the HVAC Service Dashboard in Google Sheets.
How to Use the HVAC Contractor KPI Dashboard in Google Sheets
- Open the PDF in your download and click the link inside it, then choose File > Make a copy to put an editable copy in your own Google Drive.
- Open KPI Definition and adjust the 15 KPIs to your business — rename, re-group, change an owner or a formula description, or delete the ones you do not measure. Every other sheet follows this list.
- Set the first month of your reporting year in cell E3 on KPI Input – Actual; the whole workbook re-bases to it.
- Type your monthly figures into the yellow cells on KPI Input – Actual, KPI Input – Target and KPI Input – PY.
- Go to KPI Dashboard, pick your month from the Select Month dropdown, and read the scorecard. Adjust the 100 % / 95 % thresholds in the Status formulas if your business uses different bands.
- Use KPI Trend for the one-KPI deep dive and KPI Analysis for the group roll-up and the top and bottom five.
Real-World Use Cases
Dave, owner of a 9-technician residential HVAC company. Every month he types the previous month’s figures into the three input sheets and pulls up the KPI Dashboard. In the sample month, Callback / Rework Rate is at 98.7 % achievement and flagged At Risk — that is the conversation he has with his quality lead, instead of a general feeling that “we’ve had a few come-backs”.
Priya, service manager for a light-commercial contractor. She sends the board a monthly pack. The KPI Analysis page gives her the whole story on one screen: Volume & Demand at 96.0 % average YTD achievement with two Missed KPIs, Financial at 99.7 %, and the bottom five ranked so the discussion starts with Maintenance Agreement Sign-ups rather than wandering.
Marco, operations lead across three branches. Each branch keeps its own copy on the same 15 KPI definitions, so “First-Time Fix Rate” means the same thing everywhere and the numbers are comparable side by side.
Frequently Asked Questions
Is this the KPI Dashboard or the KPI Scorecard? They have similar names.
This listing is the KPI Dashboard. It is the month-picker, traffic-light build: a full scorecard grid with a row per KPI and MTD and YTD blocks side by side, plus a dedicated KPI Trend page and a KPI Analysis page, fed by three separate input sheets for Actual, Target and Prior Year. The HVAC Contractor KPI Scorecard in Google Sheets is a different NextGenTemplates template from the KPI Scorecard family — a KPI-card layout with RAG status lights, a comparison-switch dropdown and a single monthly data sheet. Same industry, different structure. Buy whichever layout you prefer; they are not versions of each other.
Does it connect to ServiceTitan, Housecall Pro, Jobber or QuickBooks?
No. There is no integration, no import and no sync of any kind. You type the monthly figures into the three input sheets yourself. That is deliberate — it means the file works no matter which system you run.
Can I change the 15 KPIs?
Yes. The KPI Definition sheet is the master list, and every other sheet reads from it. Rename a KPI, change its group, unit, type, owner or priority, or delete one you do not track, and the scorecard, the trend page and the analysis page follow automatically.
Do I need Excel or any add-on?
No. It is a plain Google Sheets file. No add-ons, no macros, no Apps Script authorisation, no external data connections.
What are the sample numbers in the file?
Demonstration data for a 2025 reporting year, so you can see how every page behaves before you clear it. Replace it with your own figures.
Can my whole team use it?
Yes. It is a normal Google Sheets file, so you share it from your own Drive with as many people as you like at no extra cost. There are no per-user fees.
Will it tell me my business is performing well?
It shows you your own numbers against your own targets and your own prior year. The status colours reflect the thresholds you set, not an industry benchmark — the template ships no benchmark data and makes no claim about what good looks like in your market.
About the Author
Built by PK – Microsoft Certified Professional with 15+ years of Excel, Google Sheets, and Power BI experience. Founder of NextGenTemplates, reaching 300K+ subscribers across YouTube channels. Every template is hand-built and tested before release.
Explore Related Templates
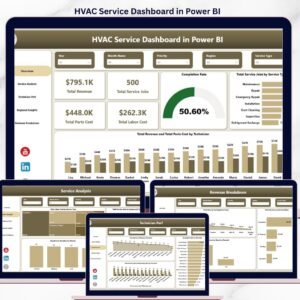
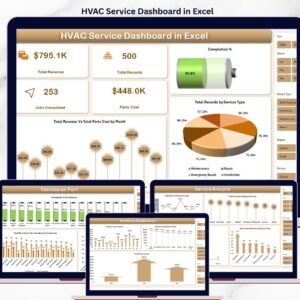
- HVAC Service Dashboard in Google Sheets — the analytical companion: operational charts and breakdowns rather than a monthly KPI scorecard.
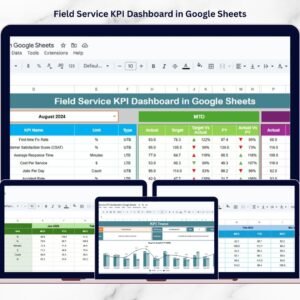
- Field Service KPI Dashboard in Google Sheets — the same scorecard idea for field-service operations generally.
- Plumbing Contractor Dashboard in Google Sheets — for firms running both trades.
- Maintenance Tasks Calendar in Google Sheets — schedule the planned-maintenance visits behind the agreement KPIs.
- Equipment Maintenance Management System Web App — when you outgrow a spreadsheet.
- Browse the full Google Sheets KPI Dashboard category or every Google Sheets template.
Get the HVAC Contractor KPI Dashboard in Google Sheets now — one payment, your own copy in your own Drive, edit it forever. Read the full walkthrough on NeoTechNavigators.
Watch the step-by-step video Demo:
Last updated: 23 August 2026.






















Reviews
There are no reviews yet.