

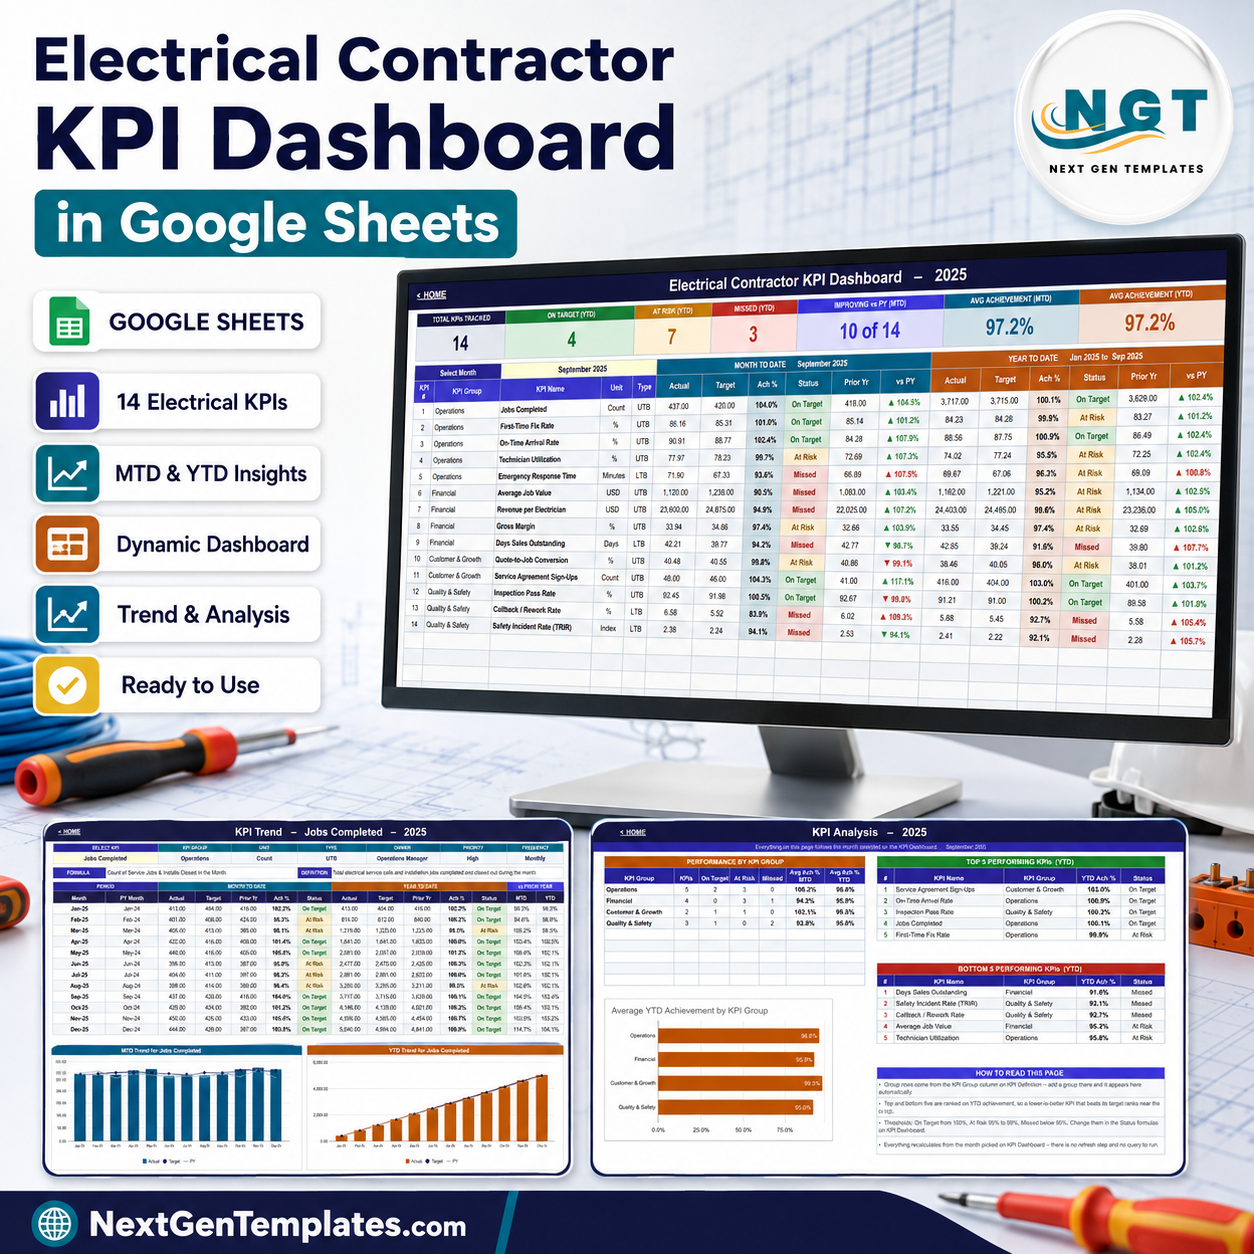

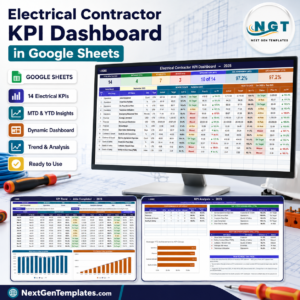
The Electrical Contractor KPI Dashboard in Google Sheets puts 14 electrical contracting KPIs on one traffic-light scorecard, with Month-to-Date and Year-to-Date side by side and a prior-year column next to both. Pick a month from a single dropdown and the entire workbook re-reads from it: the seven header cards, the 14-row grid, the KPI Trend page and the KPI Analysis page. It is formula-driven end to end, so there are no add-ons to install, no macros to enable and no query to refresh. One payment, unlimited use, and the download is a PDF that carries the Google Sheets copy link, so you are working inside your own copy about two minutes after checkout.
Key Features of the Electrical Contractor KPI Dashboard in Google Sheets
- 14 electrical contracting KPIs across four groups: Operations (5), Financial (4), Customer & Growth (2) and Quality & Safety (3).
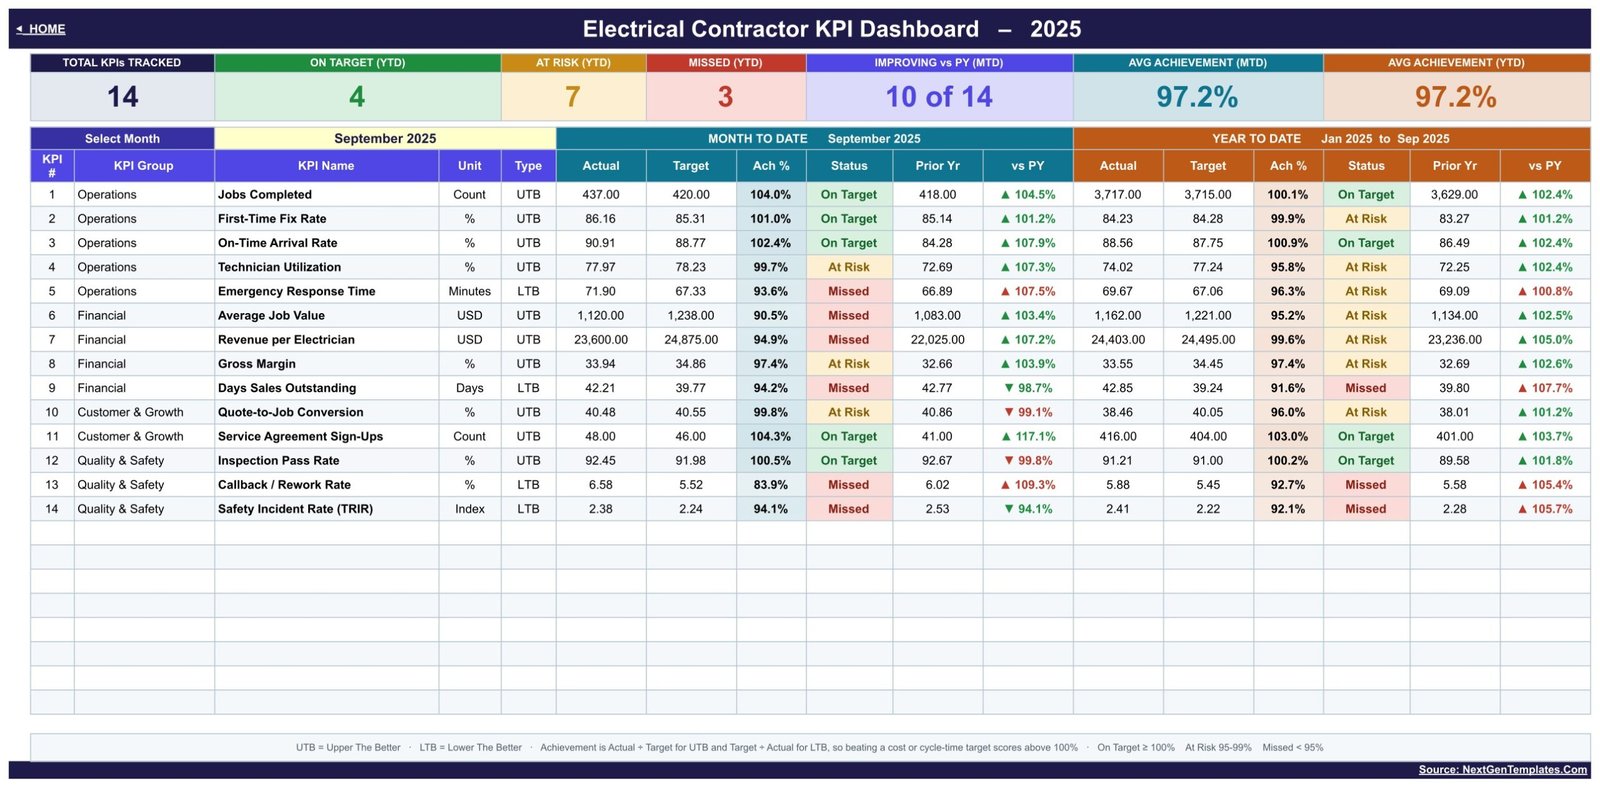
- One month dropdown on the KPI Dashboard sheet drives every page. Selecting September 2025 sets the MTD column to September and the YTD range to Jan 2025 to Sep 2025.
- MTD and YTD blocks side by side, each with Actual, Target, Achievement %, Status, Prior Yr and vs PY, so a good month inside a weak year has nowhere to hide.
- Upper-the-better and lower-the-better logic. Achievement is Actual ÷ Target for UTB KPIs and Target ÷ Actual for LTB KPIs, so beating a cost or cycle-time target scores above 100%. Emergency Response Time, Days Sales Outstanding, Callback / Rework Rate and Safety Incident Rate (TRIR) are all typed LTB.
- Traffic-light status with editable thresholds: On Target from 100%, At Risk 95% to 99%, Missed below 95%.
- Seven summary cards at the top: Total KPIs Tracked, On Target (YTD), At Risk (YTD), Missed (YTD), Improving vs PY (MTD), Avg Achievement (MTD) and Avg Achievement (YTD).
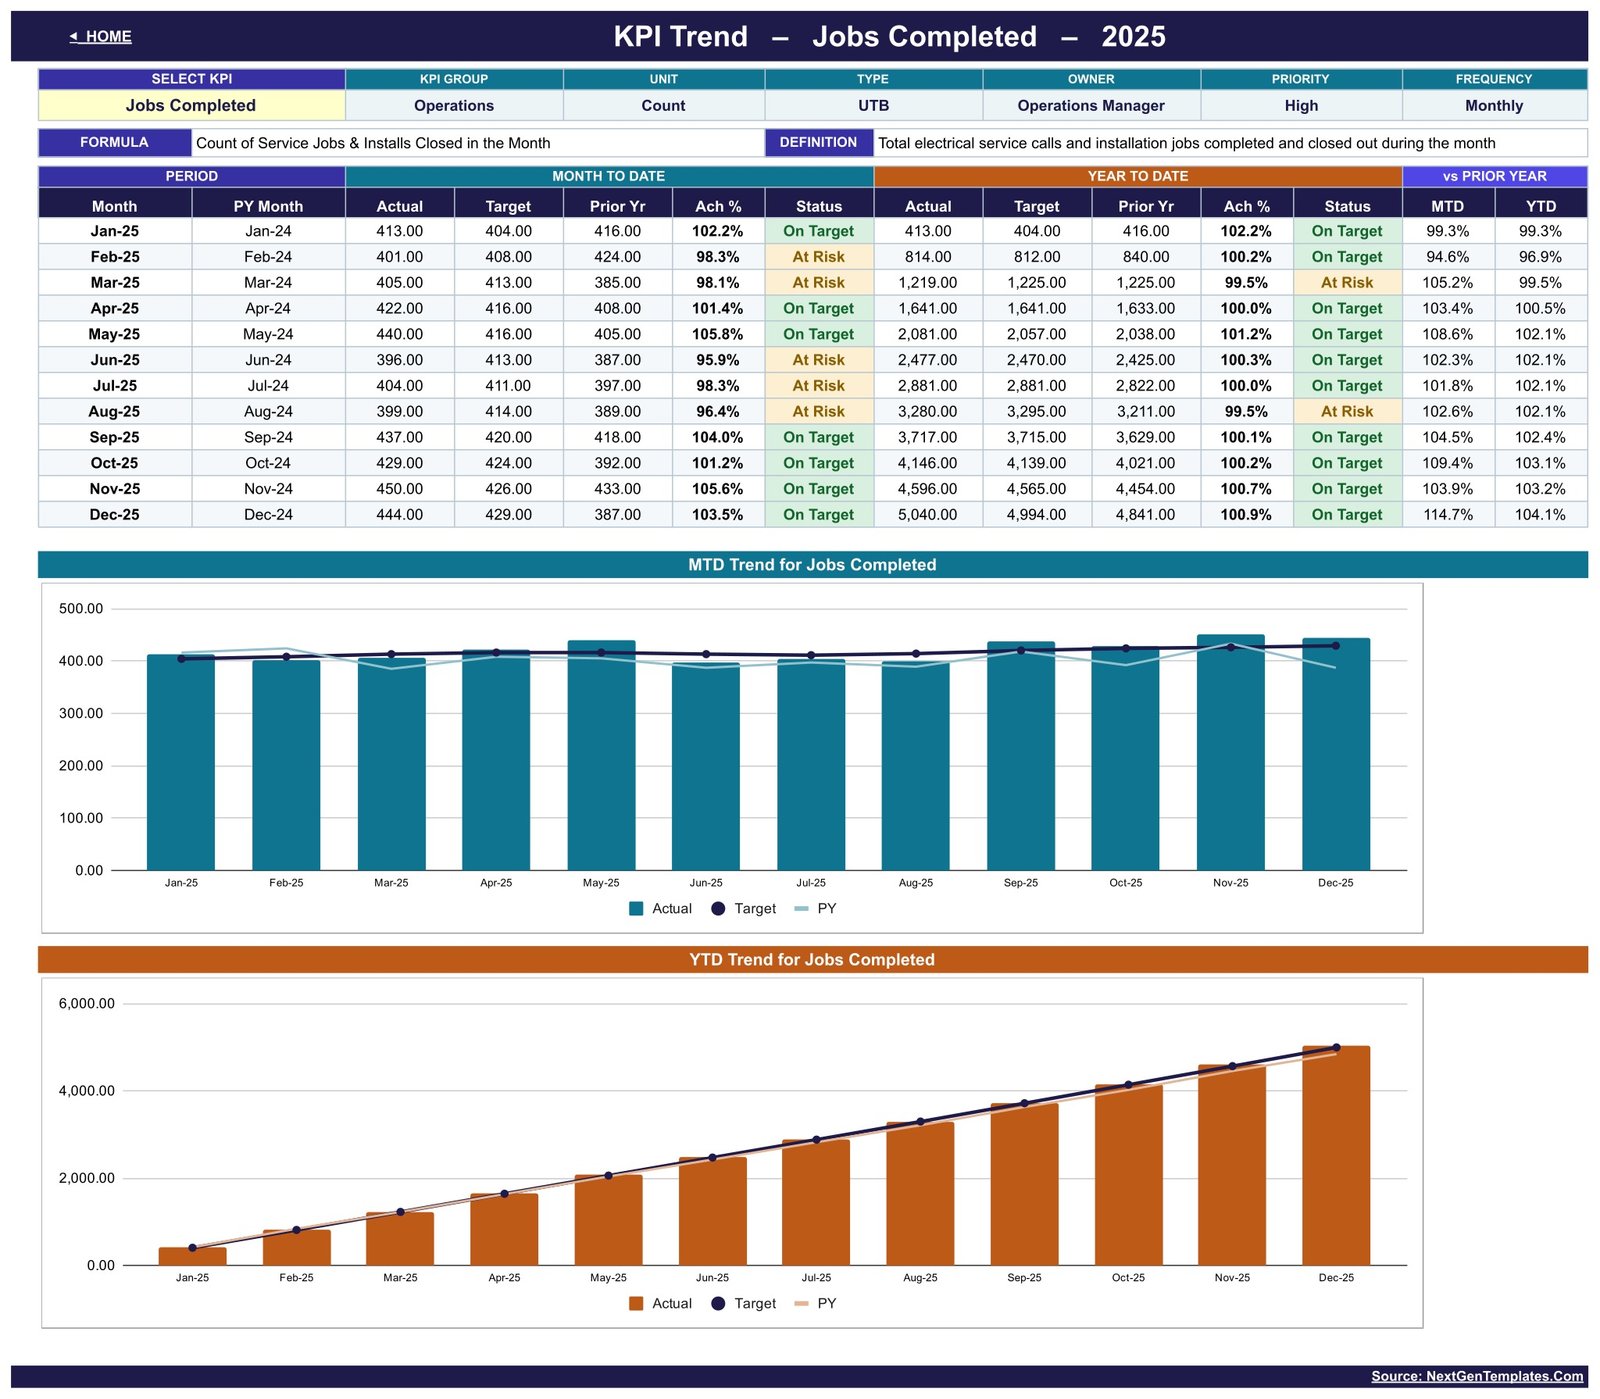
- KPI Trend page – choose any one KPI and see twelve months of MTD and YTD figures plus two charts.
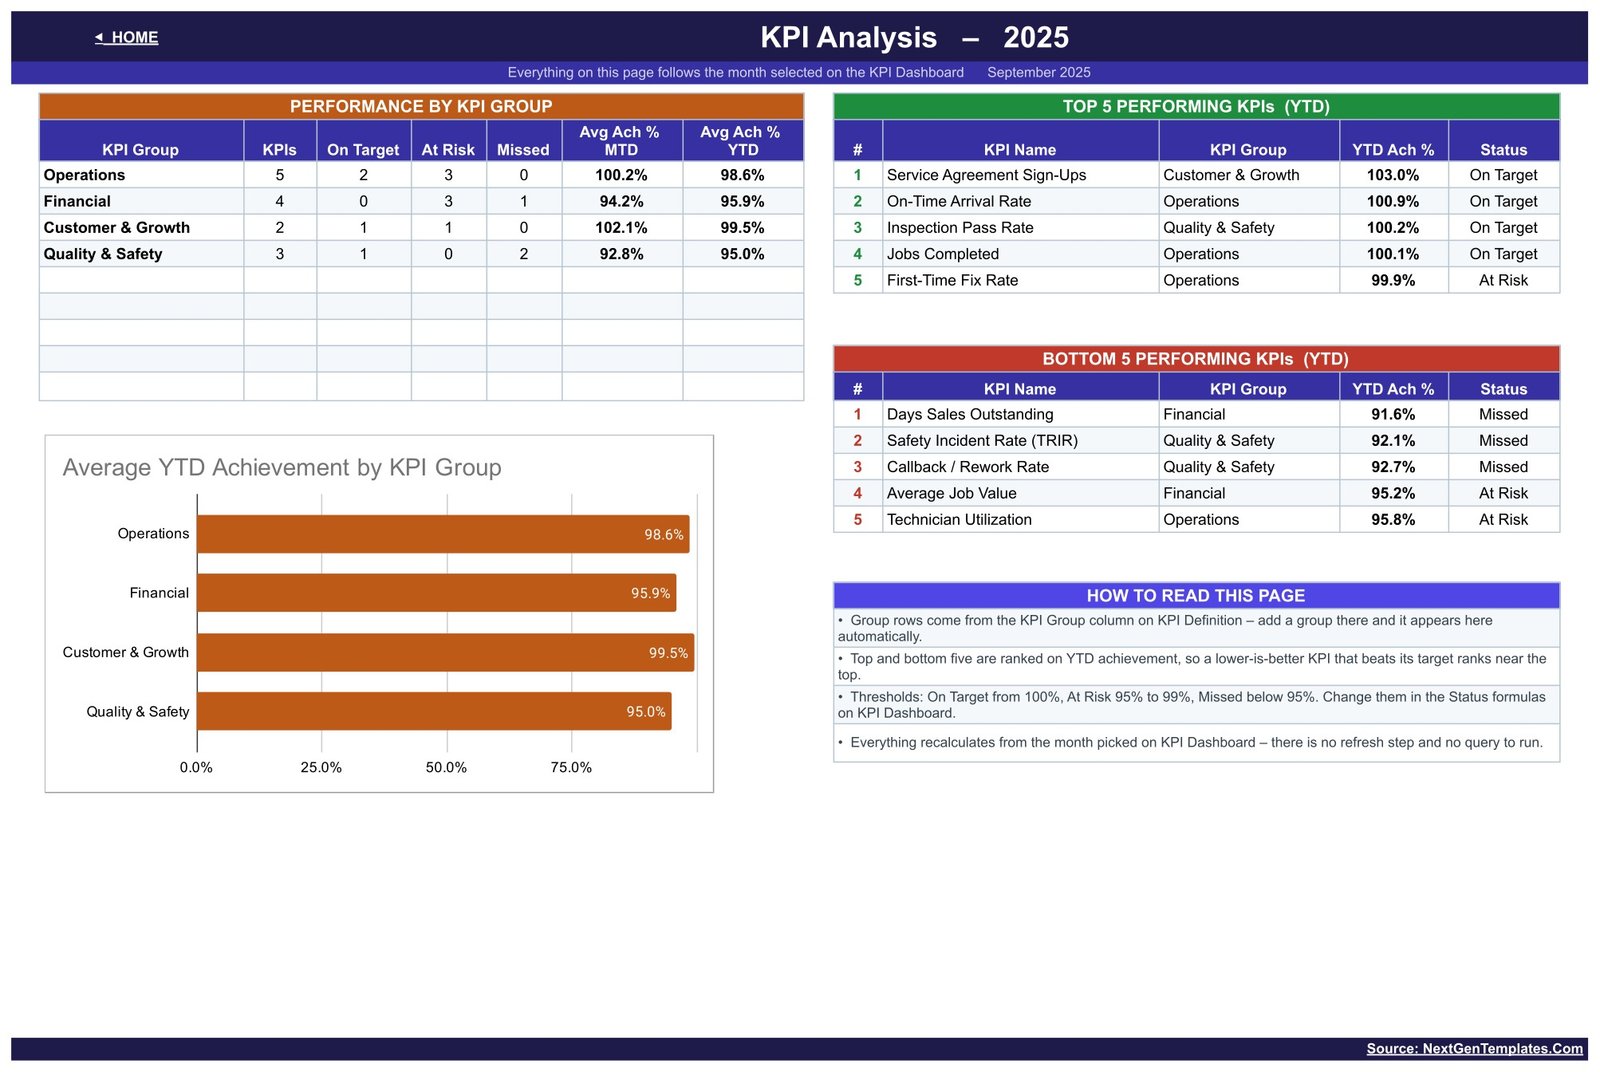
- KPI Analysis page – group roll-up, an Average YTD Achievement by KPI Group bar chart, and Top 5 / Bottom 5 Performing KPIs on YTD achievement.
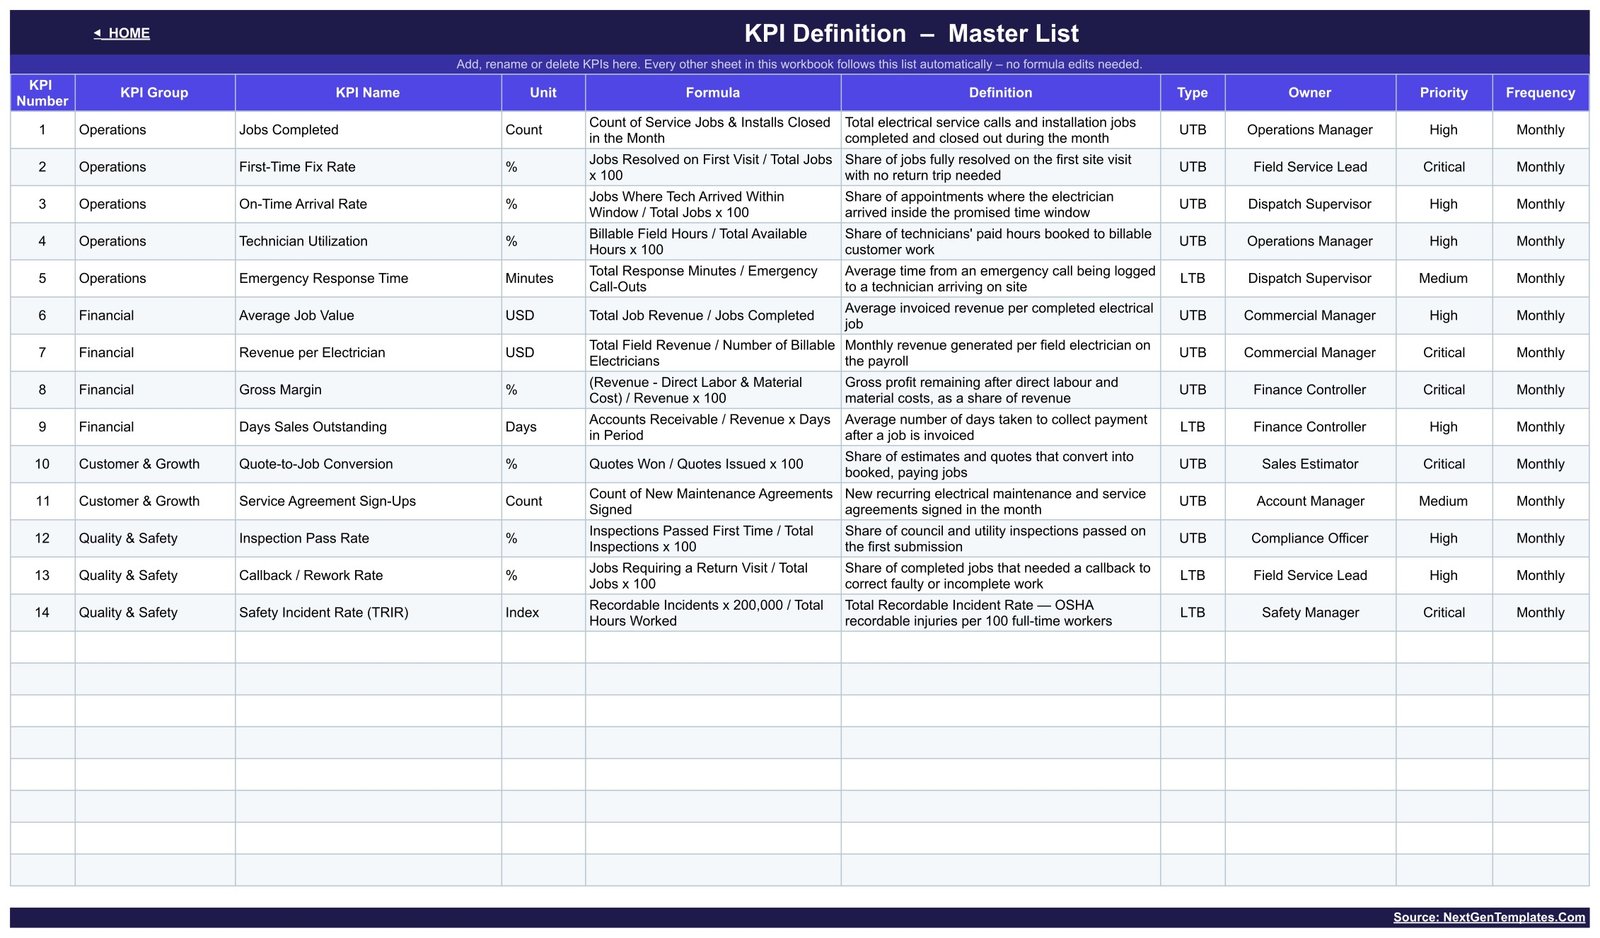
- Editable KPI Definition master list – rename, re-group or add a KPI there and every other sheet follows automatically. No formula edits.
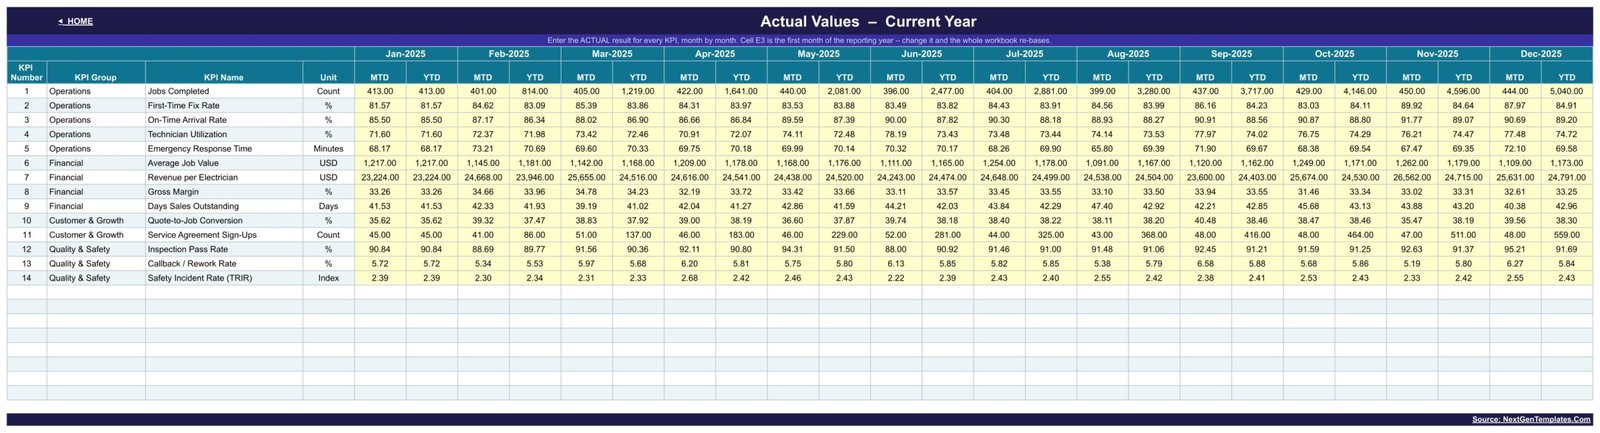
- Three plain input sheets – this year’s actual, this year’s target and last year’s result, month by month, in clearly marked yellow cells.
What’s Inside the Electrical Contractor KPI Dashboard in Google Sheets
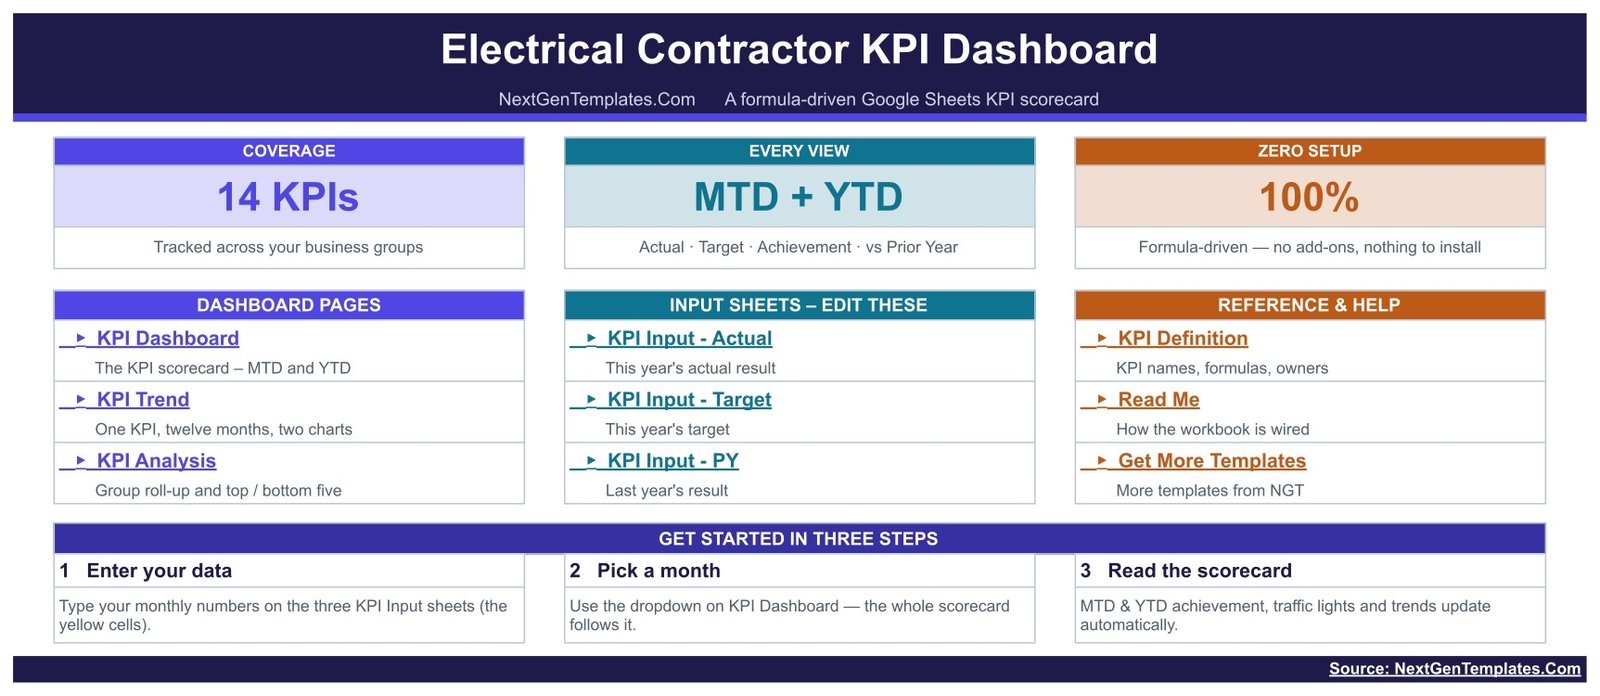
Home. A navigation page with links to every sheet, grouped into Dashboard Pages, Input Sheets – Edit These, and Reference & Help, plus a three-step start guide.
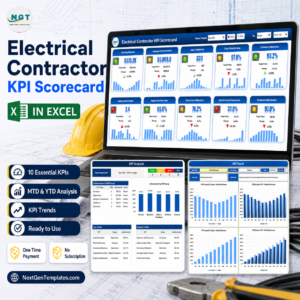
KPI Dashboard. The scorecard. Header cards, the month picker, and a 14-row grid: KPI #, KPI Group, KPI Name, Unit, Type, then the MTD block and the YTD block. The sample month shows 4 On Target, 7 At Risk and 3 Missed on YTD, with average achievement at 97.2%.
KPI Trend. Pick a KPI from the dropdown and the page rebuilds: group, unit, type, owner, priority, frequency, formula and definition across the top, then twelve rows of Month, PY Month, MTD Actual / Target / Prior Yr / Ach % / Status, the same six YTD columns, and vs Prior Year for both. Below sit two charts – MTD Trend for [KPI] and YTD Trend for [KPI] – each plotting Actual as columns against Target and PY as lines.
KPI Analysis. Performance by KPI Group counts KPIs, On Target, At Risk and Missed per group and averages MTD and YTD achievement. Beside it, Top 5 and Bottom 5 Performing KPIs (YTD) rank every KPI with its group, YTD achievement and status. A How To Read This Page box explains the ranking and the thresholds.
KPI Input – Actual, KPI Input – Target, KPI Input – PY. Three identical grids, one row per KPI and two columns per month (MTD and YTD). Cell E3 sets the first month of the reporting year – change it and the whole workbook re-bases.
KPI Definition. The master list: KPI Number, KPI Group, KPI Name, Unit, Formula, Definition, Type, Owner, Priority and Frequency for all 14 KPIs – from Jobs Completed (Operations Manager, High) to Safety Incident Rate (TRIR) (Safety Manager, Critical).
Electrical Contractor KPI Dashboard vs. Excel vs. Paid Field-Service SaaS – Where This Fits
| This template (Google Sheets) | Excel KPI dashboard | ServiceTitan / Housecall Pro | |
|---|---|---|---|
| Cost | One payment, $8.99 on sale | One payment, typically $12.99-$19.99 | $99-$400+ per user per month |
| Platform | Google Sheets, browser-based | Desktop Excel | Vendor cloud platform |
| Setup time | Copy the sheet, type your numbers – about 20 minutes | Download, open, type your numbers | Weeks: onboarding, data migration, training |
| Real-time team collaboration | Yes, native multi-user editing | Only via OneDrive co-authoring | Yes |
| Mobile access | Yes, Google Sheets app | Limited | Yes, dedicated apps |
| Customisable KPIs | Yes – edit the KPI Definition sheet, everything follows | Yes, with formula edits | Only what the vendor exposes |
| Share with a link | Yes | No | Seat-based access only |
| Year-1 cost at 5 users | $8.99 | $12.99-$19.99 | $6,000-$24,000 |
| Lower-the-better KPI scoring | Built in (TRIR, DSO, callbacks, response time) | Built in | Varies; often needs custom reports |
| Prior-year comparison | Built in on MTD and YTD | Built in | Usually a paid analytics add-on |
Who This Template Is For – and Who It’s Not For
It is for owner-operated and mid-sized electrical contracting firms running anywhere from 3 to 60 electricians; operations managers who already have the numbers in a job-management system but no monthly scorecard; finance controllers who want gross margin, average job value and DSO reviewed next to first-time fix and callback rate rather than in a separate finance pack; and anyone preparing a monthly board or partner review.
It is not for live dispatch or scheduling – it holds monthly totals, not individual jobs, and it will not tell you where a van is right now. It is not a job-costing system: there is no per-job P&L. It does not connect to QuickBooks, Xero or a field-service platform; you type or paste twelve monthly figures per KPI. And if you need per-technician league tables rather than firm-level KPIs, this is the wrong shape – it tracks 14 company KPIs, not individual scorecards.
How to Use the Electrical Contractor KPI Dashboard in Google Sheets
- Open the PDF in your download and click the copy link, then choose File > Make a copy to put an editable copy in your own Google Drive.
- Open KPI Definition and adjust the 14 KPIs to your firm – rename, re-group, change owner or priority. Every other sheet follows.
- Set cell E3 on the input sheets to the first month of your reporting year.
- Type last year’s twelve monthly figures into KPI Input – PY, this year’s targets into KPI Input – Target, and this year’s results into KPI Input – Actual as each month closes.
- Go to KPI Dashboard and pick the month. Read the status column: Missed and At Risk rows are your agenda.
- Open KPI Trend for anything that moved, to see whether it is a one-month blip or a twelve-month slide.
- Finish on KPI Analysis – the Bottom 5 list is the shortest honest summary of where the month went wrong.
Real-World Use Cases
Dave, owner of a 12-electrician commercial firm. He reviews the scorecard on the first Monday of the month. Technician Utilization at 95.8% YTD and Average Job Value at 95.2% both sat in At Risk while Jobs Completed stayed On Target – the crew was busy on smaller work. He shifted two estimators onto larger commercial quotes rather than hiring.
Priya, operations manager for a residential service business. She uses Callback / Rework Rate and First-Time Fix Rate together. When callbacks ran above target three months running, the KPI Trend page showed the slide starting the month a new hire came off supervision, which turned a vague complaint into a specific training decision.
Marcus, finance controller. Days Sales Outstanding is the KPI he owns. On the sample data it is the worst performer at 91.6% YTD, and because it is typed lower-the-better, a rising DSO scores down rather than up. He takes the Bottom 5 list straight into the partners’ meeting.
Frequently Asked Questions
Is this the same as the Electrical Contractor KPI Scorecard in Google Sheets?
No. This is the KPI Dashboard build: a month picker, seven header cards, a 14-row MTD/YTD grid with prior-year columns, a KPI Trend page and a KPI Analysis page. The Electrical Contractor KPI Scorecard in Google Sheets is a different, simpler single-page template. Buy this one if you want the trend and group-analysis pages.
Do I need any add-on, macro or script?
No. Every figure on every page comes from a spreadsheet formula. There is nothing to install, nothing to authorise and no refresh step.
Can I change the KPIs to match my business?
Yes. The KPI Definition sheet is the master list – rename a KPI, move it to another group, change its unit, or switch it between UTB and LTB, and the dashboard, trend and analysis pages all follow. You can add groups too; the Performance by KPI Group table picks them up automatically.
Can I change the traffic-light thresholds?
Yes. On Target from 100%, At Risk 95% to 99% and Missed below 95% are set in the Status formulas on the KPI Dashboard sheet, and you can edit them to whatever your firm has agreed.
What exactly do I download?
A PDF. It contains the “Make a copy” link to the live Google Sheets template plus a walkthrough of every page. There is no .xlsx or .zip – the working file lives in Google Drive, in your own account.
Does it connect to my job-management or accounting software?
No. It is a manual-entry scorecard: twelve monthly figures per KPI on three input sheets. Most firms export those totals once a month from whatever system they already run.
Can my team see it without editing it?
Yes. Share your copy with view-only access from Google Sheets and the whole team can read the scorecard on a phone or laptop without touching a formula.
About the Author
Built by PK – Microsoft Certified Professional with 15+ years of Excel, Google Sheets, and Power BI experience. Founder of NextGenTemplates, reaching 300K+ subscribers across YouTube channels. Every template is hand-built and tested before release.
Explore Related Templates
- Electrical Contractor KPI Scorecard in Google Sheets – the one-page scorecard build of the same topic.
- HVAC Contractor KPI Dashboard in Google Sheets – the same dashboard structure for HVAC service firms.
- Plumbing Business KPI Dashboard in Google Sheets – for plumbing contractors.
- Electrical Contractor KPI Scorecard in Excel – if your team works in desktop Excel.
- Browse every Google Sheets KPI Dashboard or the full Google Sheets template range.
Get the Electrical Contractor KPI Dashboard in Google Sheets today. Instant download, lifetime access, free bug fixes, and a copy link that works the moment you check out.
Watch the step-by-step video Demo:
Last updated: August 2026.























Reviews
There are no reviews yet.