



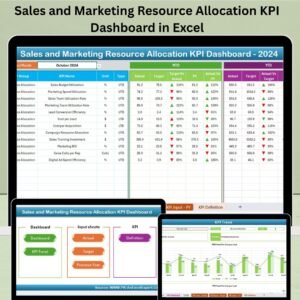
The Sales and Marketing Resource Allocation KPI Dashboard in Excel is a comprehensive and powerful tool designed to help businesses optimize the allocation of resources within their sales and marketing departments. This Excel-based dashboard provides insightful tracking of key performance indicators (KPIs) related to resource usage, budget allocation, and team productivity.
Whether you’re managing a small team or a large enterprise, this dashboard allows you to monitor the effectiveness of your resource allocation, ensuring that your sales and marketing efforts are aligned with business goals. By tracking metrics like campaign performance, budget spending, and team output, this tool enables data-driven decision-making and ensures optimal performance across sales and marketing functions.
Key Features of the Sales and Marketing Resource Allocation KPI Dashboard in Excel
📊 Resource Allocation Tracking
Monitor the allocation of resources (such as budget, time, and manpower) across various sales and marketing campaigns. Track how resources are distributed across departments and initiatives for effective planning and optimization.
📈 Budget & Spend Monitoring
Track how the budget is being spent in different sales and marketing activities. Ensure that resources are being used efficiently and within budget constraints, allowing for better financial control and forecasting.
🧑🤝🧑 Team Performance Monitoring
Measure the performance of your sales and marketing teams by tracking metrics such as lead generation, sales conversions, and campaign results. Assess productivity and optimize team output for greater success.
📅 Time-Based Resource Utilization Analysis
Track the utilization of sales and marketing resources over time. Monitor resource allocation trends and make adjustments based on campaign timelines, market conditions, and business objectives.
⚙️ Customizable KPIs & Metrics
Customize the dashboard to track KPIs that are specific to your organization’s goals. Add performance indicators related to sales targets, marketing reach, or campaign effectiveness to suit your unique needs.
📈 Real-Time Performance Tracking
Track the real-time performance of sales and marketing activities. Use up-to-date data to make adjustments quickly and ensure campaigns stay on track and within budget.
Why You’ll Love the Sales and Marketing Resource Allocation KPI Dashboard in Excel
✅ Optimized Resource Allocation
Ensure that resources are being allocated in the most effective way possible. Monitor your team’s performance, budget utilization, and resource efficiency to ensure alignment with business objectives.
✅ Efficient Budget Management
Track your budget and spending in real-time, making it easier to spot inefficiencies and ensure that resources are being used effectively across all campaigns.
✅ Improve Sales & Marketing Performance
Monitor team performance and the success of marketing campaigns. Make data-driven decisions to optimize resource allocation, improve campaign effectiveness, and drive higher sales conversions.
✅ Customizable & Scalable
Tailor the dashboard to fit your specific sales and marketing needs. Whether you’re tracking digital campaigns, traditional marketing, or sales team performance, this dashboard can scale to suit any size business.
✅ User-Friendly & Actionable Insights
With an easy-to-use interface and real-time tracking, this dashboard provides actionable insights that help your sales and marketing teams stay on track and achieve their goals.
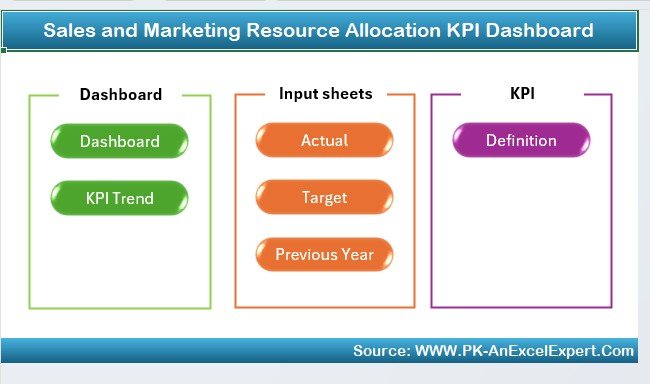
What’s Inside the Sales and Marketing Resource Allocation KPI Dashboard in Excel?
Resource Allocation Tracking: Monitor budget, time, and manpower across campaigns.
Budget & Spend Monitoring: Track and manage your sales and marketing budget efficiently.
Team Performance Metrics: Measure lead generation, conversions, and team output.
Time-Based Resource Analysis: Monitor resource utilization trends over time.
Customizable KPIs: Tailor the dashboard to fit your sales and marketing goals.
Real-Time Data Updates: Track performance and resource allocation in real-time.
How to Use the Sales and Marketing Resource Allocation KPI Dashboard in Excel
1️⃣ Download the Template: Access the Sales and Marketing Resource Allocation KPI Dashboard in Excel instantly.
2️⃣ Input Your Data: Enter your sales and marketing data, including budgets, resource allocation, and team performance.
3️⃣ Monitor KPIs & Performance: Track key metrics such as resource utilization, campaign performance, and sales results.
4️⃣ Analyze Trends & Optimize: Use time-based analysis to identify trends and adjust your resource allocation for optimal results.
5️⃣ Improve Resource Efficiency: Use insights to optimize the allocation of resources and improve the performance of your sales and marketing teams.
Who Can Benefit from the Sales and Marketing Resource Allocation KPI Dashboard in Excel?
🔹 Sales Managers & Marketing Teams
🔹 Business Owners & Executives
🔹 Data Analysts & Performance Managers
🔹 E-commerce & Retail Companies
🔹 Small & Medium Enterprises (SMBs)
🔹 Large Enterprises with Sales and Marketing Teams
🔹 Marketing Agencies & Consultants
Optimize your sales and marketing resource allocation with the Sales and Marketing Resource Allocation KPI Dashboard in Excel. Monitor budgets, track performance, and make data-driven decisions to maximize resource efficiency and campaign success.
Click here to read the Detailed blog post
Visit our YouTube channel to learn step-by-step video tutorials
Youtube.com/@PKAnExcelExpert
Compatibility and Requirements
- Works in Microsoft Excel desktop (Excel 2016 or later, or Microsoft 365).
- New to Excel dashboards? Microsoft’s guide Create a chart from start to finish covers the basics.
Frequently Asked Questions
What resources does the dashboard track?
Budget, time and manpower across your sales and marketing campaigns.
Can I compare budget with spending?
Yes. The budget and spend section tracks your sales and marketing budget against what is spent.
Does it show team results?
Yes. It measures lead generation, conversions and team output.
Can I see how resource use changes over time?
Yes. Time-based analysis shows resource utilization trends over time.
Can I change the KPIs?
Yes. You can tailor the KPIs and metrics to your sales and marketing goals.
Related Resource Allocation Templates
- Resource Allocation KPI Dashboard in Excel: resource allocation KPIs for any team
- Sales and Marketing Operations KPI Dashboard in Excel: track sales and marketing operations
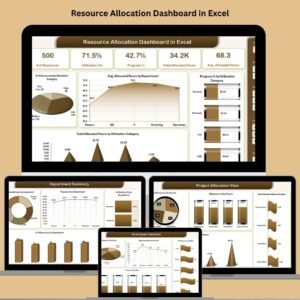
- Resource Allocation Dashboard in Excel: a full resource allocation dashboard
- Resource Allocation KPI Dashboard in Power BI: resource allocation KPIs in Power BI
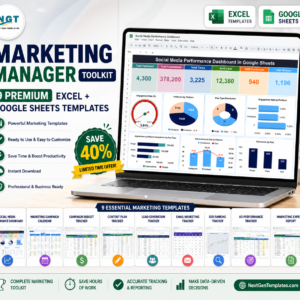
- Marketing Manager Toolkit: 9 marketing templates in one download
Browse all Excel KPI dashboards or the Excel sales and marketing templates.






























Reviews
There are no reviews yet.