



The Sales and Marketing Product Development KPI Dashboard in Excel is a dynamic tool designed to help businesses track and measure the performance of their product development efforts. Whether you’re launching a new product or optimizing an existing one, this Excel-based dashboard allows you to monitor key performance indicators (KPIs) related to product development, marketing performance, and sales growth.
This customizable dashboard helps sales and marketing teams measure product performance from multiple angles—such as market readiness, sales targets, and marketing campaign success. With real-time tracking and in-depth analytics, it empowers decision-makers to make informed choices that drive product success and business growth.
Key Features of the Sales and Marketing Product Development KPI Dashboard in Excel
📊 Product Development Tracking
Monitor the entire product development lifecycle from ideation to launch. Track key metrics such as product readiness, prototype testing, and feedback collection to ensure your product meets market needs.
📈 Sales Performance Monitoring
Track sales performance related to product launches. Monitor metrics like sales growth, revenue, and market share to ensure product success in the market.
🧑💼 Marketing Campaign Effectiveness
Evaluate the effectiveness of marketing campaigns. Track key KPIs like campaign ROI, customer acquisition cost (CAC), and conversion rates to optimize marketing strategies.
⚙️ Cross-Team Collaboration & Alignment
Ensure sales and marketing teams are aligned with product development goals. Use the dashboard to track tasks, deadlines, and project milestones, ensuring smooth collaboration.
📅 Time-Based KPI Tracking
Track and compare product development KPIs over different time periods. Use time-based data to identify trends, measure performance against goals, and make timely adjustments.
🔑 Customizable KPIs & Metrics
Tailor the dashboard to meet your specific business needs. Track the KPIs that matter most, such as product launch timelines, budget usage, or market research data.
Why You’ll Love the Sales and Marketing Product Development KPI Dashboard in Excel
✅ Real-Time Performance Tracking
Track product development and marketing performance in real time. Get instant updates on sales figures, campaign success, and product milestones to make informed decisions quickly.
✅ Optimize Marketing & Sales Strategies
Measure the effectiveness of marketing campaigns and sales efforts to continuously improve strategies, boost conversions, and grow revenue.
✅ Streamline Collaboration
Keep your teams aligned with real-time task tracking, milestone updates, and project goals. Ensure that sales, marketing, and product development teams are working toward the same objectives.
✅ Data-Driven Decisions for Product Launch Success
Use data and insights to refine your product development process, enhance marketing strategies, and drive product adoption and sales growth.
✅ Customizable & Scalable
Adapt the dashboard to suit your specific product development and marketing needs. It’s scalable for both small businesses and large enterprises with diverse product portfolios.
What’s Inside the Sales and Marketing Product Development KPI Dashboard in Excel?
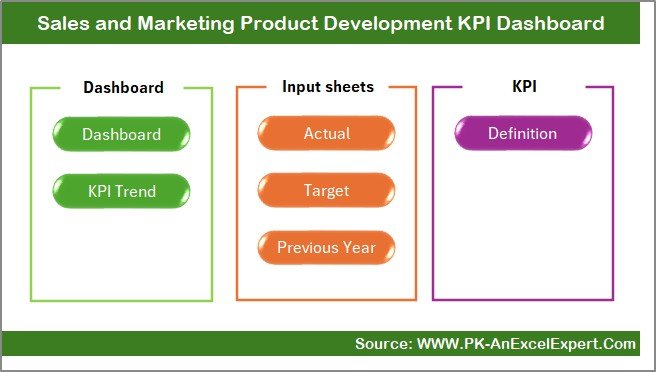
Product Development Tracking: Monitor key stages of product development, from ideation to launch.
Sales Performance Monitoring: Track sales growth, revenue, and market share.
Marketing Campaign Effectiveness: Measure campaign ROI, CAC, and conversion rates.
Cross-Team Collaboration: Keep sales and marketing teams aligned with product development goals.
Time-Based KPI Tracking: Monitor KPIs over different time periods to identify trends.
Customizable KPIs: Tailor the dashboard to track the metrics that matter most to your business.
How to Use the Sales and Marketing Product Development KPI Dashboard in Excel
1️⃣ Download the Template: Access the Sales and Marketing Product Development KPI Dashboard in Excel instantly.
2️⃣ Input Product Data & KPIs: Add details about your product development stages, marketing campaigns, and sales data.
3️⃣ Track KPIs in Real Time: Monitor KPIs such as sales growth, marketing ROI, and product readiness.
4️⃣ Analyze Trends & Data: Use time-based analysis to track the progress of your product and adjust strategies accordingly.
5️⃣ Optimize Product Launches & Marketing: Use the insights to optimize your product development and marketing strategies for better outcomes.
Who Can Benefit from the Sales and Marketing Product Development KPI Dashboard in Excel?
🔹 Product Managers & Development Teams
🔹 Sales & Marketing Teams
🔹 Business Owners & Entrepreneurs
🔹 E-commerce & Retail Companies
🔹 Marketing Consultants & Agencies
🔹 Data Analysts & Performance Analysts
🔹 Small & Medium Enterprises (SMBs)
🔹 Large Corporations with Product Portfolios
Optimize your product development and marketing strategies with the Sales and Marketing Product Development KPI Dashboard in Excel. Track key metrics, measure success, and drive business growth with a data-driven approach.
Click here to read the Detailed blog post
Visit our YouTube channel to learn step-by-step video tutorials
Youtube.com/@PKAnExcelExpert
Watch the step-by-step video Demo:
Compatibility and Requirements
- Works in Microsoft Excel desktop (Excel 2016 or later, or Microsoft 365).
- New to Excel? Microsoft’s free Excel for Windows training.
Frequently Asked Questions
What does this dashboard track?
It tracks product development stages from ideation to launch, sales performance such as sales growth, revenue and market share, and marketing results such as campaign ROI, customer acquisition cost and conversion rates.
Can I compare different time periods?
Yes. Time-based KPI tracking lets you compare product development KPIs across periods to spot trends and measure progress against goals.
Can I change the KPIs?
Yes. The KPIs are customizable, so you can track the metrics that matter to you, such as launch timelines, budget usage or market research data.
How do I start using it?
Add your product development stages, marketing campaign figures and sales data, then review the KPIs and trends the dashboard shows.
Related Product and Marketing Dashboards
- Product Development KPI Dashboard in Excel: product development KPIs on their own
- Project Management Product Development KPI Dashboard in Excel: the project management view of product work
- Sales and Marketing Growth Metrics KPI Dashboard in Excel: growth KPIs for sales and marketing
- Product Development Dashboard in Power BI: product development in Power BI
- KPI Dashboard Library (Excel): 15 Excel KPI dashboards in one download
Browse all Excel KPI dashboards or the Excel sales and marketing templates.































Reviews
There are no reviews yet.