

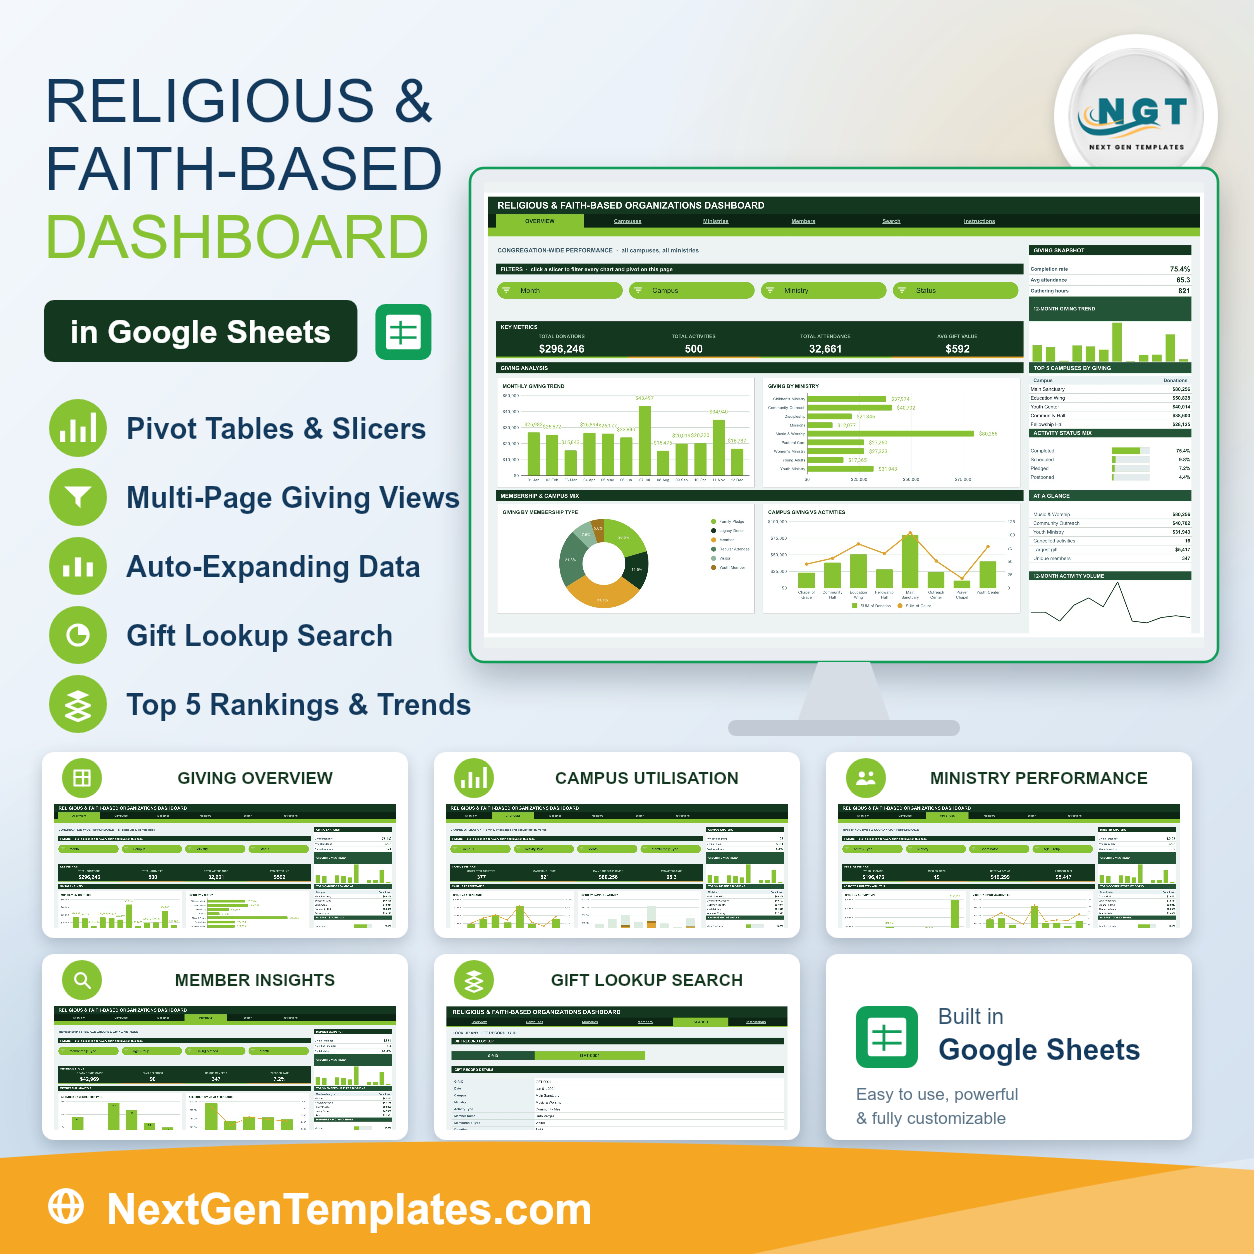
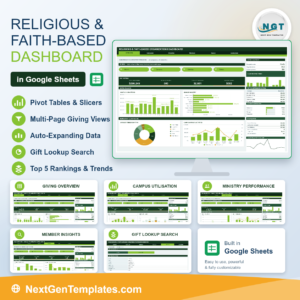
The Religious & Faith-Based Organizations Dashboard in Google Sheets turns one giving-and-activity log into six linked pages that answer the questions an administrative office actually asks each month. The sample file ships with 500 activity records covering $296,246 in donations, 32,661 attendance entries and 347 unique members across 8 venues and 9 programme areas. Every chart reads a native Google Sheets pivot table, every analysis page carries its own four-slicer filter strip, and every pivot, slicer and formula is pre-sized for 1,000 rows. No add-ons, no macros, no monthly subscription. Your download is a PDF holding a Make a copy link, so the dashboard sits in your own Drive in about a minute. If that link ever stops working, email us and we will send a fresh one. It joins 1,400+ Google Sheets templates already on NextGenTemplates.
Key Features of the Religious & Faith-Based Organizations Dashboard in Google Sheets
- Six linked pages. Overview, Campuses, Ministries, Members, Search and Instructions, with a tab strip across the top of every page so navigation is one click.
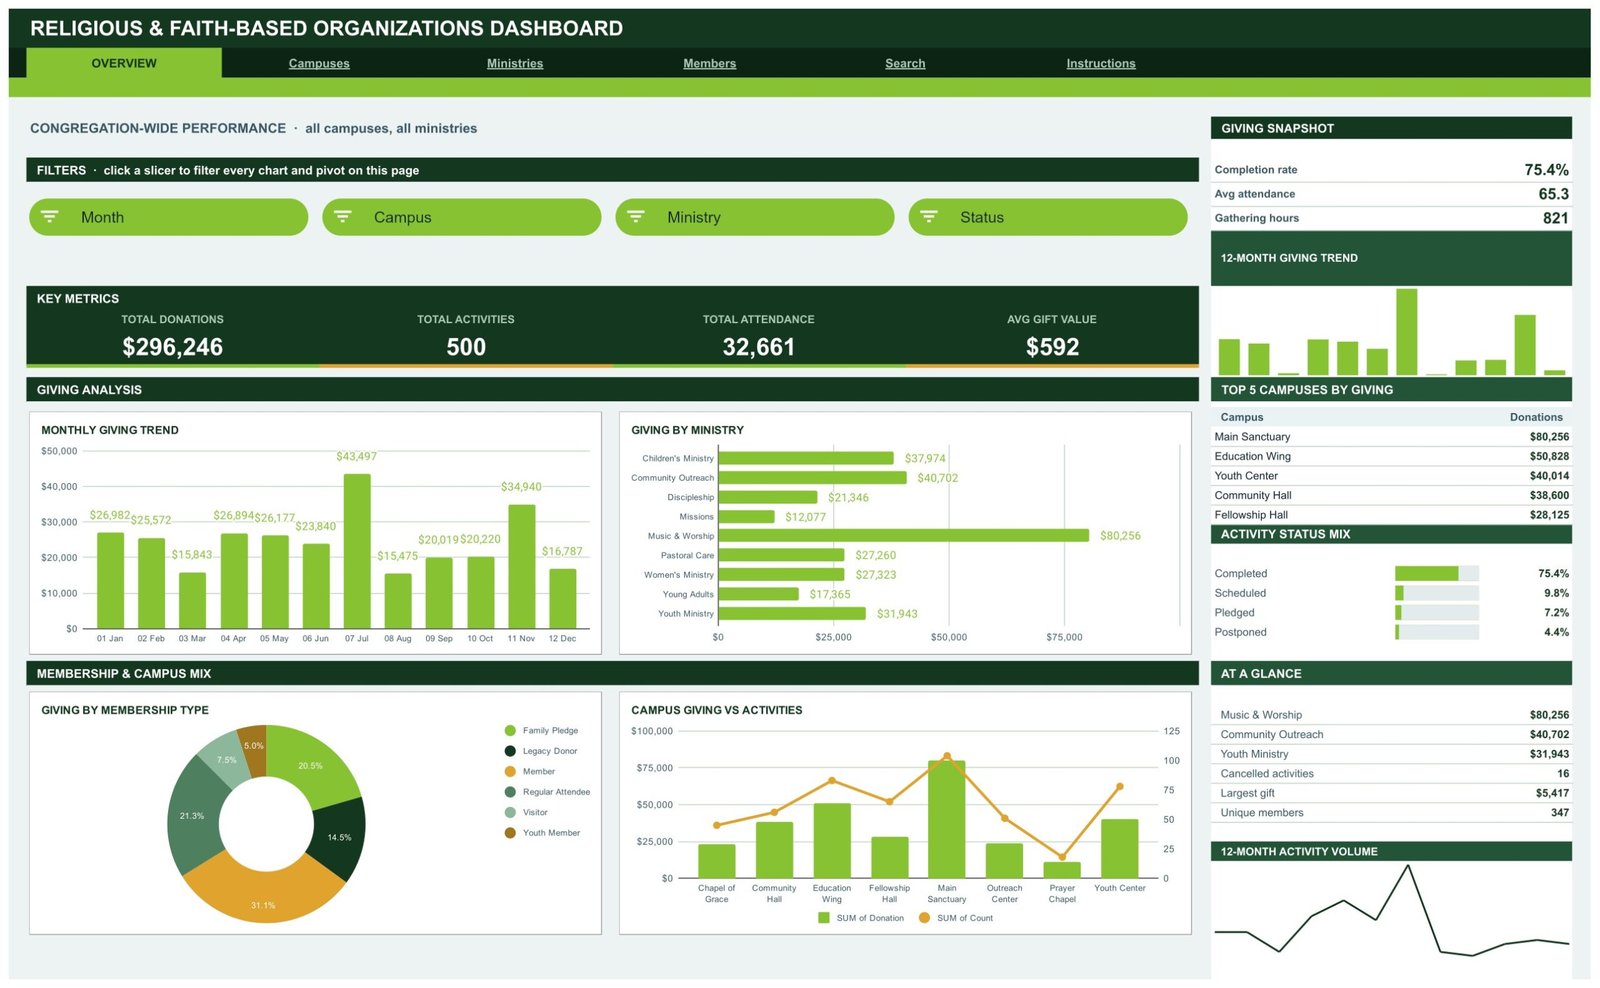
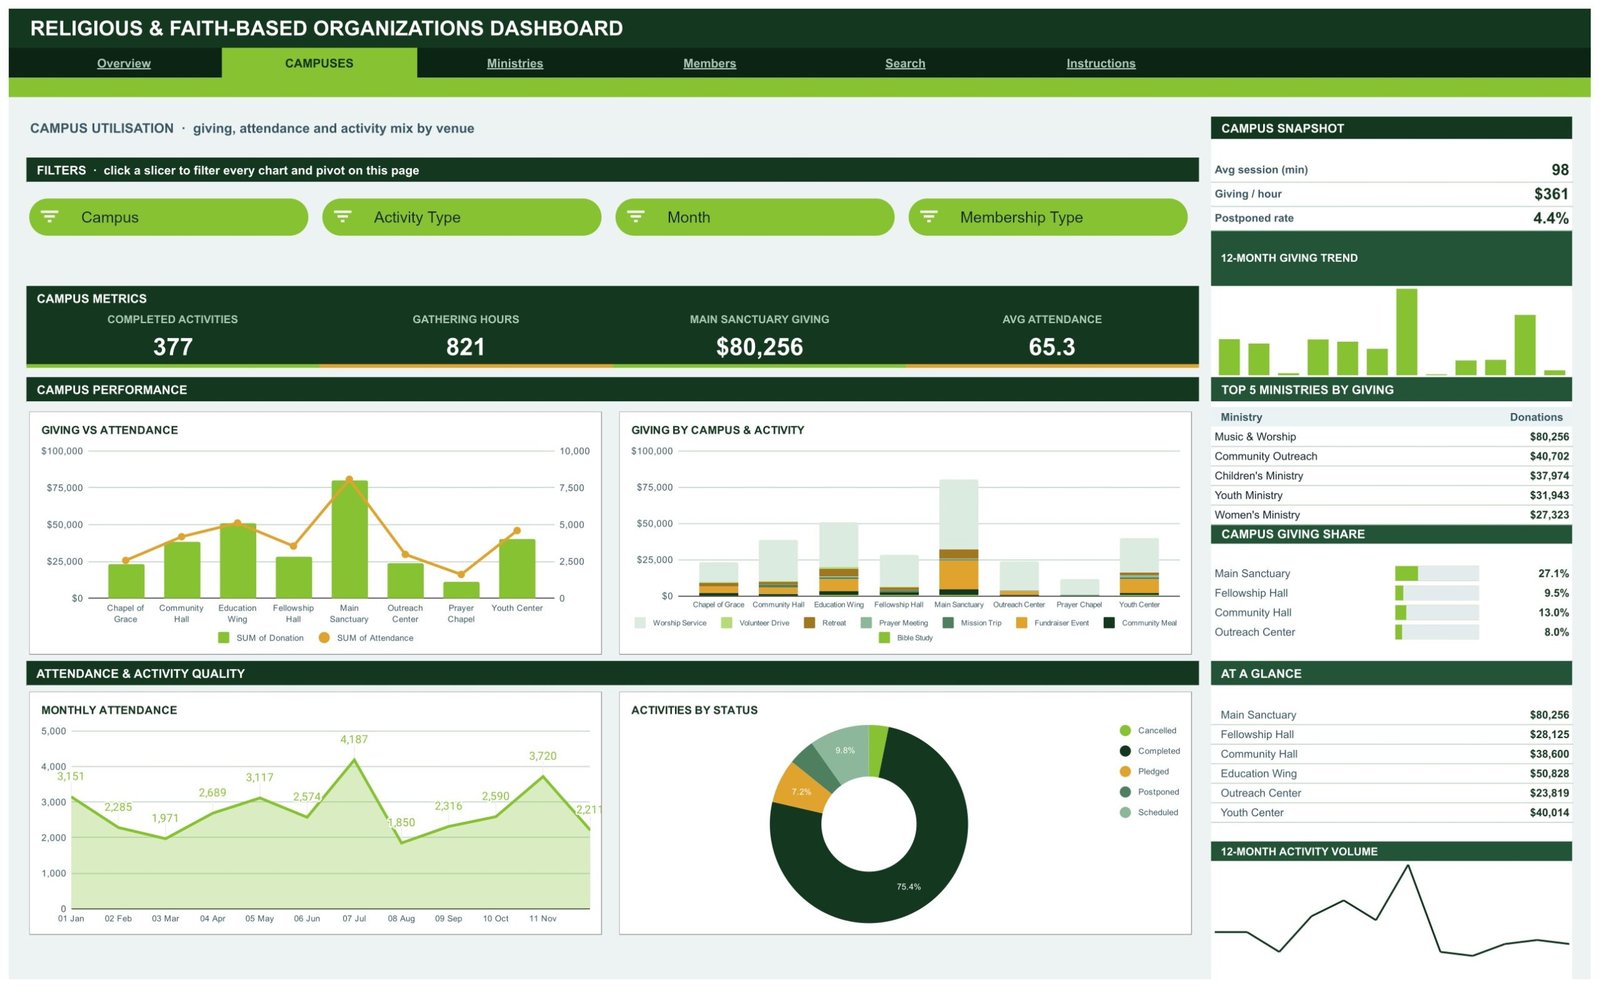
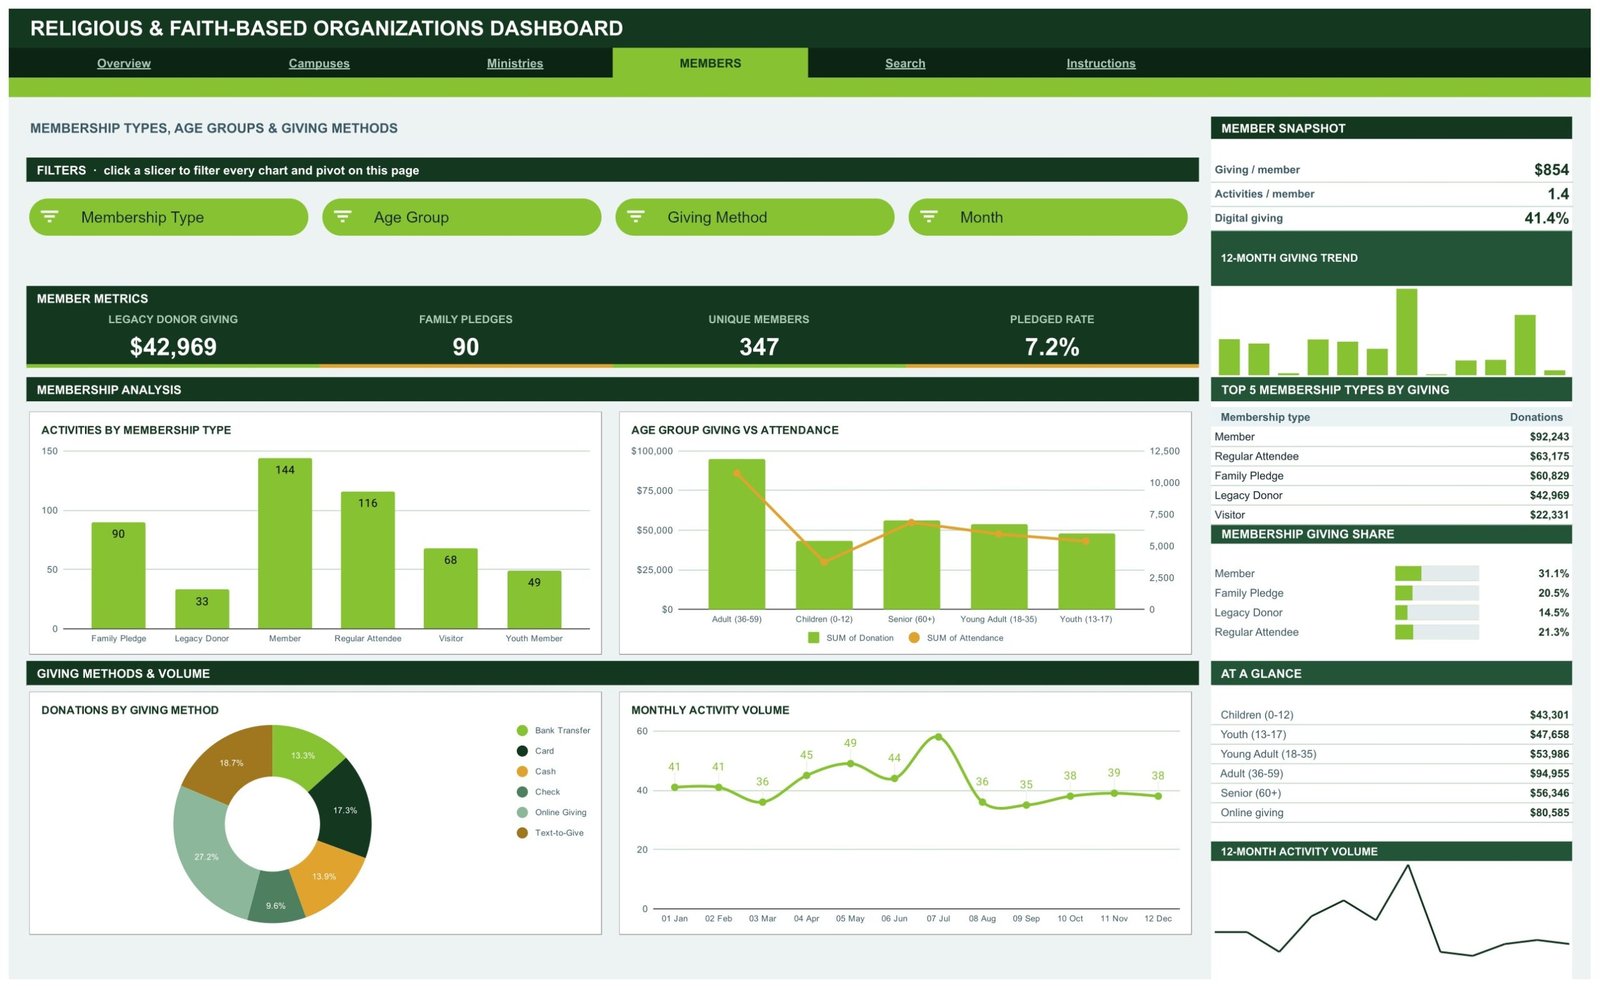
- Native pivot tables and slicers. Four slicers sit at the top of each analysis page. Click one and all four charts, the Top 5 table and the share panel move together.
- 16 KPI cards. Four per analysis page, driven by SUMIFS and COUNTIFS on the Data sheet, so they deliberately hold the unfiltered totals as a constant reference point.
- 16 pivot charts. Monthly trends, ranked bars, mix donuts and dual-axis comparisons, each reading a visible pivot table parked to the right of the page.
- A sidebar on every analysis page. A snapshot ratio block, a 12-month giving sparkline, a Top 5 ranking table, a share-bar panel, an At a Glance list and a 12-month activity volume sparkline.
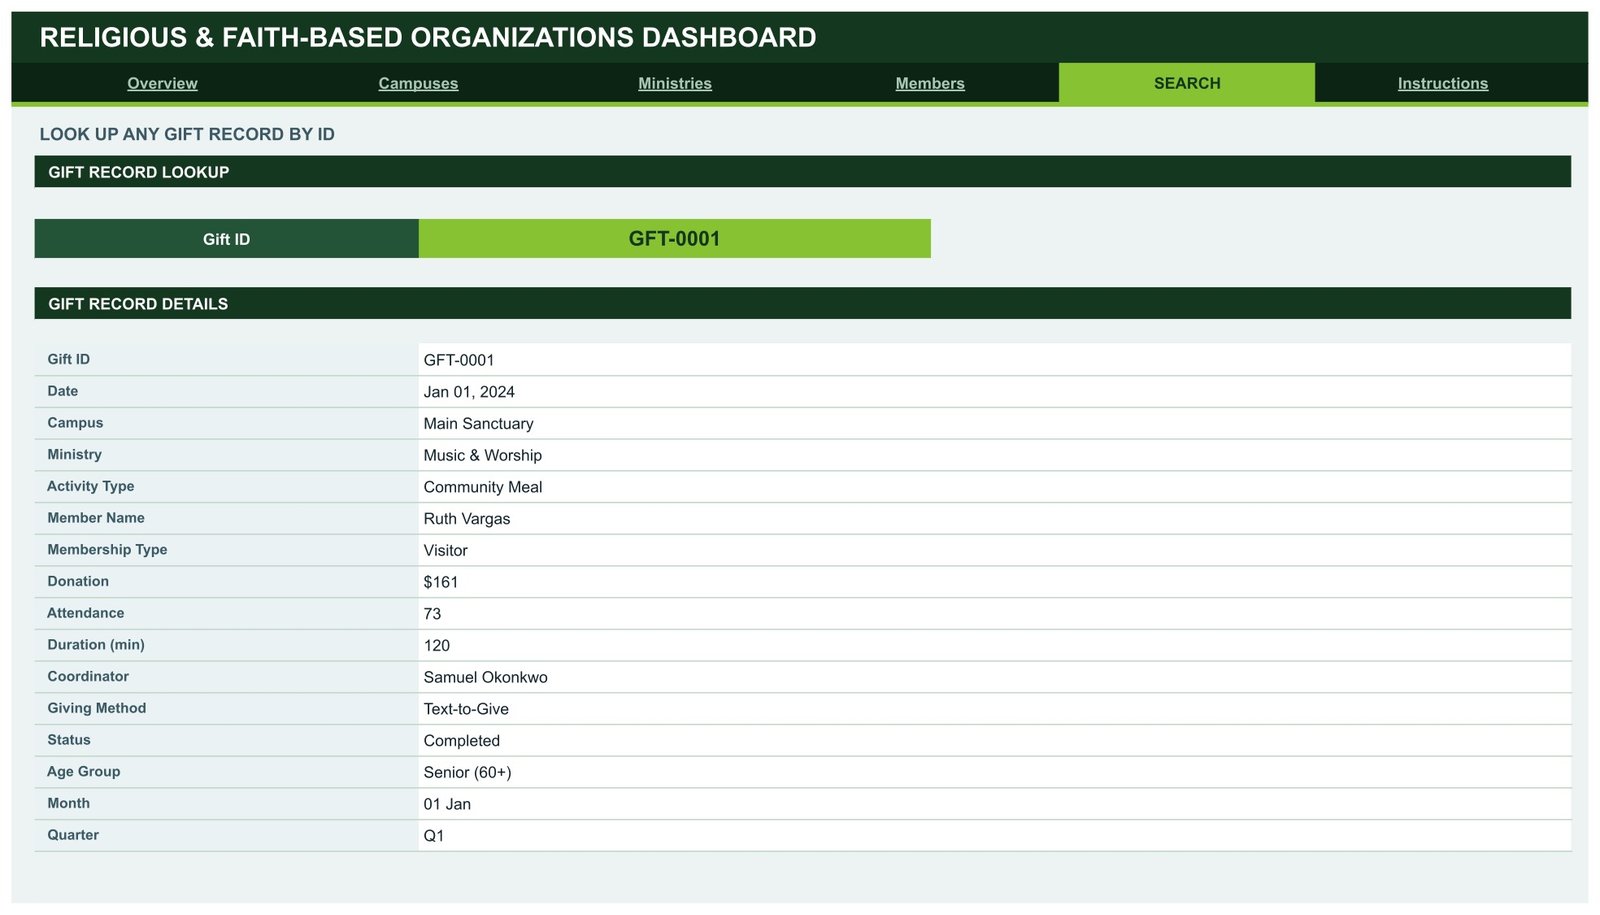
- Gift record lookup. Pick any Gift ID on the Search page and read all 16 fields of that record on one screen.
- 1,000-row headroom. Paste rows anywhere up to row 1001 and everything updates on its own. Need more? Raise DATA_ROWS in the Apps Script file and re-run.
- One-block theme. The palette is one contrast pair, ink #14371F against accent #86C232, plus amber #E0A32E for second chart series. Change three hex codes and the whole file rebrands.
- Neutral, editable labels. Campus, Ministry, Activity Type, Membership Type and Coordinator are plain text columns. Rename them to match how your organisation is actually structured.
What’s Inside the Religious & Faith-Based Organizations Dashboard
Page 1 – Overview
Congregation-wide performance across all campuses and ministries. Slicers: Month, Campus, Ministry, Status. KPI cards: Total Donations $296,246, Total Activities 500, Total Attendance 32,661, Avg Gift Value $592. Charts: Monthly Giving Trend, Giving by Ministry, Giving by Membership Type and Campus Giving vs Activities. The sidebar carries a Giving Snapshot (completion rate 75.4%, average attendance 65.3, 821 gathering hours), Top 5 Campuses by Giving and an Activity Status Mix that splits completed, scheduled, pledged and postponed.
Page 2 – Campuses
Venue utilisation: giving, attendance and activity mix by location. Slicers: Campus, Activity Type, Month, Membership Type. KPI cards: Completed Activities 377, Gathering Hours 821, Main Sanctuary Giving $80,256, Avg Attendance 65.3. Charts: Giving vs Attendance, Giving by Campus & Activity, Monthly Attendance and Activities by Status. The sidebar adds average session length, giving per hour, postponed rate and a campus giving share panel.
Page 3 – Ministries
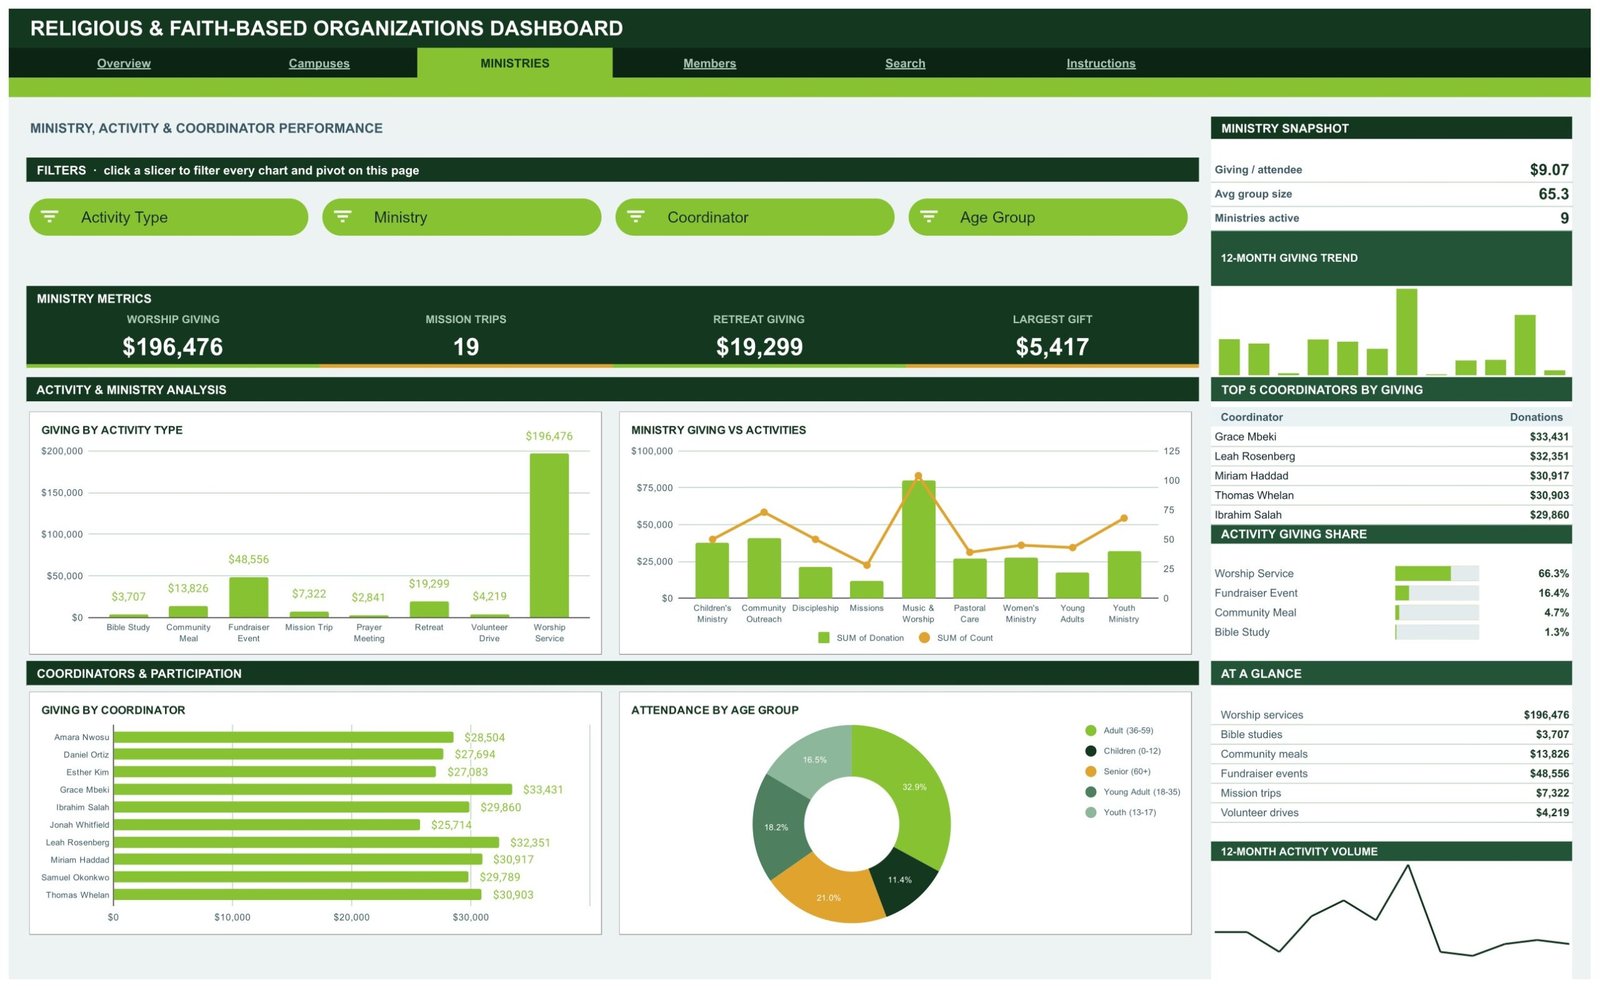
Programme, activity and coordinator performance. Slicers: Activity Type, Ministry, Coordinator, Age Group. KPI cards: Worship Giving $196,476, Mission Trips 19, Retreat Giving $19,299, Largest Gift $5,417. Charts: Giving by Activity Type, Ministry Giving vs Activities, Giving by Coordinator and Attendance by Age Group. The sidebar tracks giving per attendee, average group size, active programme count and a Top 5 Coordinators table.
Page 4 – Members
Membership types, age groups and giving methods. Slicers: Membership Type, Age Group, Giving Method, Month. KPI cards: Legacy Donor Giving $42,969, Family Pledges 90, Unique Members 347, Pledged Rate 7.2%. Charts: Activities by Membership Type, Age Group Giving vs Attendance, Donations by Giving Method and Monthly Activity Volume. The giving-method donut splits online giving, text-to-give, bank transfer, card, cash and cheque, and the sidebar reports a 41.4% digital giving share.
Page 5 – Search
A gift record lookup. Choose a Gift ID and the page returns Date, Campus, Ministry, Activity Type, Member Name, Membership Type, Donation, Attendance, Duration, Coordinator, Giving Method, Status, Age Group, Month and Quarter. This is the page treasurers use when someone asks about a single gift.
Page 6 – Instructions plus the Data sheet
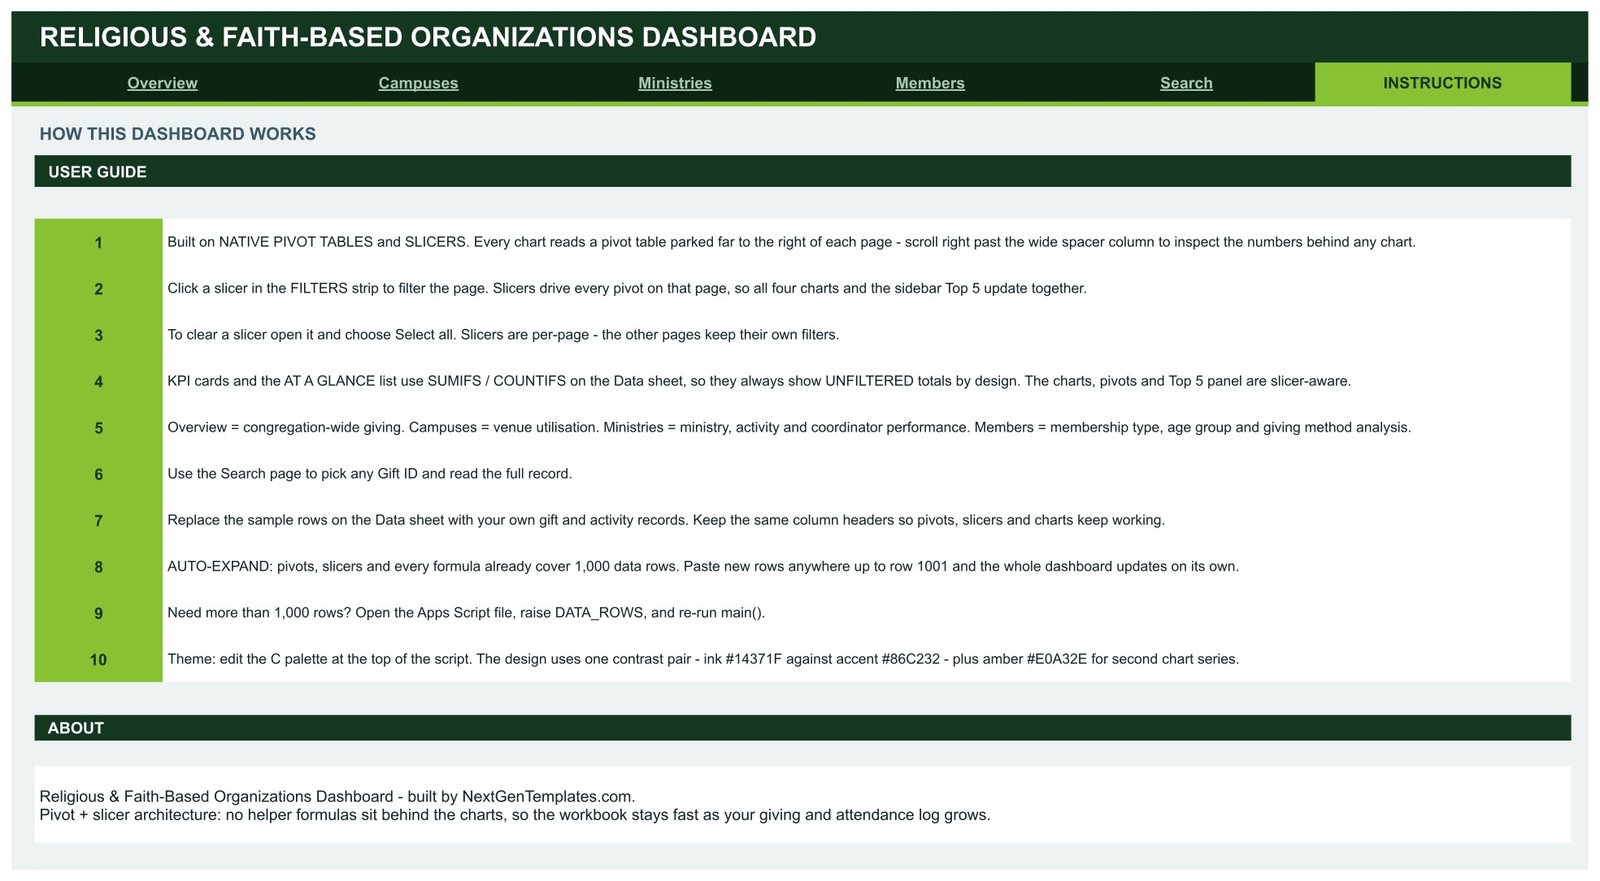
A ten-step user guide covering slicers, the unfiltered KPI logic, the auto-expand range and the theme block. Behind it sits the Data sheet, a flat 16-column log that is the only place you ever type.
Google Sheets vs. Excel vs. Paid Donor Management SaaS – Where This Fits
| Point of comparison | This Google Sheets dashboard | Excel dashboard equivalent | Paid donor / member management SaaS |
|---|---|---|---|
| Cost | $9.99 one time | $13.99 one time, plus a Microsoft licence | Recurring subscription, usually tiered by record count |
| Platform | Any browser, Sheets mobile app | Desktop Excel or Microsoft 365 | Vendor web app |
| Setup time | About a minute to copy, an afternoon to load a year of records | Similar, once Excel is installed | Days to weeks, usually with an onboarding call |
| Real-time team collaboration | Yes, native multi-editor | Only through OneDrive co-authoring | Yes, with per-seat licensing |
| Mobile access | Yes, read and edit | Limited | Yes, usually a dedicated app |
| Customisable fields | Every column, label and chart | Every column, label and chart | Only the fields the vendor exposes |
| Share with a link | Yes, Drive sharing | File send or OneDrive link | Invite-only accounts |
| Year-1 cost at 5 users | $9.99 total | $13.99 plus existing licences | Several hundred dollars and up |
| Data stays in your own account | Yes, your Google Drive | Yes, your device | No, vendor-hosted |
| Offline pledge and cash entry | Yes, any column accepts any method | Yes | Often gated behind a higher tier |
Who This Template Is For – and Who It’s Not For
A good fit if you run a single organisation or a small multi-site group, you already keep giving and attendance in a spreadsheet, and you want monthly reporting for a board, council or finance committee without paying for a platform. It suits treasurers, administrators, programme coordinators and volunteer bookkeepers who need charts they can hand over at a meeting.
Not a good fit if you need online donation processing, receipting or tax statements generated automatically – this is a reporting layer, not a payment gateway. It is also the wrong tool if you need per-user permissions down to the record level, if you must hold personally identifiable member data under a formal retention policy that forbids consumer cloud storage, or if your log runs to tens of thousands of rows a year, where a database-backed system will simply be faster.
How to Use the Religious & Faith-Based Organizations Dashboard
- Open the PDF in your download and click the Make a copy link. The file lands in your own Google Drive.
- Open the Data sheet. Keep the 16 column headers exactly as they are – the pivots, slicers and formulas all point at them.
- Delete the sample rows and paste your own gift and activity records anywhere up to row 1001.
- Rename the values in Campus, Ministry, Activity Type and Membership Type to match your own structure. The charts pick up the new labels automatically.
- Go back to the Overview and click a slicer. All four charts, the Top 5 table and the share panel filter together.
- Use the Search page to answer single-record questions without scrolling the log.
- To rebrand, edit the three hex codes at the top of the Apps Script palette block and re-run.
Real-World Use Cases
Miriam, administrator of a three-site organisation. Her monthly council pack used to take two evenings of copy-paste. She now filters the Campuses page by month, exports the four charts, and the pack is done before dinner. The giving-per-hour ratio started a useful conversation about a venue that was open twice as long as it was used.
Daniel, volunteer treasurer. He reconciles the giving-method donut against the bank statement each month. When the online giving share moved from 24% to 41%, he had the evidence to retire a manual envelope count that took four volunteers an hour every week.
Grace, programme coordinator. She uses the Ministries page filtered to her own name and age group. Attendance by age group told her the 13-17 band had drifted, and she moved a mid-week slot before the trend became a problem.Religious & Faith-Based Organizations Dashboard in Google Sheets
Frequently Asked Questions
Do I need any add-on or paid Google account?
No. It runs on a free personal Google account and uses only native Sheets features – pivot tables, slicers, charts and standard formulas.Religious & Faith-Based Organizations Dashboard in Google Sheets
How many records can it hold?
Pivots, slicers and formulas already cover 1,000 rows. To go further, open the bundled Apps Script file, raise the DATA_ROWS value and re-run main().Religious & Faith-Based Organizations Dashboard in Google Sheets
Why don’t the KPI cards change when I click a slicer?
That is by design. The KPI cards and the At a Glance list use SUMIFS and COUNTIFS on the Data sheet, so they always show unfiltered totals as a fixed reference. The charts, pivots and Top 5 panel are the slicer-aware parts.
Can I rename the ministries and campuses?
Yes. They are plain text values in the Data sheet. Rename them to whatever your organisation calls its venues, programmes and membership categories, and every chart follows.
Does it handle multiple currencies?
It uses one currency at a time. Change the cell format on the Donation column and the KPI cards, and the whole file follows.
What exactly do I download?
A PDF containing the Make a copy link plus setup notes. Google Sheets files cannot be emailed as a file, so the copy link is how every Sheets template on this site is delivered.
Can I share it with my board or committee?
Yes. It is an ordinary Sheets file in your Drive – share it view-only with a board and edit-only with your office team.Religious & Faith-Based Organizations Dashboard in Google Sheets
About the Author
Built by PK – Microsoft Certified Professional with 15+ years of Excel, Google Sheets, and Power BI experience. Founder of NextGenTemplates, reaching 300K+ subscribers across YouTube channels. Every template is hand-built and tested before release.Religious & Faith-Based Organizations Dashboard in Google Sheets
Explore Related Templates
- Church Finance Dashboard in Google Sheets – the finance-first companion to this operations view.
- Religious & Faith-Based Organizations Dashboard in Excel – same subject, desktop Excel build.
- Religious & Faith-Based Organizations Dashboard in Power BI – for teams already reporting in Power BI.
- Fundraising Event Calendar in Google Sheets – plan the events this dashboard measures.
- Donation Register Data Entry System in Excel – a form-driven way to capture gifts at source.
- Community Services Dashboard in Google Sheets and Housing & Urban Development Dashboard in Google Sheets – the same pivot-and-slicer build for other community programmes.
- Browse the full Google Sheets dashboard category.Religious & Faith-Based Organizations Dashboard in Google Sheets
Get the Dashboard
Add the Religious & Faith-Based Organizations Dashboard in Google Sheets to your cart at $9.99, open the PDF, click Make a copy, and paste in your own giving and attendance log. Your next monthly report is then a filter click away. A full walkthrough is on the blog: Religious & Faith-Based Organizations Dashboard in Google Sheets.Religious & Faith-Based Organizations Dashboard in Google Sheets
Watch the step-by-step video Demo:
Last updated: 13 August 2026.



























Reviews
There are no reviews yet.