

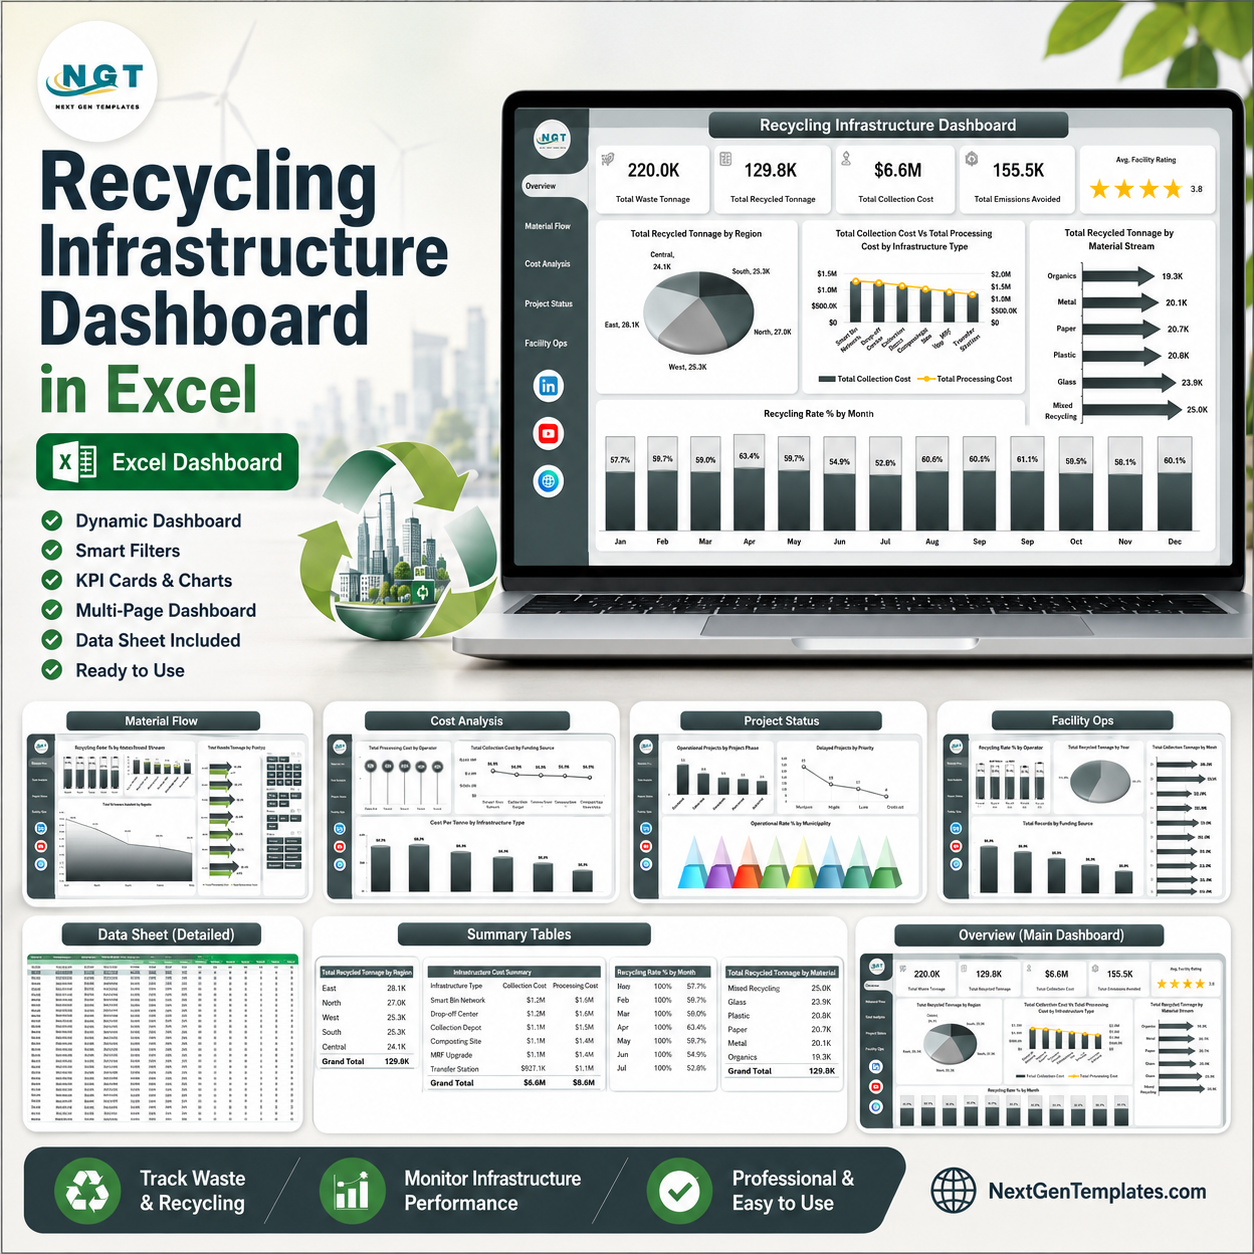



Recycling Infrastructure Dashboard in Excel helps municipal recycling teams, facility operators, sustainability analysts, infrastructure planners, and waste management consultants review recycling performance across 7 workbook tabs, 5 executive KPI cards, and 20 chart views. Instead of rebuilding monthly reports from scattered waste, cost, facility, and project data, you can update the Data sheet, refresh pivots, and review tonnage, recycling rate, costs, emissions avoided, facility rating, project status, and operator performance in one Excel dashboard. Built by PK for a 300K+ analytics audience, this template is a one-time purchase with editable Excel logic and no recurring SaaS fee.
Key Features of Recycling Infrastructure Dashboard in Excel
- 7 Excel sheet tabs: Overview, Material Flow, Cost Analysis, Project Status, Facility Ops, Data, and Support.
- Executive KPI cards: Track Total Waste Tonnage, Total Recycled Tonnage, Total Collection Cost, Total Emissions Avoided, and Avg. Facility Rating.
- Interactive slicers: Filter dashboard pages quickly by the available recycling infrastructure fields.
- Cost tracking: Compare collection cost, processing cost, cost per tonne, operator cost, and funding source.
- Material flow reporting: Review recycling rate, waste tonnage, recycled tonnage, material streams, regions, and facilities.
- Project and facility views: Monitor operational rate, delayed projects, priority, facility ratings, project phase, and yearly trends.
What’s Inside the Recycling Infrastructure Dashboard in Excel
1 – Overview Page
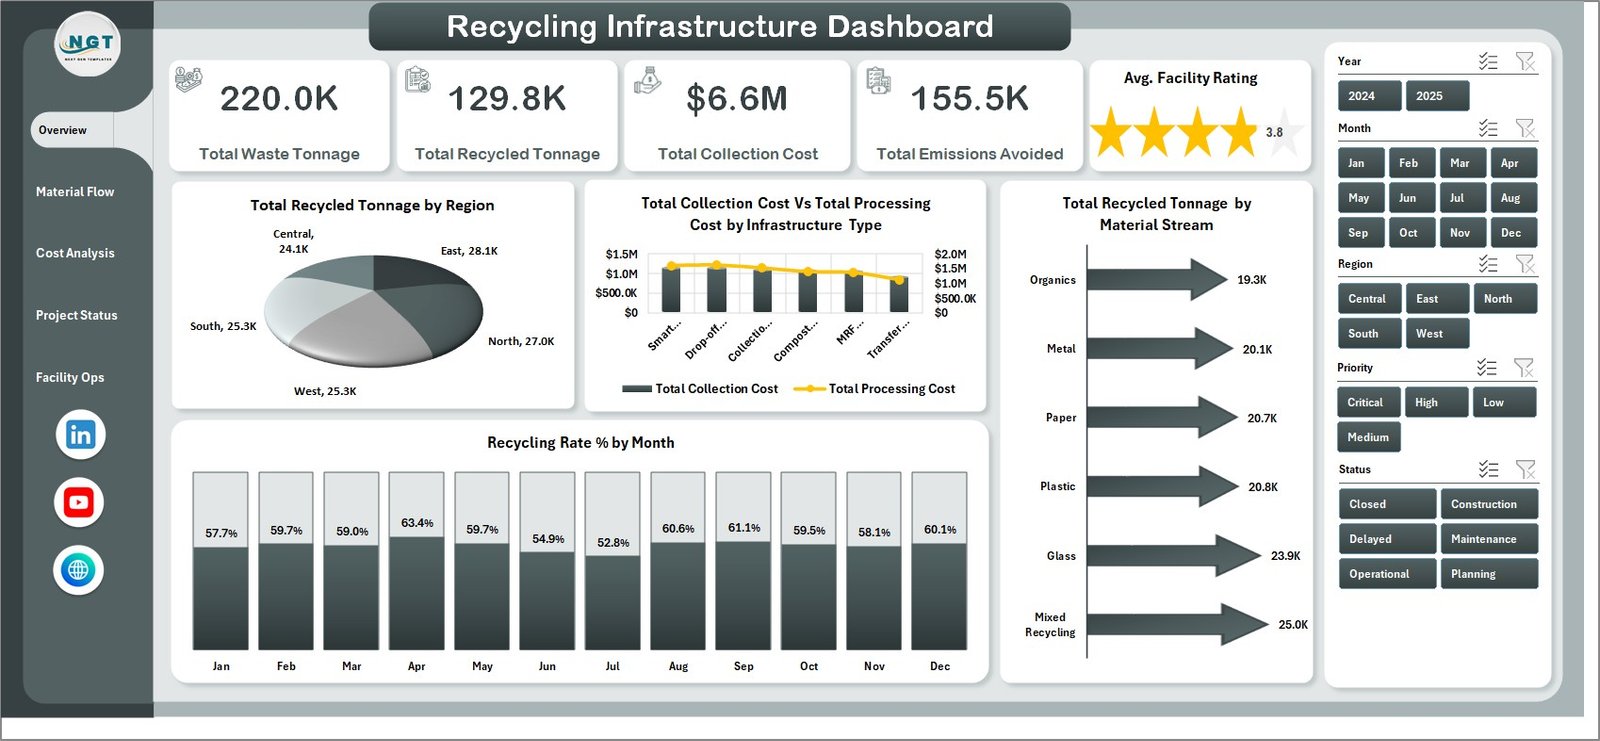
The Overview page is the first sheet for high-level review. It shows Total Waste Tonnage, Total Recycled Tonnage, Total Collection Cost, Total Emissions Avoided, and Avg. Facility Rating in top cards so leaders can understand recycling scale, cost, impact, and service quality at a glance.
Total Recycled Tonnage by Region: This chart compares recycled tonnage across regions. It helps users identify which areas contribute the most recovered material and where recycling output may need attention.
Total Collection Cost vs Total Processing Cost by Infrastructure Type: This chart compares the two major cost groups by infrastructure type. It helps teams see whether cost pressure is coming from collection, processing, or a specific asset group.
Recycling Rate % by Month: This trend shows how recycling rate changes month by month. It helps managers spot seasonal movement, improvements, or periods where diversion performance drops.
Total Recycled Tonnage by Material Stream: This chart compares recycled tonnage by material stream. It shows which streams drive the most volume and where stream-level recovery may need improvement.
2 – Material Flow
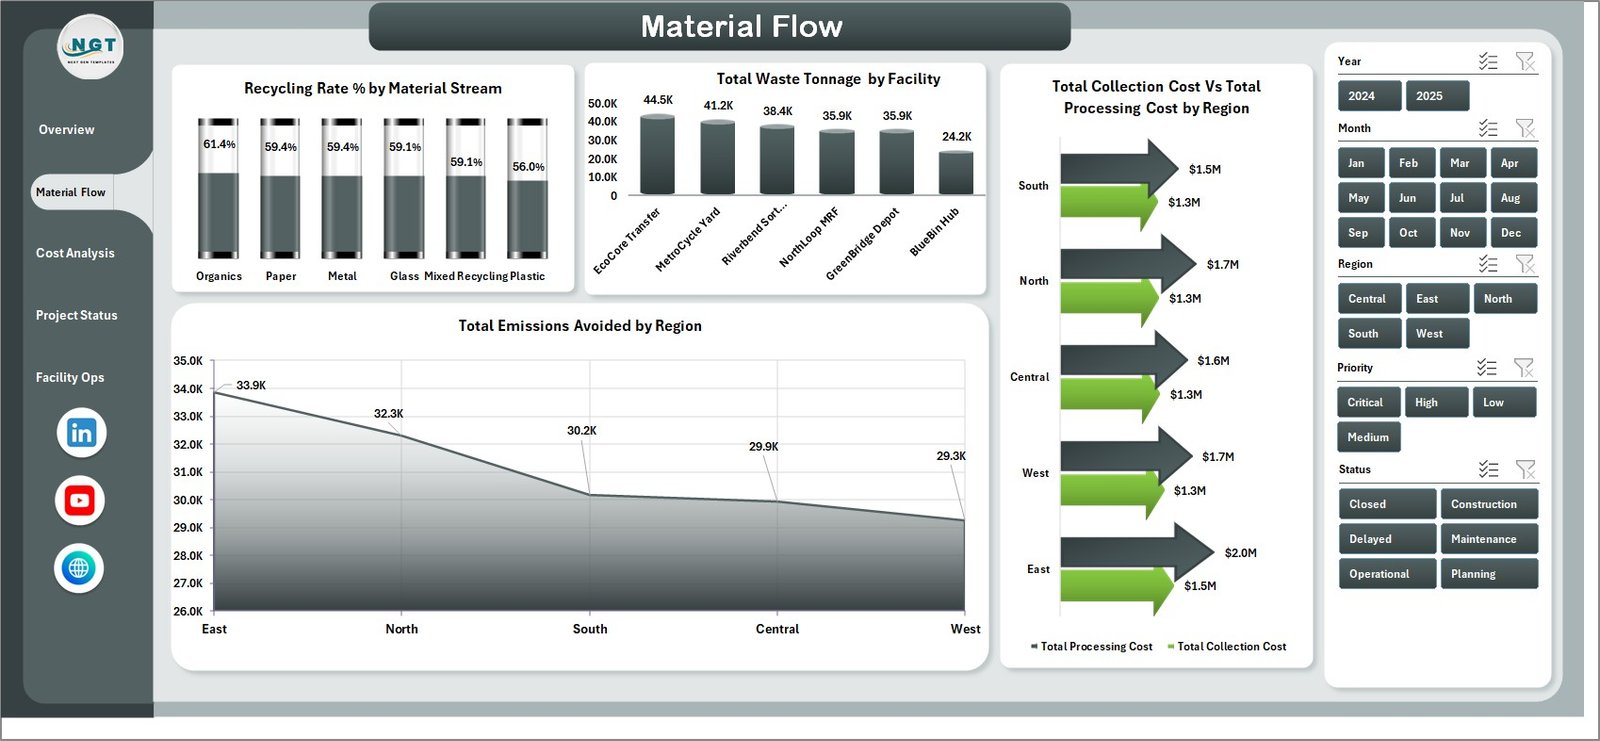
The Material Flow sheet focuses on tonnage movement and recycling efficiency. It helps analysts compare material streams, facilities, regions, processing cost, collection cost, and emissions avoided.
Recycling Rate % by Material Stream: This chart compares recycling efficiency across material streams. It helps identify which streams perform well and which need better sorting, collection, or processing action.
Total Waste Tonnage by Facility: This chart compares waste tonnage handled by each facility. It helps teams understand facility workload and where capacity or process review may be required.
Total Processing Cost vs Total Collection Cost by Region: This chart compares major cost groups by region. It helps regional managers see whether cost differences are driven by collection routes or processing operations.
Total Emissions Avoided by Region: This chart compares avoided emissions by region. It helps sustainability teams communicate environmental benefit alongside operational performance.
3 – Cost Analysis
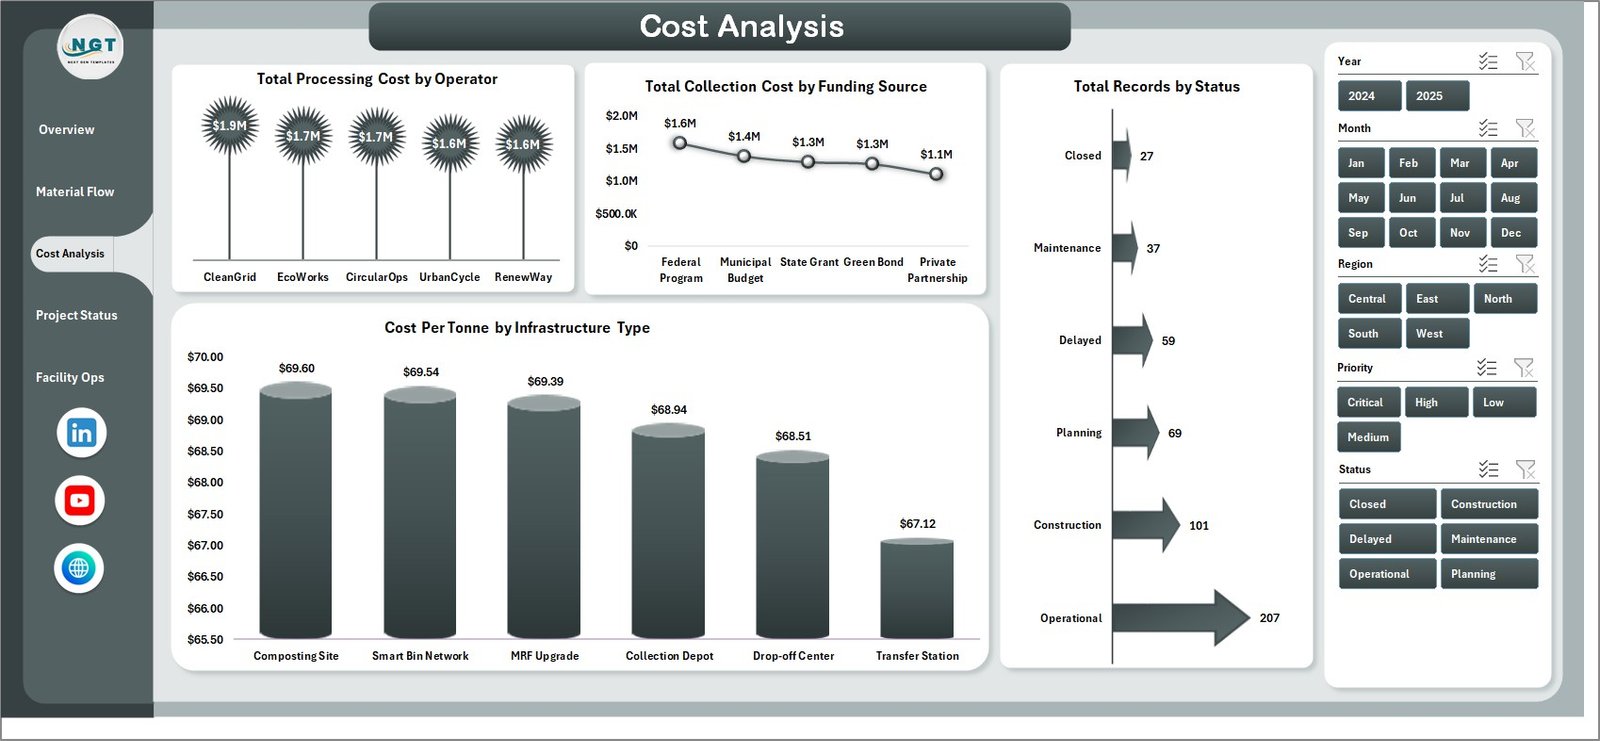
The Cost Analysis sheet helps finance and operations teams review cost drivers. It includes analysis by operator, funding source, project status, and infrastructure type.
Total Processing Cost by Operator: This chart compares processing cost across operators. It helps identify operators with higher cost exposure and supports vendor or contract review.
Total Collection Cost by Funding Source: This chart shows collection cost grouped by funding source. It helps finance teams understand which funding streams support collection activity.
Total Records by Status: This chart counts records by status. It gives a quick view of active, delayed, planned, completed, or other operational states.
Cost Per Tonne by Infrastructure Type: This chart compares unit cost by infrastructure type. It helps reveal which infrastructure groups are more expensive per tonne handled.
4 – Project Status
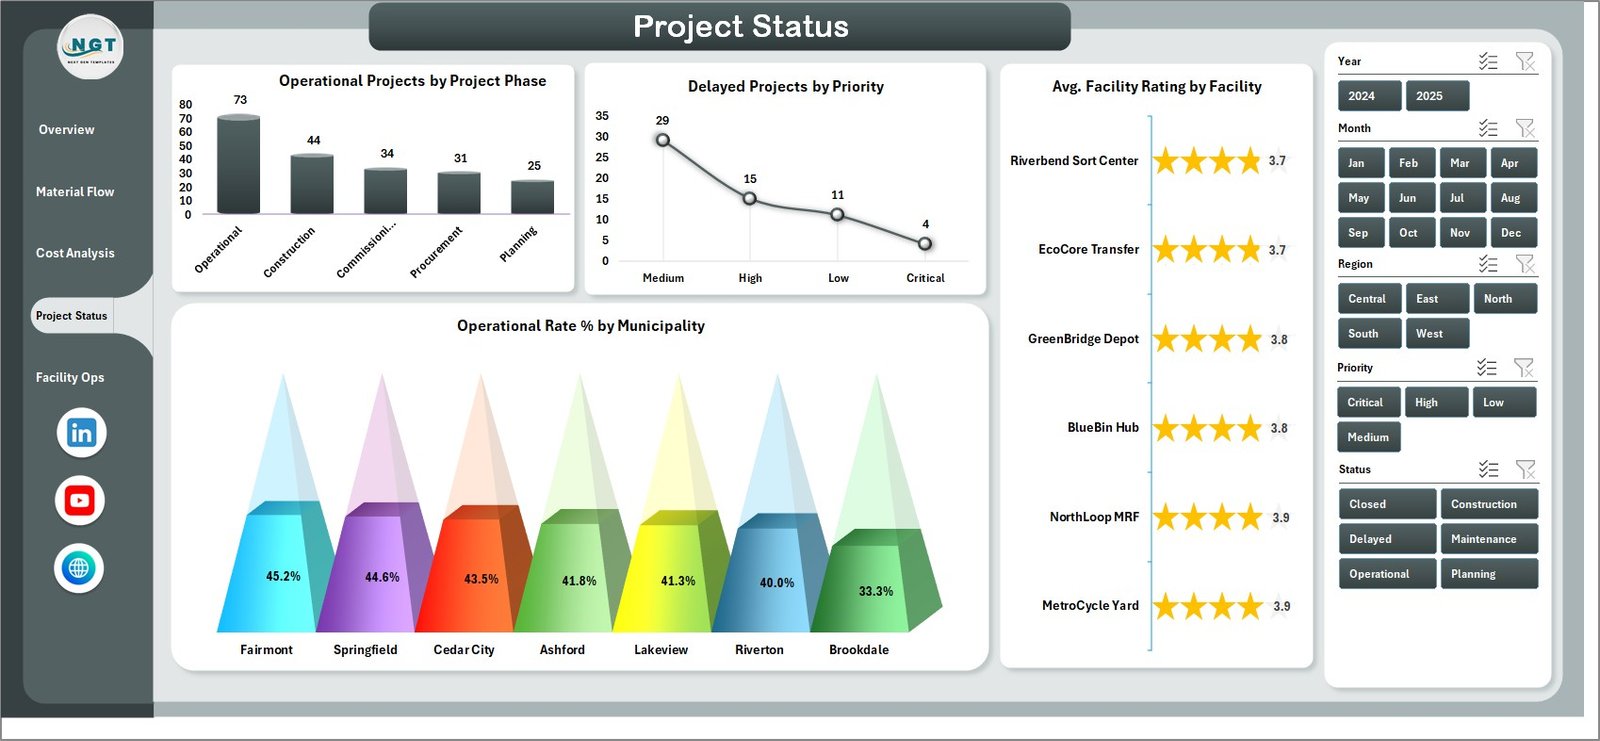
The Project Status sheet supports infrastructure delivery review. It focuses on operational projects, delayed projects, priority, facility rating, and municipality-level operational rate.
Operational Projects by Project Phase: This chart shows operational projects by phase. It helps project teams see where working assets sit across the project lifecycle.
Delayed Projects by Priority: This chart groups delayed projects by priority. It helps managers focus attention on the highest-impact delays first.
Avg. Facility Rating by Facility: This chart compares average rating by facility. It helps highlight facilities with strong or weak performance scores.
Operational Rate % by Municipality: This chart compares operational performance across municipalities. It helps local teams identify where infrastructure readiness is strong or lagging.
5 – Facility Ops
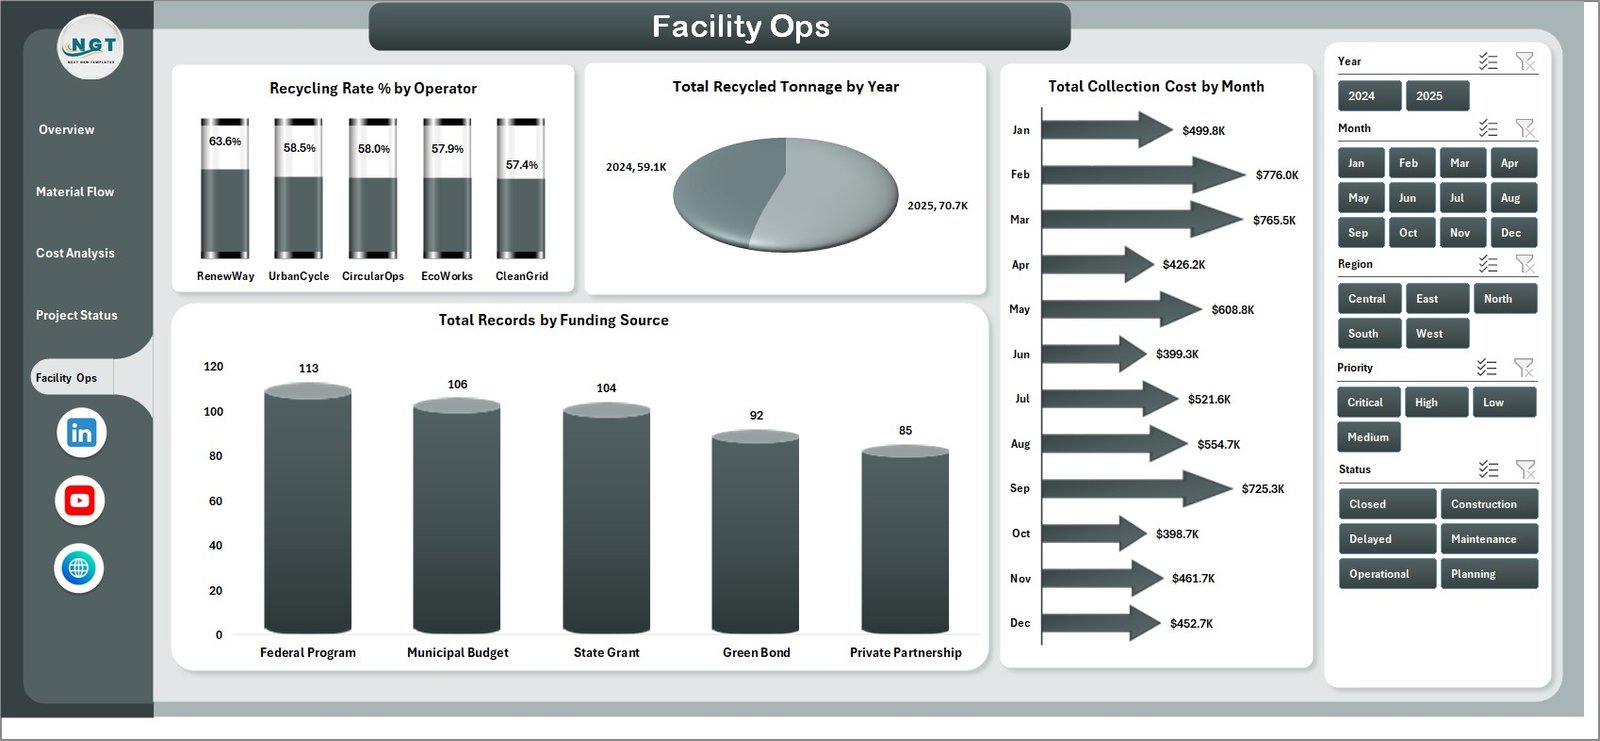
The Facility Ops sheet is designed for recurring operational review. It compares operator recycling rate, yearly recycled tonnage, monthly collection cost, and funding source records.
Recycling Rate % by Operator: This chart compares recycling performance by operator. It helps management see which operators deliver stronger diversion results.
Total Recycled Tonnage by Year: This chart shows recycled tonnage across years. It helps teams review long-term recovery growth or decline.
Total Collection Cost by Month: This trend compares collection cost across months. It helps identify cost spikes, seasonal pressure, or route-related changes.
Total Records by Funding Source: This chart shows how records are distributed by funding source. It helps review the funding mix behind recycling infrastructure activity.
6 – Data Sheet Tab
The Data sheet is where you enter or paste recycling infrastructure records in the same format as the template. After updating the data, refresh the workbook so the pivot tables, slicers, cards, and charts update.

7 – Support Sheet
The Support sheet contains the pivot tables used to build the dashboard dynamically. After updating the Data sheet, go to the Excel Data ribbon and click Refresh All. You can keep this sheet hidden during normal use.

Recycling Infrastructure Dashboard in Excel vs. Google Sheets vs. Paid CRM/SaaS – Where This Fits
| Feature | This Excel dashboard | Google Sheets alternative | Paid SaaS alternative |
|---|---|---|---|
| Cost | $17.99 sale price | Low cost, but rebuild required | Recurring subscription |
| Platform | Microsoft Excel | Browser-based spreadsheet | Vendor cloud app |
| Setup time | Download, enter data, refresh | Build formulas and charts | Configure account and workflow |
| Customizable fields | Editable workbook structure | Editable if built manually | Often limited by plan |
| Year-1 cost at 5 users | One template purchase plus Excel access | Internal build time | Often hundreds or thousands per year |
| Best fit | Recycling infrastructure reporting | Light collaborative tracking | Live operational workflow |
Who This Template Is For – and Who It’s Not For
This dashboard is for recycling coordinators, municipal waste teams, sustainability managers, facility operators, infrastructure analysts, environmental consultants, and finance teams that need repeatable Excel reporting for recycling infrastructure.
It is not a route optimization engine, IoT monitoring system, permitting platform, or live work-order app. Use it when you need structured reporting, not field dispatch or automated operational control.
How to Use the Recycling Infrastructure Dashboard in Excel
- Download and unzip the Excel dashboard package.
- Open the workbook in Microsoft Excel.
- Go to the Data sheet and replace sample records with your own recycling infrastructure data.
- Keep the same column structure for best results.
- Go to the Excel Data ribbon and click Refresh All.
- Use slicers on the dashboard pages to review filtered results.
- Keep the Support sheet hidden if you want a cleaner user workbook.
Real-World Use Cases
Anita, municipal recycling manager: Anita uses the Overview page before monthly review meetings to explain waste tonnage, recycled tonnage, costs, emissions avoided, and facility rating.
Rahul, sustainability analyst: Rahul uses Material Flow to compare recycling rates by material stream and emissions avoided by region for environmental reporting.
Meera, operations finance lead: Meera uses Cost Analysis and Facility Ops to compare operator costs, funding sources, monthly collection cost, and cost per tonne.
Frequently Asked Questions
Do I need advanced Excel skills?
No. You can use the workbook by updating the Data sheet and refreshing the pivots. Advanced users can customize charts, formulas, and pivots.
Can I replace the sample data?
Yes. The Data sheet is designed for replacing the sample records with your own recycling infrastructure data in the same format.
How do I refresh the dashboard?
After updating the Data sheet, go to the Excel Data ribbon and click Refresh All. The pivot tables and charts will update.
Can I hide the Support sheet?
Yes. The Support sheet contains pivot tables and can be hidden after setup.
Does this template include slicers?
Yes. The dashboard pages include slicers so you can quickly filter the analysis.
Is this a live waste management system?
No. It is an Excel dashboard template for reporting and analysis, not a live operational system.
About the Author
Built by PK – Microsoft Certified Professional with 15+ years of Excel, Google Sheets, and Power BI experience. Founder of NextGenTemplates, reaching 300K+ subscribers across YouTube channels. Every template is hand-built and tested before release.
Explore Related Templates
- Recycling Infrastructure KPI Dashboard in Excel
- Recycling Infrastructure KPI Dashboard in Power BI
- Public Private Partnerships Dashboard in Power BI
- MS Excel templates
- Excel dashboard templates
Download the Recycling Infrastructure Dashboard in Excel and turn recycling, facility, cost, material flow, and project status data into a reusable Excel reporting system.
Last updated: August 1, 2026
Watch the demo video:
Compatibility and Requirements
- Works in Microsoft Excel desktop (Excel 2016 or later, or Microsoft 365).
- The dashboard pages use slicers to filter the data. Microsoft explains them in Use slicers to filter data.
More Questions About This Template
Which sheets are included?
Seven sheets: Overview, Material Flow, Cost Analysis, Project Status, Facility Ops, Data and Support.
Which KPIs are on the Overview page?
Total Waste Tonnage, Total Recycled Tonnage, Total Collection Cost, Total Emissions Avoided and Avg. Facility Rating.
Is there a Power BI version?
Yes. See the Recycling Infrastructure Dashboard in Power BI. A lighter KPI-focused edition is also available as the Recycling Infrastructure KPI Dashboard in Excel.
Can I compare costs by operator and funding source?
Yes. The Cost Analysis sheet shows processing cost by operator and collection cost by funding source, plus cost per tonne by infrastructure type.





























Reviews
There are no reviews yet.